Bollinger Bands and Awesome Oscillator trading strategy: can the trader win?
The next strategy to be backtested in line is the trading strategy using Bollinger Bands and Awesome Oscillator.
The strategy itself is quite simple and comprehensible even for the beginner traders – the entry points are easy to identify. However, is it so easy in action as it seems?
In the case, you are curious to learn what were the results of the MACD strategy backtesting, read the full article here.
If you wonder how we came up with the idea of this backtesting experiment, read the full version here.
A Couple of Words About Indicators
Bollinger Bands indicator consists itself with 3 Bands – Upper, Middle and the Low Band accordingly. The Upper and Low Bands form a kind of Resistance and Support levels and the width between them or the Price location according to them provide numerous signals about the trend, possible reversals or the further continuations.
Another great thing is that Bollinger Bands is the kind of complex and inclusive indicator so it can be read in several different ways.
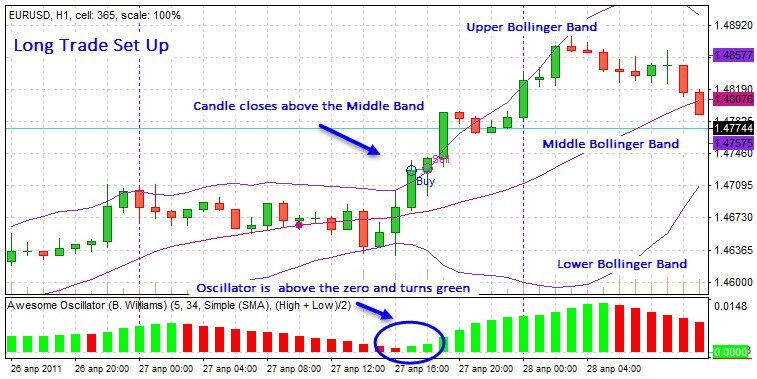
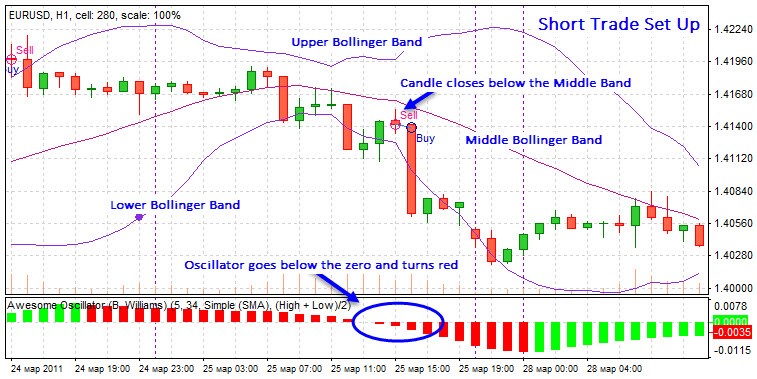
For this specific strategy, we will use the signals from the candlestick cross of the Middle Band of The Bollinger Bands, taking as a fact that candlestick closing over the Middle Band signals about uptrend starting and vice versa – a candlestick closing below the Middle band provides signals about downtrend about to begin.
As a compound system itself, the Bollinger Bands indicator can provide signals of the trend ranges and reversals. However, accompanied with the Awesome Oscillator it creates a perfect pair of the indicators for the most precise signals of the trade entries. Awesome Oscillator is a great tool to check the strength of the trends.
Awesome Oscillator is the histogram with the slopes crossing the zero level, turning red or green according to the strength of the Bullish or Bearish trend.
As well as the Bollinger Bands, there are 3 different options to trade the Awesome Oscillator, but for this particular strategy we use the next way to trade it:
- we perceive the zero line cross by the slopes of the oscillator as the signals to open the buy/sell trades – the cross from up to down signals the momentum of the short trade and the cross from down to up signals about the long position momentum.
However, feel free to try different options, because their diversity open up new backtesting and trading opportunities.
Technical Information
Indicators: Bollinger Bands (20;2), Awesome Oscillator.
Timeframe: 1 hour.
Currency pair: any, but EURUSD preferable.
Stop Loss/Take Profit: 20 pips*
* We adjust the equal number of the SL and TP in order to ease the math calculations and make the results more illustrative; however, you can adjust the size of the SL and TP reasonable for you or set it manually for every trade.
**If you want to set it manually, put your ST at least 2 pips below the closest swing low and TP above the previous swing high for the long trades and vice versa for the short trades.
Buy Entry Rules:
- The price breaks the Middle Bollinger Band and the Bullish candlestick closes above it.
- The slopes of the Awesome Oscillator cross the zero level up and turn green.
- On the candlestick where these two conditions are met, you open the Long trade.
- In the case the candlestick breaks the Middle band and the Awesome Oscillator still doesn’t provide with the signal to enter the trade, wait for the green bar to appear above the zero line (in the case if the price is still above the Middle Band).
Sell Entry Rules:
- The price breaks the Middle Bollinger Band and the Bearish candlestick closes below it.
- The slopes of the Awesome Oscillator cross the zero level down and are red.
- On the candlestick where these two conditions are met, you open the Short trade
- The same as stated above, wait for the red bar to appear below the zero and enter the trade in the case if the price is still under the zero level.
Backtesting Results
| Market | Training set | Forward testing |
| Bull | 45 pips | 90 pips |
| Bear | 15 pips | 0 pips |
| Flat | 120 pips | -45 pips |
Trades|Period*
| Market | Training set | Forward testing |
| Bull | 01/03/2011 - 03/05/2011 | 09/06/2010 - 06/07/2010 |
| Bear | 01/01/15 - 18/03/2015 | 01/09/2014 - 23/09/2014 |
| Flat | 01/09/2016 - 09/11/2016 | 04/05/2015 - 08/06/2015 |
A Reminder: in order to save your valuable time and efforts, we have introduced the system of backtesting when you perform only 50 trades through 3 different types of market (Bullish, Bearish and Flat markets) and then again 20 trades through the given types of market, but during other periods. Then with simple math calculations, we can make conclusions about effectiveness or irrelevance of the chosen strategy.
The full version of the theory of our backtesting experiments and how did we came up with the idea of such backtesting you can read here.
Conclusions
Unfortunately, within the given setting, timeframe and the listed above rules the strategy turn out to be a disappointment.
As expected, the most unpredictable performance was during the Flat markets – as this kind of strategy is based on the trend trading during the ranging markets this pair of indicators can provide the trader with the false signals.
Should a trader discard it? Definitely not. We strongly recommend to check the “Further Adjustments” section below - we have listed some recommendations how you can try different settings and how even the slight changes can result into the drastically changed outcomes of the trading.
As you can see, the main idea of our backtesting experiment was to show that:
- The price breaks the Middle Bollinger Band and the Bullish candlestick closes above it.
- The slopes of the Awesome Oscillator cross the zero level up and turn green.
- On the candlestick where these two conditions are met, you open the Long trade.
- In the case the candlestick breaks the Middle band and the Awesome Oscillator still doesn’t provide with the signal to enter the trade, wait for the green bar to appear above the zero line (in the case if the price is still above the Middle Band).
Further Adjustments for Better Results
What particularly can be a matter of the additional change and backtesting?
- Refer to the section where the indicators are described – as there are various ways to read the signals, you can pick another way if you think it can be more precise;
- Again - custom settings of the indicators can reveal better sides of the trading system – we have use the default ones.
- Stop loss and take profit – we have tried the preset number of the Stop Loss and Take Profit, but check how to adjust them manually as we have mentioned above.
- Timeframe and the currency pair – try this strategy for scalping or the daytrading;
- Check how these indicators can perform alone or in combination with other ones. Maybe you know the third one that can add up to these two.
Please, take into the account that our floating spread is set to 1. Do not forget that the size of the spread matters and the larger it is, the bigger should be the profits to cover it up.
As you can see, adjust, test and then change accordingly – is the only possible way to find the options suitable for YOU.
There are dozens of the ways to trade the indicator alone or with the combinations with other ones. We show only one way to trade, however, nothing should stop the curious minds to try different settings and check how it can influence the final results.
Try It Yourself
As you can see, backtesting is quite simple activity in case if you have the right backtesting tools.
The testing of this strategy was arranged in Forex Tester with the historical data that comes along with the program.
To check this (or any other) strategy’s performance you can download Forex Tester for free. In addition, you will receive 23 years of free historical data (easily downloadable straight from the software).
Are you one of the Bollinger Bands’ fans or do you favor other indicators instead? Share your opinion if you have tried this combo of the indicators before and what were the results.
Have you ever try the Bollinger Bands indicator with the custom settings?
What do you think about this strategy in general? Does it sound promising to try?
What is your favorite indicator?