You still do not believe that the price history repeats itself? Then the Сommodity Сhannel Index is exactly what you need!
The first mentioning of CCI or index of the commodity channel appeared in October 1980, when Donald R. Lambert published analytical article in the journal Commodities.
The author successfully worked in commodity markets, experimented with the analysis of volatility and developed the Сommodity Сhannel Index almost by accident − to test the hypothesis of a cyclical price. Today this indicator has become an indispensable element in the arsenal of any active trader.
So let’s begin.
Logic and purpose
Technical analysts have stated for a long time about the cyclicity of the market, let us recall at least Elliot with his famous Wave Theory. The idea is that the price of any asset is not moving erratically, and in accordance with the technical and fundamental cycles, is in detail developed by Donald R. Lambert in the book «An index of the commodity channel: tools for trade on cyclic trends».
But even prior to the publication of the book, the benefits of the indicator were tested by practice on various trading assets, especially if you correctly determine the cycles − in terms of amplitude and time − you can «see» in time the beginning and end of any trend in the market.
The mechanism for calculating the indicator assumes that if the price deviates from its moving average by an interval greater than the «characteristic» deviation for a given period, then this fact is a reliable sign of a change in the direction of the trend.
The logic of the CCI indicator is traditional for the oscillator: after some calculations we get the characteristic of the cycle − the value of the indicator, which oscillates around the zero line. A turn from the critical zones (-100) and (+100) indicate that the trader need to prepare for the opening of the transaction against the current trend.
Calculation procedure
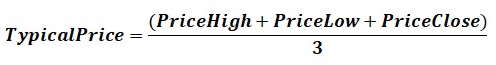
The calculation of the Сommodity Сhannel Index indicator consists of several stages. First of all, we expect the «typical» price that is dear to all commodity markets:
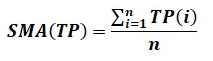
From a typical price, we calculate a simple moving average
We move on. We calculate the value, which in statistics is called probable (or middle) deviation:
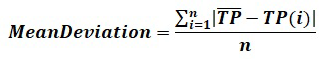
where
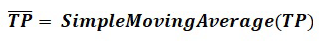
The values of the CCI indicator are determined by the following formula:
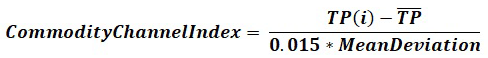
If the presence of the parameter n − the calculation period in this formula − looks natural, then the usage of the coefficient for «scaling» the result is considered the author's idea.
For this formula, Lambert set the constant at 0.015 − in which case 70-80% of the Commodity Channel Index values fall within the range (-100, +100). Of course, the value can be changed, but the facts of successful application of the indicator with another parameter in Forex are not yet known .
Parameters and control
The CCI indicator is included in the standard package of all popular trading platforms, the oscillator line is located in an additional window under the price chart. Traditionally, a zero (balance) line is used, as well as two pairs of overbought/oversold levels (-100; +100) and (-200; +200).
The longer the calculation period, the less volatile the indicator line turns out and its signals will be more reliable. Reducing the calculation period will make the line more sensitive to «market noise» and lead to a lot of false turns in critical areas.

Standard version of the indicator Сommodity Сhannel Index
The choice of the period depends on the average volatility of the trading asset, the analysis period and, ultimately, on the personal preferences of the trader.

A long and short period in the Сommodity Сhannel Index
The author recommended the value of 1/3 of the full cycle as the main parameter of the CCI indicator, for example, if the cycle of oscillations is determined in 20-30 days (1 month), then choose the value 10.
In practice, it makes sense to apply this logic only for futures assets − there are more stable, and most importantly − predictable volatility. For currency assets in medium-term strategies (from H4 and above), Lambert successfully used the value 20, recommended parameter 60 for long-term trading.
The default value of 14 is confidently used for the main currency pairs, in any case, for the trader the main thing is to get into the trend.
Let’s look at it in detail.
Trade signals of the indicator
Traditionally we are looking for trading signals of an oscillator:
it is assumed that most random values of Сommodity Сhannel Index fall within the range (-100; +100). Movements beyond these boundaries are considered non-random and create opportunities for transactions.
Standard signals:
- we buy when the indicator line turns from the oversold zone − crosses the line (-100) from the bottom up;
- sell, if there is a turn from the overbought zone − crossing the line 100 from top to bottom;
- if the price goes above the mark (+200) or lower (-200), then the turn will happen much faster.
Careful traders can wait for the breakdown of the indicator's zero line.

Trading signals of the CCI indicator
According to the theory, you need to close the deals on the reverse turn: down or up − respectively. But with reasonable management it is recommended, at a minimum, to close part of the open positions already when the indicator «hangs» in the zone of the balance line.
CCI signals can be used as an input filter. For example, you should not open a purchase, if the indicator line moves above the level of +200 − the bullish trend is already waning, and vice versa, do not look for the entrance to the sales, as it is considered that, breaking the mark of +200, the market is losing power.
Or, conversely, do not consider sales if the Сommodity Сhannel Index demonstrates a steady growth in the range of 0 to 100.

Trading schemes for divergence and flat on CCI
A strong trading signal is the appearance of a divergence with a price chart, as well as the breakdown of the trend lines on the indicator (between successive max/min): breakdown − buy, breakdown − sale (see Using Graphic Tools ).
The result?
Using CCI to determine the trend is associated with the connection of the growth rate with the strength of the current trend.
Turn signals can be used for periods from H1 and higher, because on smaller timeframes the line will display the usual price «noise». Active dynamics of trading volumes in periods of news or other speculations distort the behaviour of the indicator (see here).
Application in trade strategy
Be sure to note the most popular Woodie strategy based on the modified CCI. Habitual interpretation of the signals of a colour histogram and two moving averages reduces the risk of an unsuccessful transaction to a minimum.

Commodity Channel Index: scheme of the trading signals of a Woodie strategy
Stable complex systems are obtained from classical indicators, for example, from a long moving average and MACD with typical settings (also can be seen Using Indicators). You can also see here.

Commodity Channel Index: Moving Average as basic trend
Other strategies can be found here and here. Another example how to use the CCI line is to monitor the MACD histogram signals:

The chart of trading signals of the integrated strategy CCI
Several practical remarks
Despite the entire positive aspects (see above!), do not forget that the Commodity Channel Index was created for cyclical markets, and therefore works reliably only where it is possible to clearly distinguish the regular price structure.
What this means is:
All signals of the indicator must necessarily receive confirmation from trend instruments, or at least from oscillators with a different calculation technique.
On a Forex it is difficult to «diagnose» the cycles, respectively, to choose the optimal period for the CCI − an uneasy task.
Those who are ready to use the CCI indicator as the main oscillator of the trading strategy, we recall: the most reliable signals are obtained on timeframes from H1 and above, the calculation period is at least 9 and not more than 50.
Try It Yourself
After all the sides of the indicator were revealed, it is right the time for you to try either it will become your tool #1 for trading.
In order to try the indicator performance alone or in the combination with other ones, you can use Forex Tester with the historical data that comes along with the program.
Simply download Forex Tester for free. In addition, you will receive 23 years of free historical data (easily downloadable straight from the software).
Share personal experience of effective use of the indicator CCI. Was this article was useful to you? It is important to us to know your opinion.
What is your favorite indicator?