Industrial production as a fundamental factor in financial markets
From a statistical point of view, the industry consists of a bundle of general components: raw materials — technology — energy resources, and all of them are hiding behind the change of the industrial production volume value.
The dynamics of the industrial orders and storage reserves affect the demand for raw materials, and energy resources are necessary for technologies to work. And basically it doesn’t matter which segment in a separate field is in priority — they increase or decrease relatively synchronized.
A separate word must be spoken about industrial raw materials. Commodity companies have to follow the dynamics of industrial orders extremely sensitively to forecast future demand. It is under the future demand that capital investments and long-term crediting are made with the attraction of large financial players, which most often hold their shares in such business.
The price for raw materials is a reflection of not today, but tomorrow, and the shortage of raw materials or their excess, including artificially created, is a strong factor for market manipulations, including the financial market.
Any industry is an area of interest of large capital, so production statistics make the strongest speculative pressure on the stock market, and only ‘secondary waves’ are visible on the currency market. But they also can be very dangerous for an ordinary trader, so let’s begin.
Industrial production indicator
Such an indicator (in different formulation) is included in the set of the necessary leading countries statistics, but the market is mostly affected by American data.
In the USA statistic, the account for production is conducted by establishments grouped by 255 branches. The Industrial Production Index (IP) indicator measures the change of common production in the large and secondary engineering, energetics, gas industry, and other ‘consuming’ branches, but excluding the building.
IP is considered the leading occupation indicator in the manufacturing industry, average earnings and personal income. It is one of a few indicators, which are calculated directly by FRS. 39% of the index are based on the physical data of the production volume, the remaining part of the index is based on worked hours of employed, and the data on spent energy sources.
The indicator is measured by index in % — full value and index change per month. The common index with the production of the building sector is published in the same report and is called Manufacturing Production Index.
American report on IP is divided into industrial and market groups, but this data has a sense only for the stock market analytics.
Production growth (as a rule) leads to an increase in demand for workforce and therefore a decrease in the unemployment rate. What this means is the growth of the industrial production index positively affects the income of companies, GDP, stock indexes.
The indicator strongly affects the market: the data higher of the forecast is considered positive (bullish) direction of the USD, and the indications below expected provoke the negative (bearish) direction (see Use Indicator).
Business Inventories and Sales
These numbers are very useful exactly for their cyclicity; the sources of information on them are represented by goods manufacturers as well as wholesale and retail chains.
The numbers are published on a monthly basis in the form of three indicators: Business Inventories and Sales, and Inventories to Shipments Ratio (INSR). Business Inventories and INSR are lagging indicators of the business cycle: it is suggested that inventories grow faster on the recession stage rather than during replenishment.
Wholesale inventories indicator forms a vision of wholesale and retail trading tendencies, which (potentially) can affect the economy as a whole. For example, the process of storages hoarding tells about problems either with production or logistics. The indicator depicts a limited impact on the market: growth has a negative effect on the USD exchange rate.
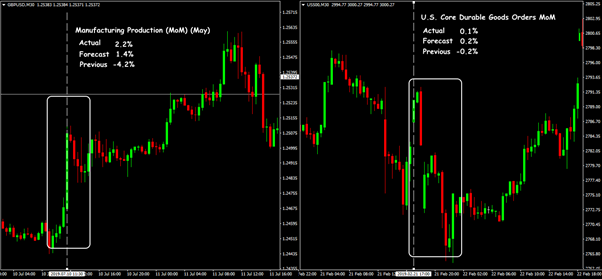
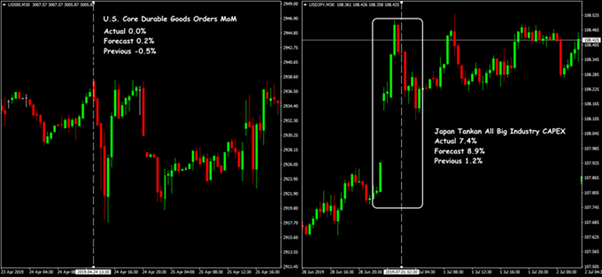
Durable good orders
This is a part of monthly statistics within global reports on the production and trading sectors. Let’s look at it in detail: new orders are defined as an ‘intention to buy’, immediately or in the future, certain goods which are confirmed by the documents (shipment contract, deposit, letter of intent).
Durable goods are the products with a lifetime over three years (auto, hardware, furniture), but manufacturers get to the release of production only after receiving the confirmed volume of orders.
As soon as orders are submitted, facilities begin to search a loan capital: most often, banks appear to be providers of such capital, and assets of the establishment stand as the deposit. That’s why the stock market is the first to react to success of this business.
The indicator does not take into account the orders for the defence industry and transportation. It is usually measured in %, but in the extended version of the report, there is data on the absolute volume of orders in $ millions. Based on the orders in the construction sector, the Manufacturing Orders indicator is calculated.
The indicator value is predicted by the NAPM industry optimism index, and the indicator itself has a decisive influence on the general report on industrial orders.
The indicator is important for the foreign exchange market since an increase in the number of orders raises the assessment of consumer confidence and leads to the growth of the national currency.
Capacity Utilization, CAPU
CAPU is the relation of the overall industrial output to the total productivity value (potential output volume) of sectors. It is an extremely important indicator of the real production condition: it characterizes the margin of safety taking into account the seasonality and in case of sharp increase of orders, and the ability of the industry to resources mobilization.
It is important to understand which level of capacity utilization is optimal because a high index tells that a certain manufacturer (or sector) is unable to satisfy the dynamic demand, and this is considered a negative factor.
In general, throughout the industry, the optimal level is at the range 70%-80%. It is published monthly at the same time with the data on industrial production.
The indicator has important significance for the currency market because of its tight relation with the dynamics of the business cycle, due to which it will serve as an additional benchmark for the market in hard moments, showing possible future solutions of central banks. The growth of this indicator leads to an increase in the national currency exchange rate.
Philadelphia FRB index (USA)
The index estimates the economic stability of the industrial sector in the area of Philadelphia: more than 0 — appreciation (bullish trend of the USD), below 0 — negative tendencies (bearish market for the USD).
The data is taken from the survey of near 250 manufacturers in the Federal District of Philadelphia. The indicator helps to forecast ISM of the USA.
Productivity and Costs
It is an important quarter indicator for analysis of the economic condition that shows the change of the released production volume per one worker.
The fall of labor productivity can cause a decrease if the currency exchange rate, but sometimes the data may be confusing. Thus, in periods of economic deceleration (or as a result of strike actions), decrease in the number of engaged workers on the production causes the rise of productivity.
The growth of the index is considered a positive factor and leads to the bullish trend of USD.
Unit Labour Cost
The index estimates production expenses per a production unit, which seriously characterizes the effectiveness of the national economic development and dynamics of inflation processes, connected with the salaries increases.
The indicator is usually analyzed in the bundle with the Productivity indicator. The increase in the production unit value along with the growth of the labor productivity can lead to the necessity of raising the general interest rates, which in its turn will be a positive factor for the USD growth.
Several practical remarks
What is the result?
Except for a few countries with hard economic regulation, today almost all the industry works strictly ‘on order’.
Indeed, the main indicator of the change in the industrial production volume reflects what has already happened, and that’s why its information is not good for news speculations. That is why we don’t bring the summary table of indicators with the reaction of the major currencies.
The industrial production statistics are used only as a method of estimating potential rates of the economic development and examining the correctness of trading solutions.
In general, these indicators, except for any extreme situations, barely affect the exchange rate, the reaction for it is stronger on stock assets.
However, no less than one-fifth of the economy of any country in the world accounts for industry, that’s why it is possible to make predictions for the dynamics of GDP growth through the indicator of industrial production. Dynamics of these indicators give a possibility to forecast the investment activity of large establishments, which creates at least a mid-term and longer pressure for the currency market.
The official industrial production statistics can be seen here:
- https://www.bls.gov;
- https://ec.europa.eu/eurostat;
- https://www.stat.go.jp/english;
- http://www.stats.gov.cn/english;
and here — an incredible economic calendar: www.investing.com. Wishing profits for everyone!
Try It Yourself
As you can see, backtesting is quite simple activity in case if you have the right backtesting tools.
To check this (or any other) analysis performance you can download Forex Tester for free.
In addition, you will receive 23 years of free historical data (easily downloadable straight from the software).


