Strategy optimizer
In Forex Tester, we’ve added the Strategy Optimizer feature with AI-based algorithms. This feature allows you to select the optimal parameters for your automatic strategy (expert) to gain the best profit.
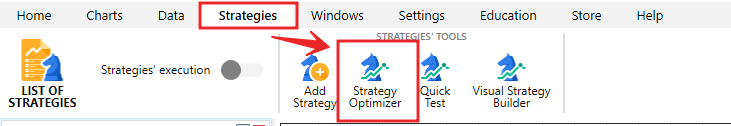
The “Strategy Optimizer” button is located on the Strategies tab.
Before optimization, you need to make a preliminary step and adjust the initial settings.
In the 1st stage of the initial, you need to select the Strategy (EA) from the list and add your custom strategy by clicking the “Add new strategy” menu item.
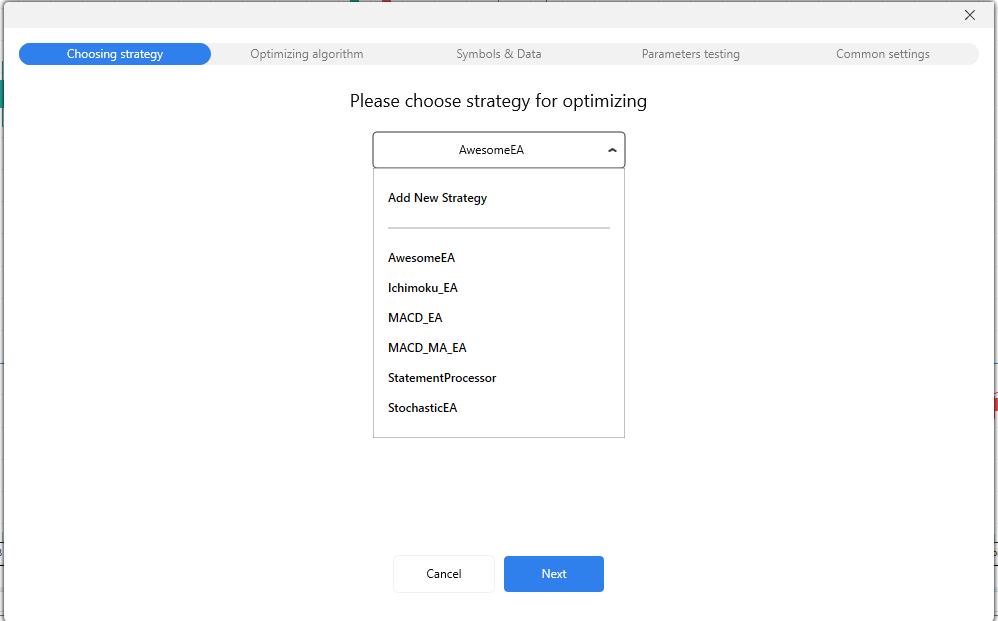
Let’s have a look at how the tool works on the AwesomeEA strategy example. After choosing the strategy, click Next.
In the 2nd stage, you need to select the optimization algorithm:
- Full grid. This algorithm is the simplest and lacks AI methods. Every test run (called iteration) goes through every single combination of a given set of parameters based on historical data. The more combinations, the more iterations, the more time it takes to get the results.
The method’s accuracy is the highest — up to 99%, but the speed is the lowest. The Full grid is available for all users even without Paid Data Service subscription. - Neural Network — an AI based algorithm. The complex mathematical formulas that underlie this algorithm can select the strategy parameters with a high level of accuracy — up to 95%. This precision is achieved by using a minimal dataset, so that you can get the result 10–100 times faster in comparison with a full grid (Brute Force) test.
- XGBoost — an AI based algorithm. Takes advantage of the most powerful and advanced ML technique, which allows performing parallel tree boosting to filter out inappropriate options as early as possible. It provides an even faster work than a Neural Network without loss of the result accuracy (up to 95%).
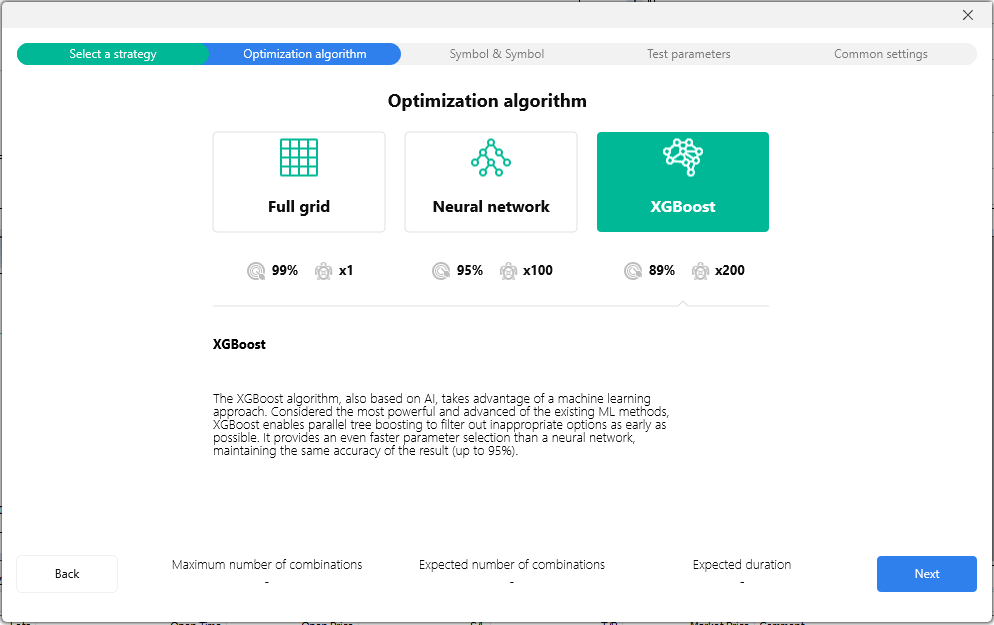
When you’re ready with the algorithm selection, click Next.
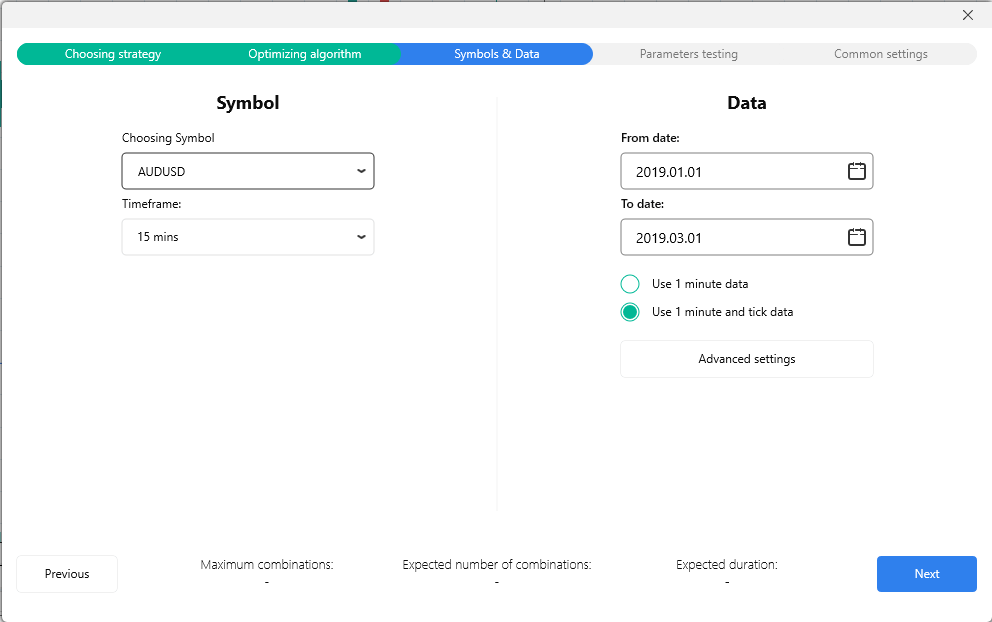
In the 3rd stage, choose the symbol and timeframe. It is also necessary to select the dates for the data on which the iterations will run.
Please check one of the options:
- Use 1-minute data (less precise, suitable for Basic and Standard data subscribers).
- Use 1-minute and tick data (more precise, recommended for Super data subscribers).
The Advanced settings button allows adjusting additional parameters, such as the Tick generation method and Floating spread.
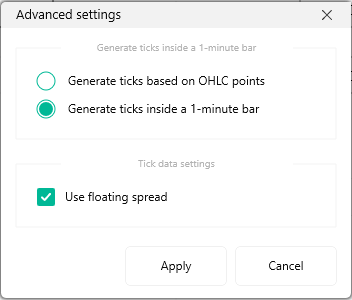
Generate ticks by OHLC points — if you select this method, each bar will contain 1-4 ticks based on Open/High/Low/Close values of the given bar (less than 4 ticks are possible in the situation when Open=High, or Low=Close).
Generate ticks randomly by volume — the number of ticks inside a 1-minute bar will be equal to this bar’s volume. Ticks will be distributed randomly inside a single bar.
We recommend using the first method of ticks generation, as it is the fastest and gives a good testing quality.
If you have activated the Use minute and tick data option, the Use floating spread option will be available in the advanced settings window. This feature is important for all intraday traders (timeframes M1, M5, M15, M30, H1) to obtain the most precise test results.
When all the parameters related to the symbols and data quality are set up, click Next.
In the 4th stage, you can work with your Strategy parameters that should be optimized. By default, all parameters are switched off for optimization, and you need to enable only those options that you think should be optimized. For example, let’s enable the Lot size parameter.
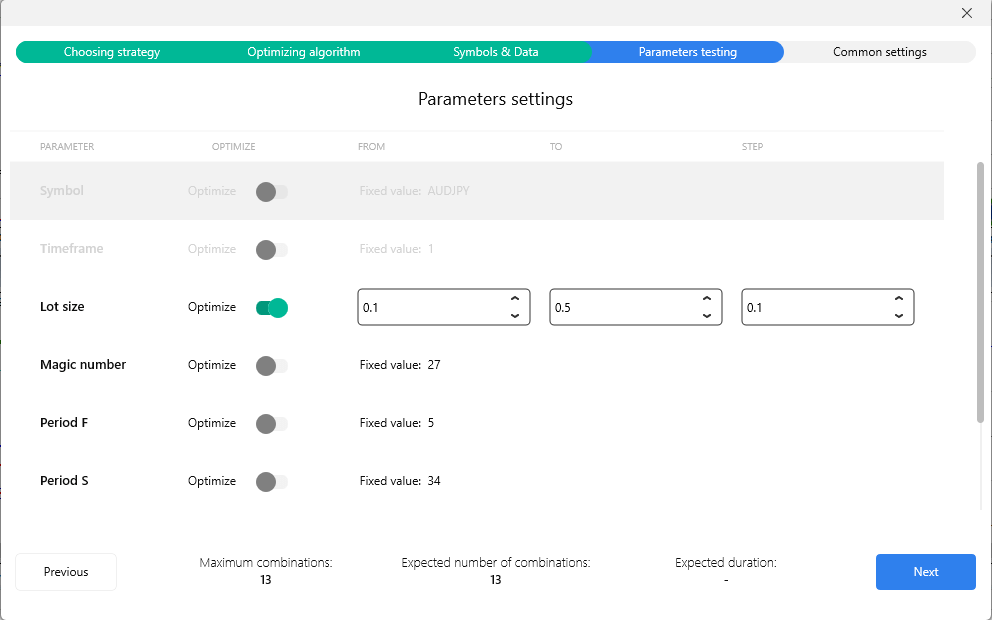
Enter the necessary values into the From, To, Step fields. You can leave the auto value in these fields, so that the algorithm will select the parameters at its discretion.
In our case, we’ve entered the following parameters for the Lot size optimization:
From = 0.1
To = 0.5
Step = 0.1
If you need to reset the setting value to auto, delete the entered symbols by pressing the Backspace key and click on any empty place of the window.
When all optimization settings are set up, click Next.
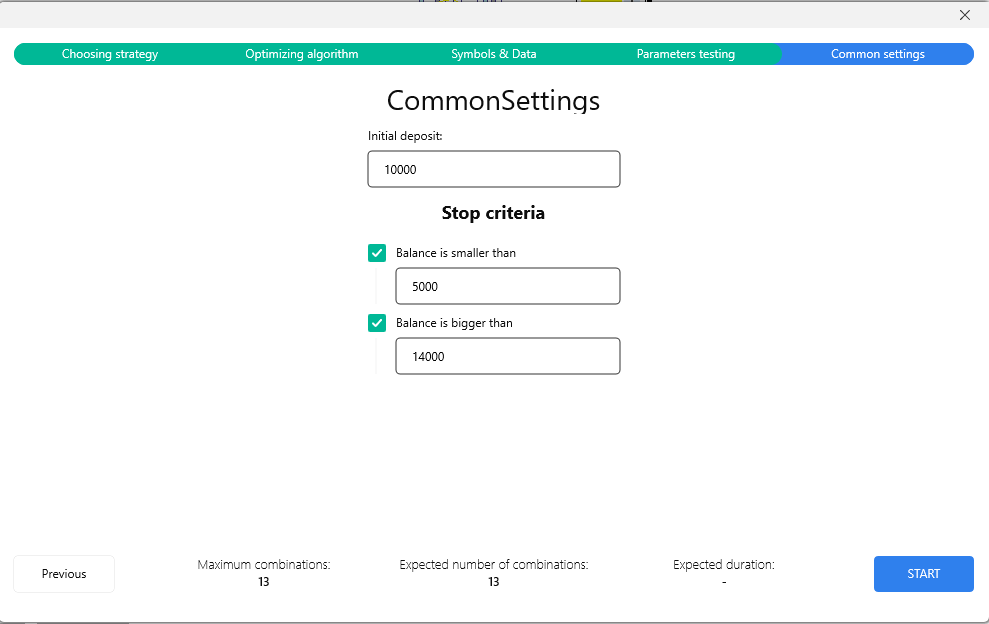
In the last stage, before optimization starts, specify your initial Deposit (Balance) and define the conditions when the optimization should stop immediately: Balance is smaller than (value) AND/OR Balance is bigger than (value).
Please note, the values in stop conditions should be different from the initial deposit.
When ready, click Start to begin the optimization process.
If you need to change some parameters, use the Previous button.
A tip: if you hover the mouse cursor on the headers of stages, you can see the parameters you’ve set up in the information popup.
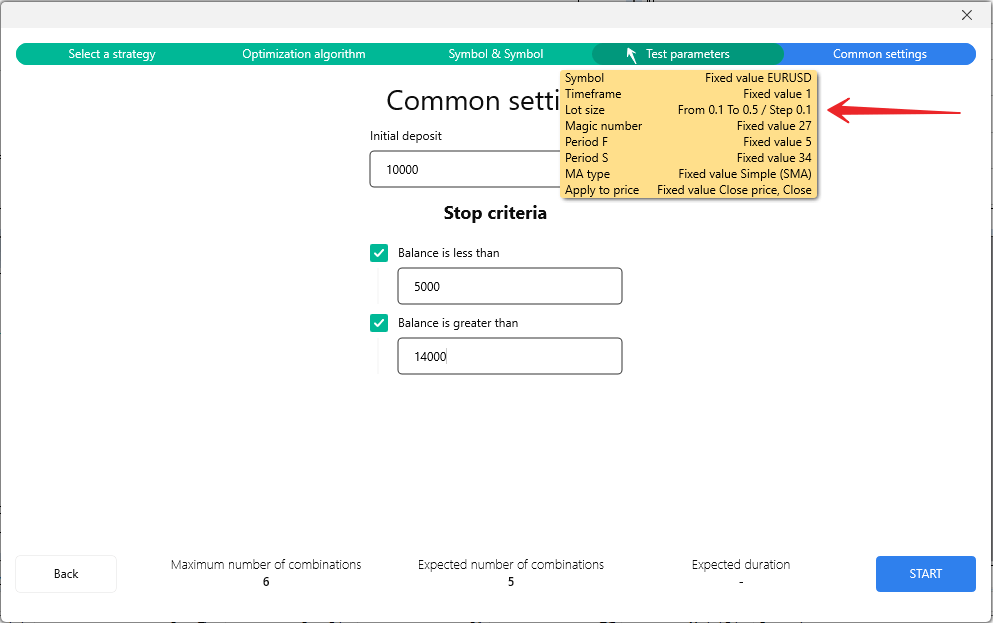
During the testing process, you can see the chart with control points appear and the progress bars for the current iteration and the whole process. To see detailed information about the particular point, hover the mouse cursor on it.
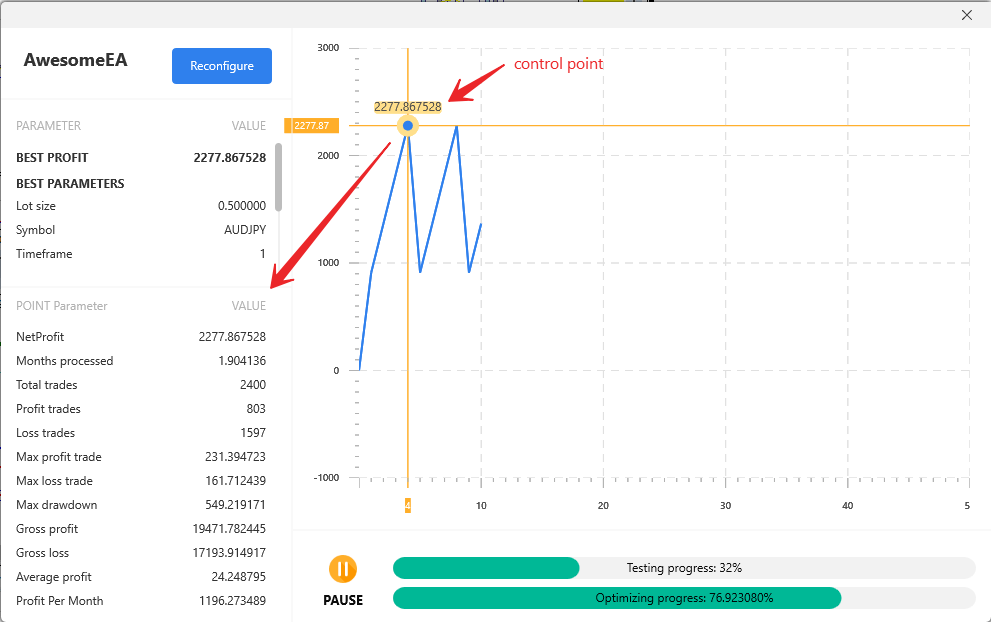
You can use the Pause button if you need to pause the optimization process for any reason.
If you want to change some settings during the test, click the Reconfigure button on the window’s left top. The Optimization summary window will be shown.
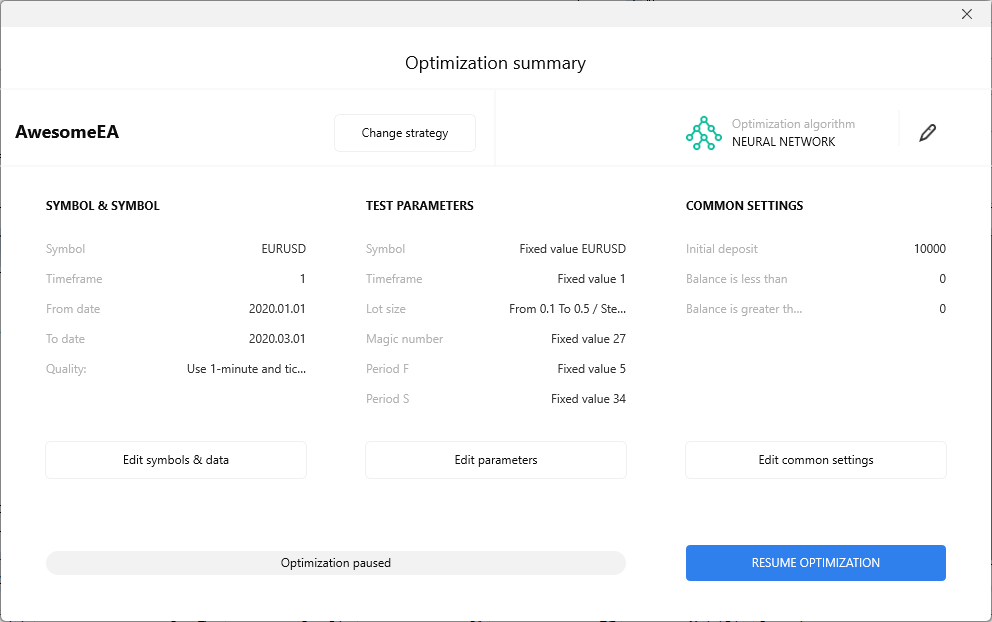
Note: you can change only the parameters of the strategy and common settings without restarting the test. Changing the strategy, symbol, and data will lead to a test restart, and all the results will be lost.
When ready, click the “Resume optimization” button to continue testing.
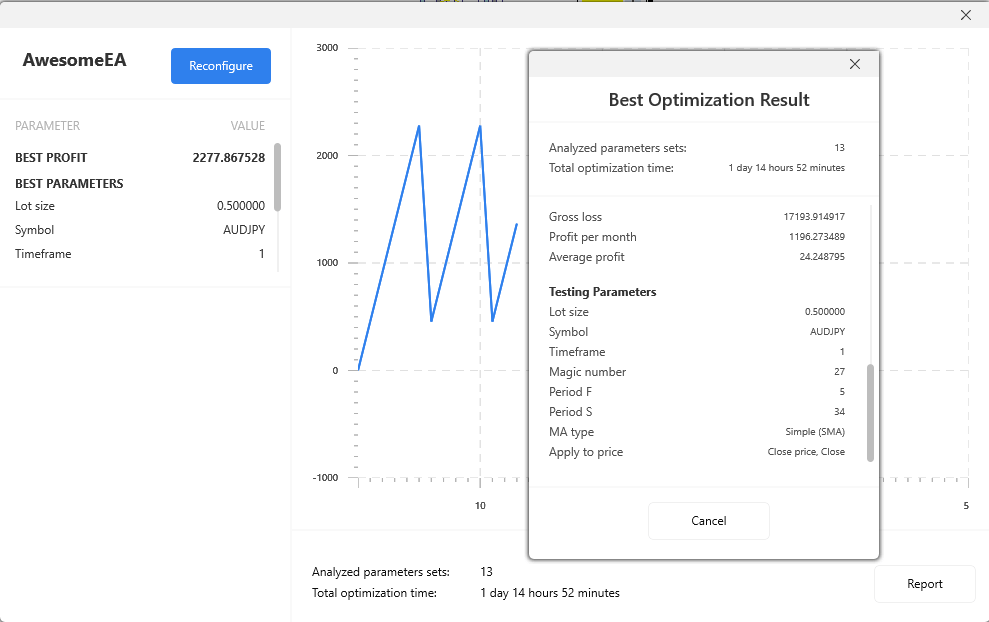
When the optimization is completed, you will see the report with general statistics of trades for this testing and the best parameters for getting the maximum profit. You can also see the best settings and profit after the end of every iteration in the left top part of the window.
In our case, the best profit is reached when the Lot size = 0.5.