English
 Deutsch
 Italiano
 Français
 Português
 ไทย
ไทย
 Tiếng Việt
 Polski
 Türkçe
 Nederlands
 Română
 한국어
한국어
 Svenska
 Español
Anchored VWAP — or AVWAP — is one of those tools that experienced traders swear by and beginners often overlook. Once you understand what it actually measures, you’ll see why institutional desks and retail swing traders alike have made it a staple of their analysis.
This guide covers everything: the definition, the math, how to pick anchor points, how the indicator actually functions as a trading tool, and how to test it against real historical data without risking a single dollar.
What Is Anchored VWAP? (AVWAP Definition)
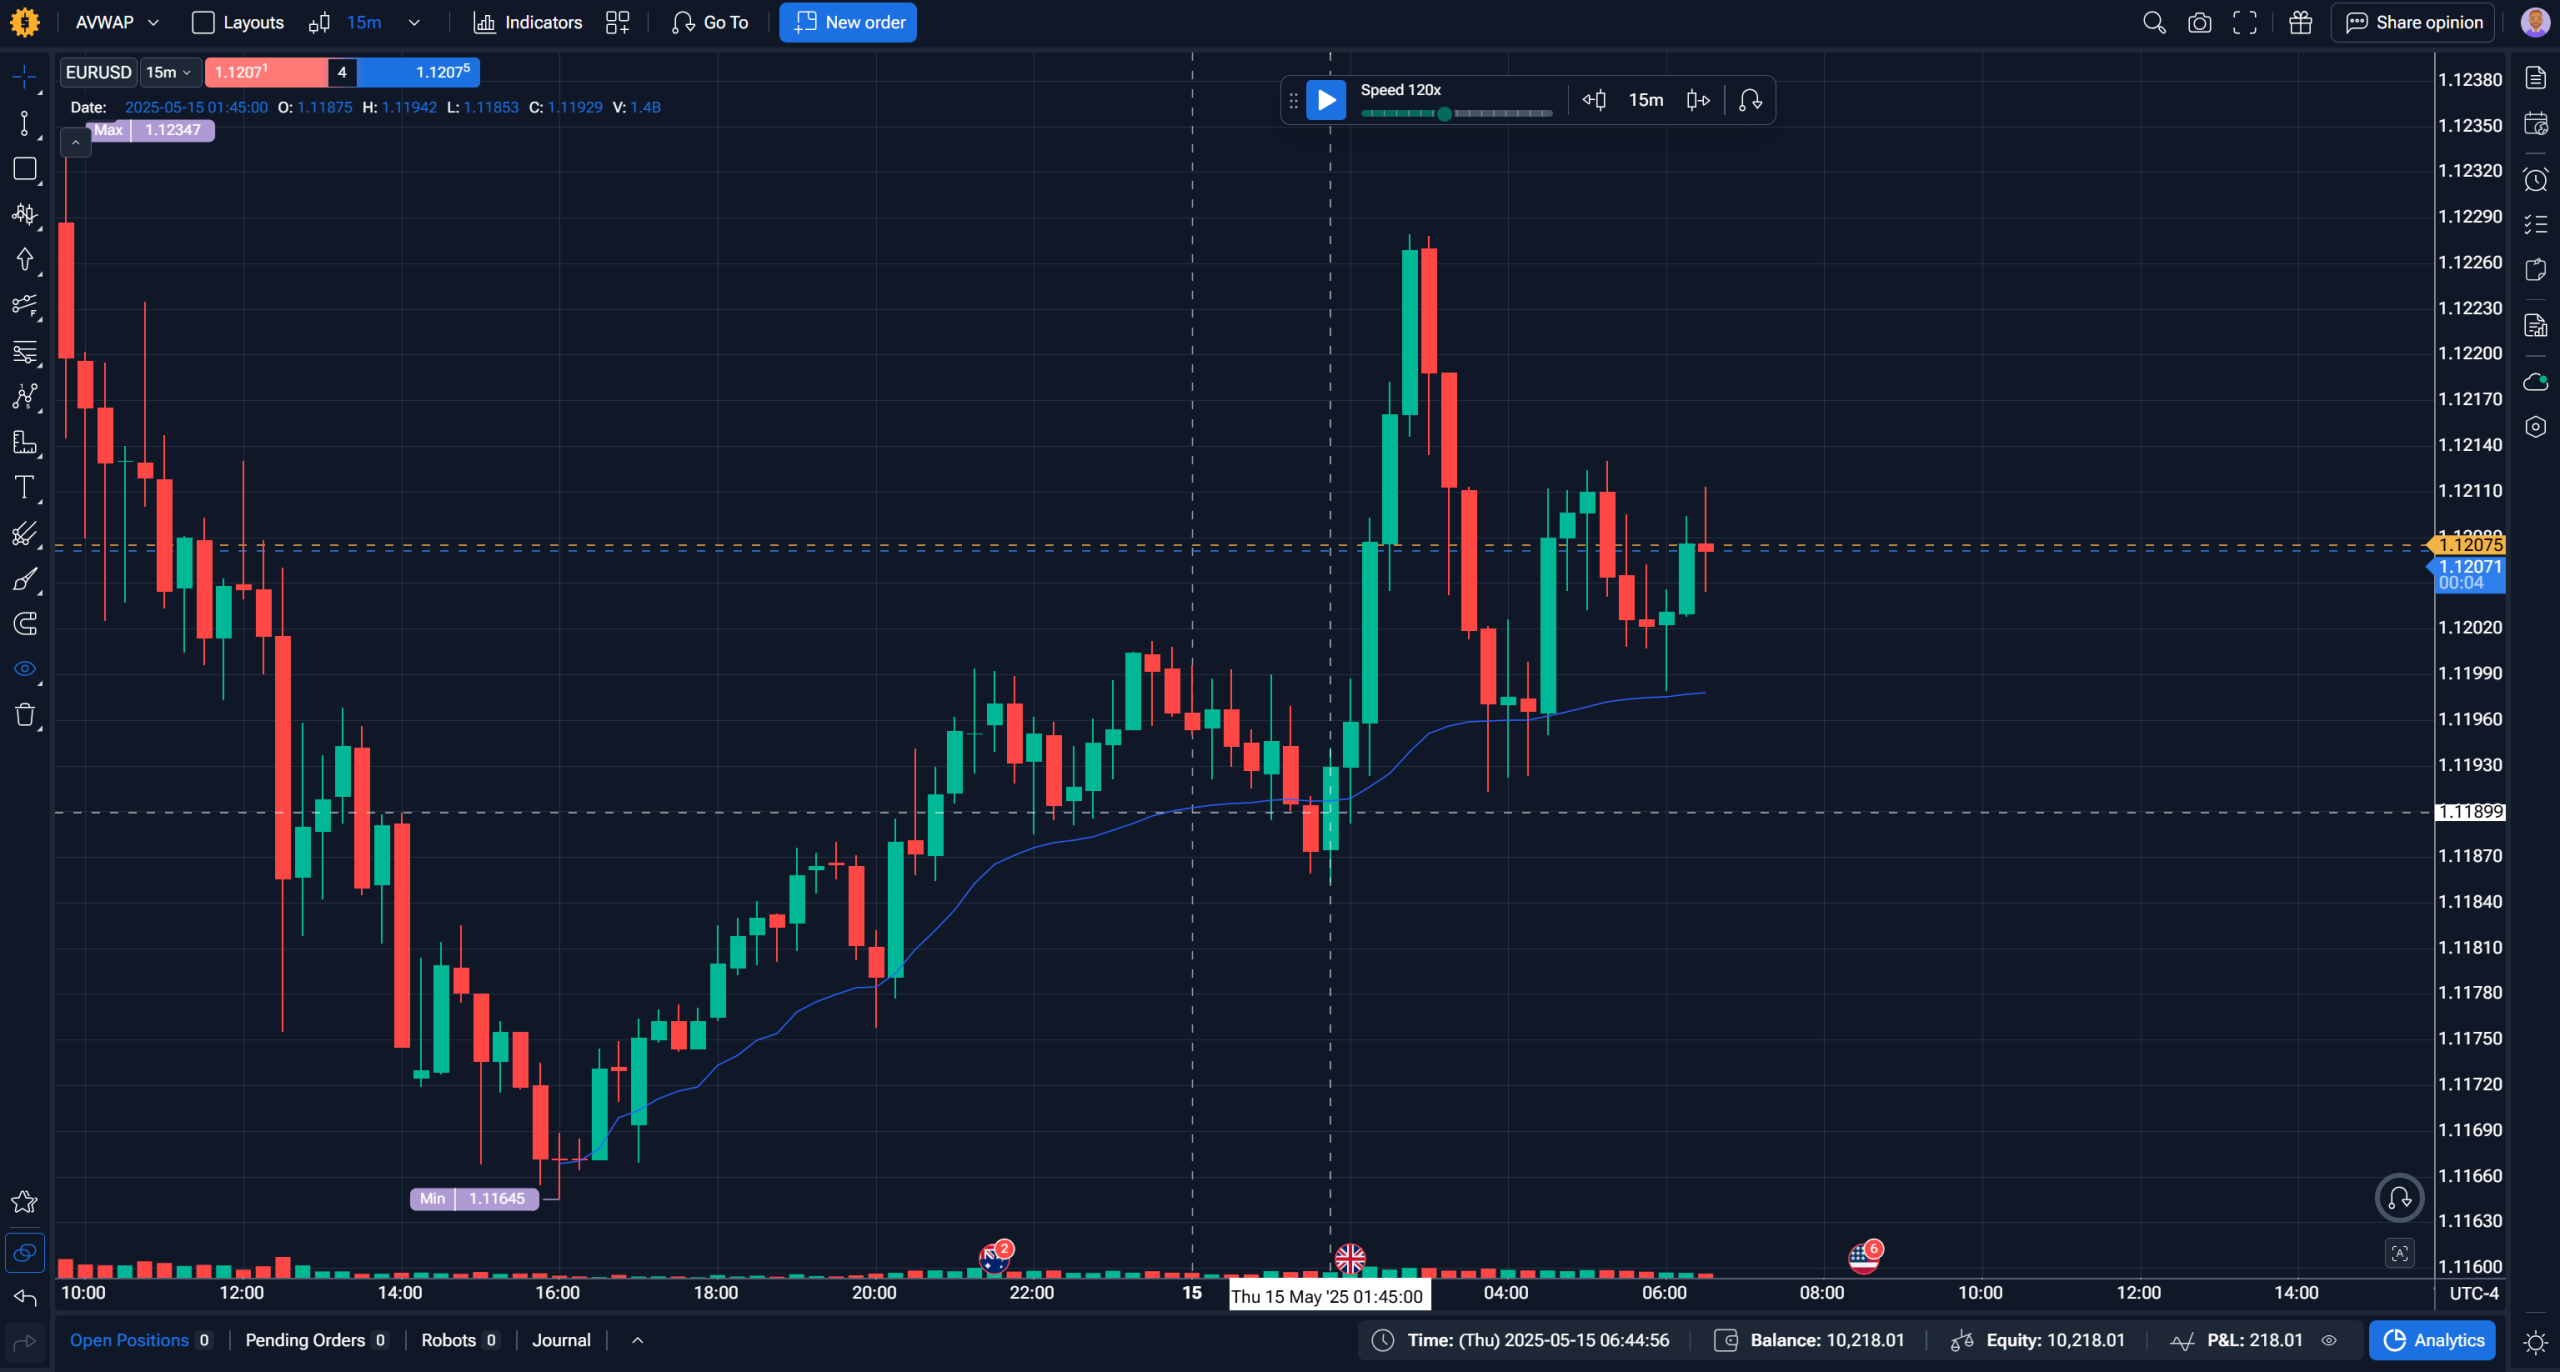
Anchored VWAP is the Volume-Weighted Average Price calculated not from the session open — like traditional VWAP — but from a specific candle you choose manually. That starting candle is called the anchor point, and it changes everything about how the indicator behaves.
The concept was developed and popularized by trader and educator Brian Shannon of alphatrends.net, who recognized that daily VWAP resets were hiding critical information about where participants entered the market since a meaningful price event. Shannon’s work on AVWAP methodology has since become the standard reference for the indicator.
Where traditional VWAP tells you the average price for today’s session, AVWAP tells you the average price since something happened — a breakout, an earnings release, a macro shock. In practical terms, it shows you the average cost basis of everyone who traded since that anchor candle. That’s what makes the line meaningful: it’s not just a moving average — it’s a reference point for whether a specific group of market participants is currently profitable or underwater, and therefore likely to defend the level or be forced to exit.I
If you’re already comfortable with best indicators for swing trading, AVWAP slots naturally into that toolkit as a dynamic support/resistance tool that adapts to where the market actually changed direction.
How Anchored VWAP Is Calculated: The AVWAP Formula
The AVWAP formula is a cumulative weighted average:
AVWAP = Σ(Typical Price × Volume) ÷ Σ(Volume)
Where Typical Price = (High + Low + Close) ÷ 3, summed cumulatively from the anchor candle forward.
Here’s a simple worked example across three candles, anchored at Candle 1:
| Candle | High | Low | Close | Typical Price | Volume | TP × Vol | Cumulative AVWAP |
|---|---|---|---|---|---|---|---|
| 1 (anchor) | 1.0820 | 1.0800 | 1.0815 | 1.0812 | 1,200 | 1,297.4 | 1.0812 |
| 2 | 1.0835 | 1.0810 | 1.0828 | 1.0824 | 950 | 1,028.3 | 1.0817 |
| 3 | 1.0850 | 1.0820 | 1.0840 | 1.0837 | 1,500 | 1,625.5 | 1.0824 |
The AVWAP line updates with each new bar — no daily reset, no gap at midnight. It reflects the true average cost of all participants who traded since your chosen anchor.
“Apply to price” — which price input to use. Most platforms, including Forex Tester Online, let you choose what price the formula applies to. The default — and theoretically correct — choice is (High + Low + Close) ÷ 3, the classic Typical Price. The other options are worth knowing:
- Close — more responsive, weights recent closes heavily; preferred by some intraday traders
- (High + Low) ÷ 2 — midpoint price, ignores close; reduces close-driven noise
- (Open + High + Low + Close) ÷ 4 — smoothest option, factors in the open
For most swing and event-based work, the default (H+L+C)/3 is the right starting point. Switching inputs shifts the line and changes where it intersects price — only do it with a clear reason.
Most platforms also let you add standard deviation bands around the line (±1σ, ±2σ, ±3σ). In Forex Tester Online these appear as Bands multiplier 1, 2, and 3 in the indicator settings. They work similarly to Bollinger Bands but anchored to the same starting point as the AVWAP — useful for gauging how far price has stretched before a reversion becomes likely.
How to Choose an Anchor Point
Anchor point selection is the most subjective — and most critical — aspect of using AVWAP correctly. A good anchor marks a genuine shift in market sentiment. A bad anchor is just a random candle, and the resulting line tells you nothing useful.
The five most reliable anchor types, in order of analytical strength:
- Swing High or Swing Low — The most common anchor. Marks where price reversed and where latecomers to the prior trend entered at the worst possible level.
- Earnings / Catalyst Date — Marks where a fundamental shift in valuation expectations began. Institutional cost basis since the event.
- IPO / First Trade Date — For stocks: the average cost of all participants since the company began trading publicly.
- Breakout Candle — The candle where price cleared a key structure level. Anchoring here shows whether buyers since the breakout are still profitable.
- Macro Event (FOMC, CPI, NFP) — Marks where macro repricing began. Useful for currencies and index traders tracking post-event positioning.
When NOT to anchor: avoid placing an anchor on a random low-volume bar with no structural significance. If you can’t answer “what changed here?” in one sentence, that candle shouldn’t be an anchor.
Swing High / Swing Low Anchoring
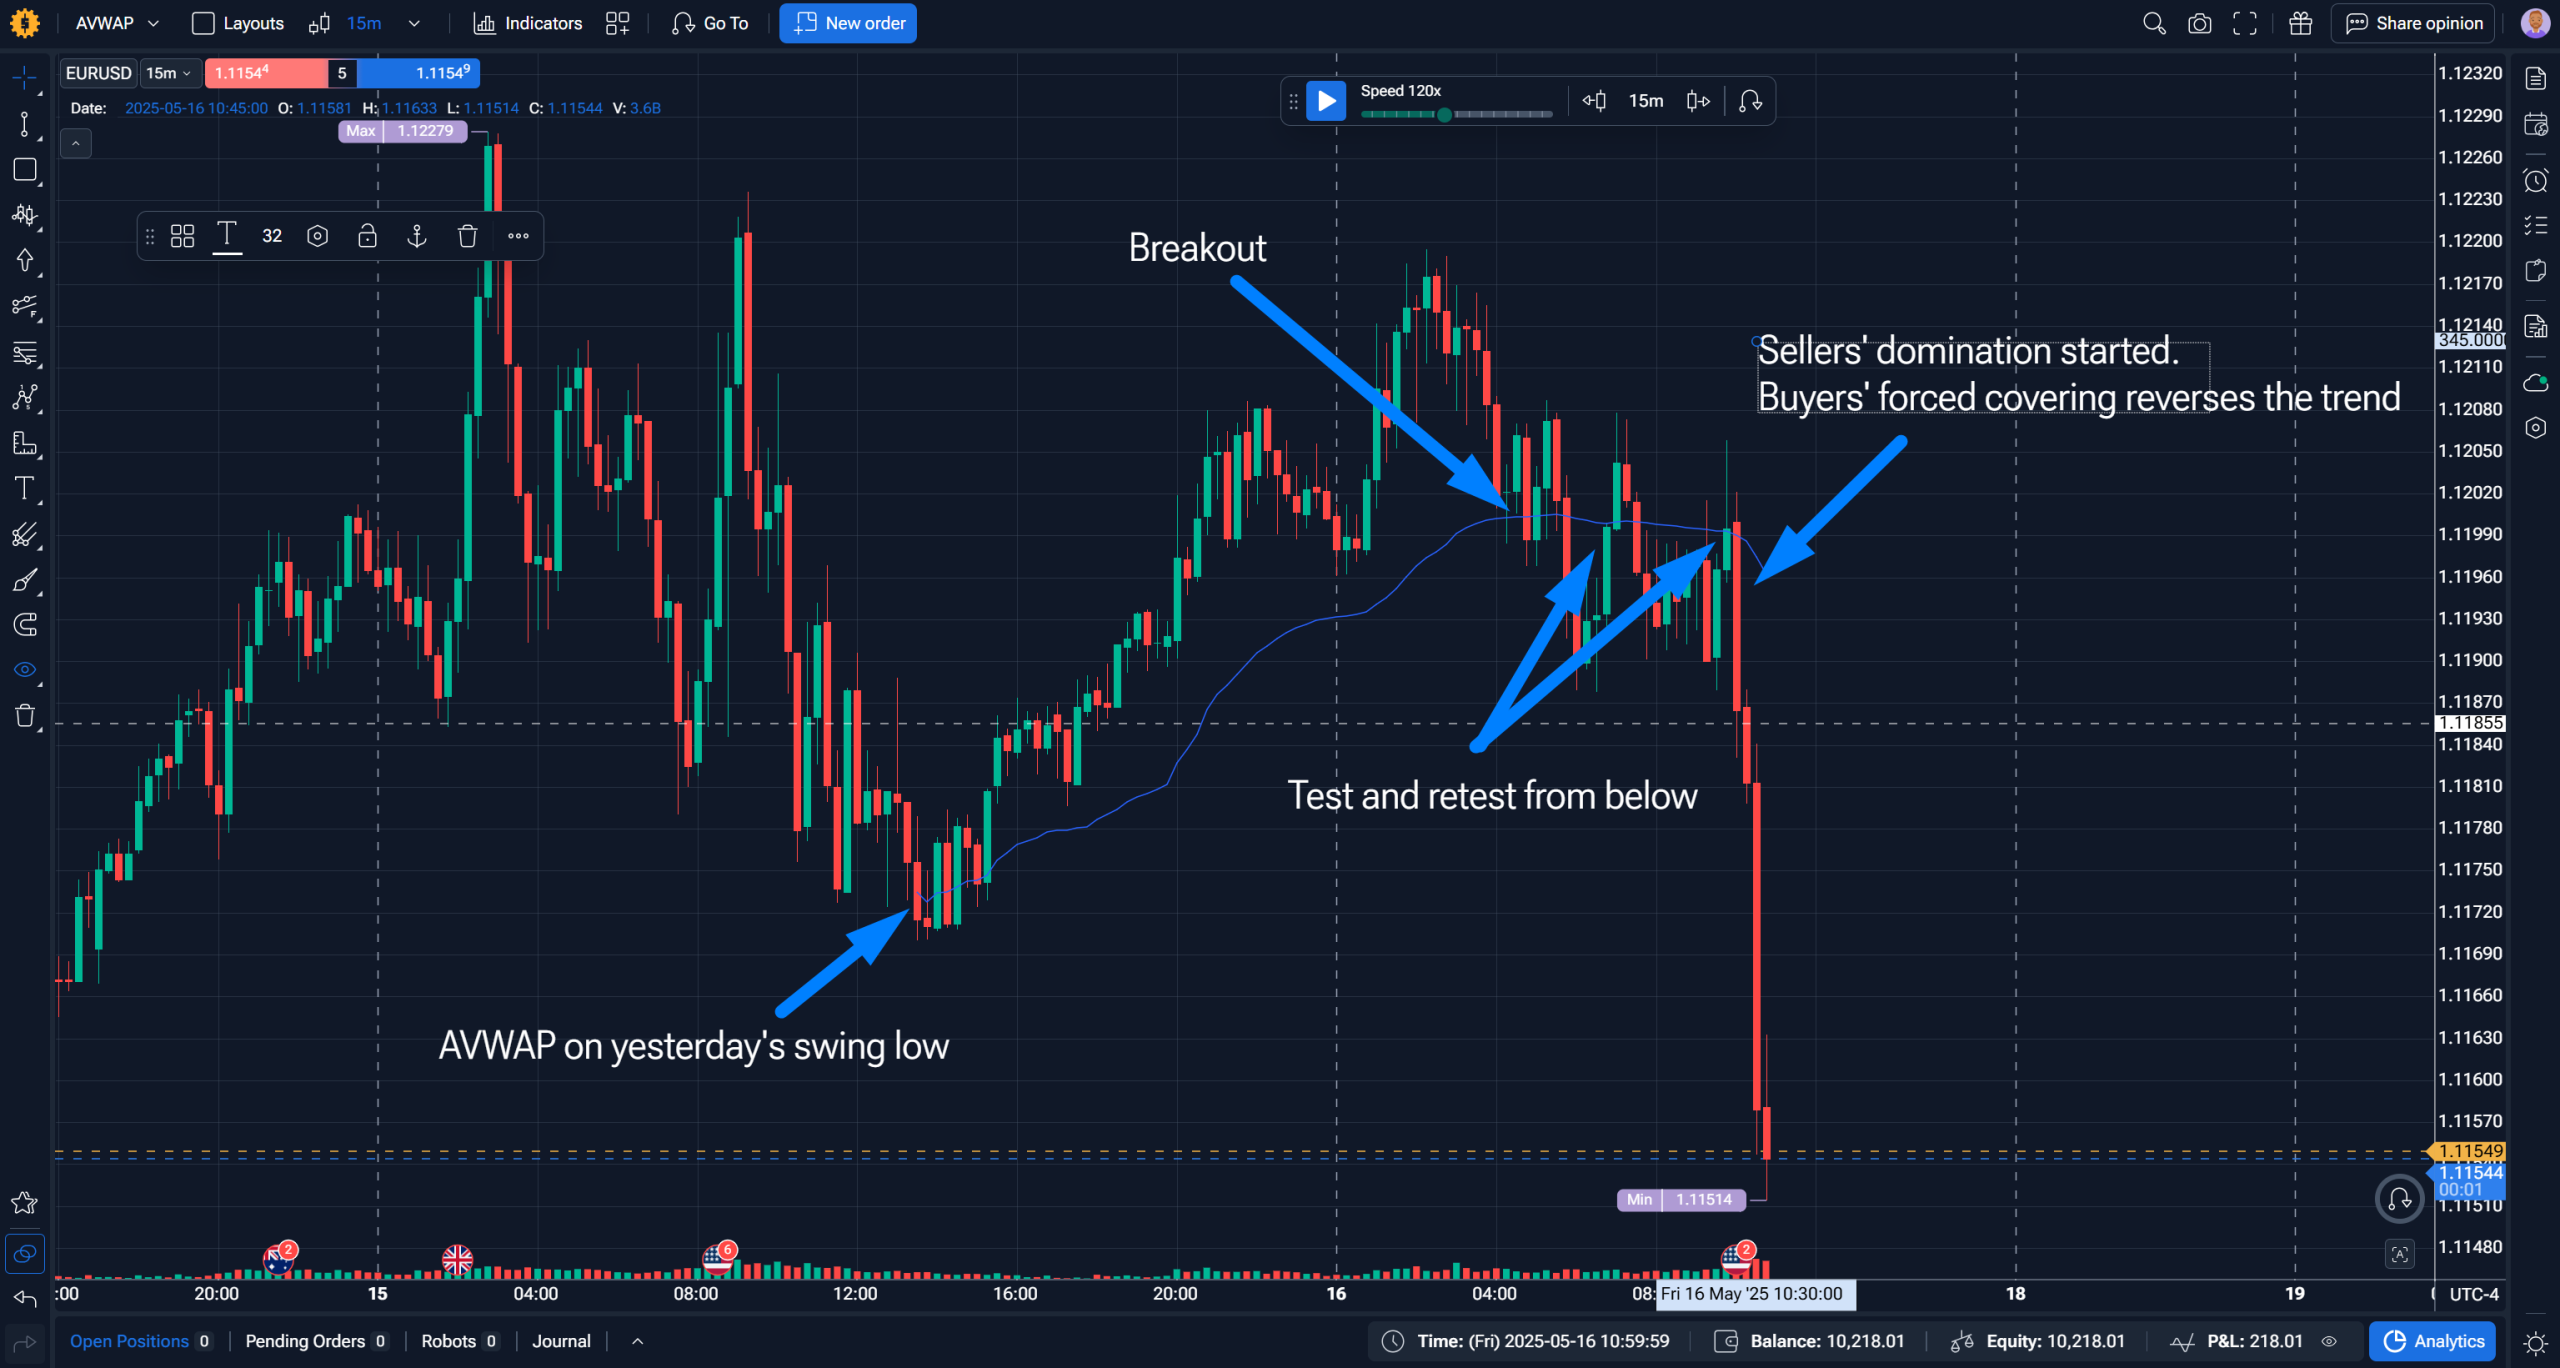
Anchoring from a major swing high creates a resistance AVWAP — it represents the average cost of sellers who entered at that high. As long as price stays below this line, those sellers are net profitable and have little incentive to cover, which keeps pressure to the downside.
Anchoring from a swing low does the opposite: it creates a dynamic support line representing the average cost of buyers who entered at that low. Price retesting the AVWAP from above becomes a natural area for those buyers to add to their positions.
This is where AVWAP becomes actionable: each retest of the line is a volume-weighted opinion poll on who’s in control — buyers or sellers. And the dynamic reverses sharply the moment price breaks and closes above the swing-high AVWAP: sellers who were profitable are now underwater, and their forced covering adds buying pressure on top of new longs entering the breakout. That’s the mechanism behind the signal — not just “price crossed a line,” but a specific group of participants being squeezed out simultaneously.
Event-Based Anchoring (Earnings, FOMC, IPO)
Institutional desks routinely anchor from catalyst dates to understand the net cost basis of all participants since the event. This matters because large funds that entered on an earnings gap can’t immediately exit — they’re stuck managing their average price over weeks.
Anchoring from an earnings date creates a reference line for “where does everyone who bought this news stand today?” If price is consistently trading below the post-earnings AVWAP, the late buyers from the initial reaction are underwater and represent a persistent overhead supply — they’ll sell into any rally to cut losses. But the mirror effect is equally important: if price recovers back to the AVWAP, those same participants are now breaking even. Many will exit at breakeven just to stop the pain — which creates a second wave of selling pressure right at the AVWAP level. This is why post-earnings AVWAPs often act as precise resistance rather than approximate zones: the level represents the exact psychological threshold where the largest group of trapped buyers gets relief.
The same logic applies to FOMC decisions and major macro prints in forex: anchor from the announcement candle and you’ll see exactly where sentiment shifted and who’s been holding since.
Anchored VWAP vs. Traditional VWAP: Key Differences
| Feature | VWAP | Anchored VWAP |
|---|---|---|
| Calculation Start | Fixed: session open (midnight or 9:30 AM) | Flexible: any candle |
| Resets Daily? | Yes, every session | No — cumulative from anchor |
| Use Case | Intraday mean reversion, institutional execution | Multi-day trend analysis, event-driven setups |
| Best For | Day traders tracking intraday flow | Swing traders, event traders, institutional positioning |
| Timeframe Flexibility | Intraday only | Any timeframe |
| Main Weakness | Useless for swing analysis; gaps overnight | Requires judgment to pick meaningful anchors |
The comparison between AVWAP and VWAP often trips up traders who assume the two are interchangeable. They’re not. They answer fundamentally different questions.Traditional VWAP is essentially a day-trading tool. It tells you whether you’re buying cheap or expensive relative to today’s flow, which is why institutional order desks use it to benchmark execution quality. It resets at midnight (or market open), so by definition it contains no information about yesterday’s sellers or the fund that bought a week ago.
AVWAP carries that memory. For swing trading indicators and multi-day position analysis, AVWAP is structurally superior because it can track participant positioning across days, weeks, or months without losing continuity.
Anchored VWAP Trading Strategies
Most articles about AVWAP give you a list of named strategies: retest, breakout, confluence — and leave you to figure out the underlying logic yourself. That’s the wrong order. Before looking at specific setups, it’s worth understanding the three core mechanics that all AVWAP strategies are built on.
Reading Market Bias with Two AVWAPs Simultaneously
This is the foundation of Brian Shannon’s methodology and the most underutilized application of the indicator. The idea is simple: anchor one AVWAP from the most recent significant swing high, and a second from the most recent significant swing low. Then look at where price is relative to both lines.
The interpretation is straightforward once you see it:
- Price above the AVWAP from the swing low → buyers who entered at that low are profitable. They have no pressure to sell, and dips toward that line tend to attract more buying.
- Price below the AVWAP from the swing high → sellers who entered at that high are profitable. They have no pressure to cover, and rallies toward that line tend to attract more selling.
- Price between both AVWAPs → neither group has a clear advantage. This is what Shannon calls “no man’s land” — a zone where the edge dissolves and chasing trades tends to produce noise. The reason is mechanical: when both groups are simultaneously profitable, neither is under pressure to act. Buyers from the swing low are in the money and have no reason to sell. Sellers from the swing high are in the money and have no reason to cover. Without forced order flow from either side, there’s no directional engine — just two groups of comfortable holders watching each other.
In practice: if the price has AVWAP from a 1,1413 swing high at 1,1392 and AVWAP from a swing low at 1,1311, and price is trading at 1,1388 — that’s no man’s land. Waiting for a break and close above 1,1392 (sellers from the high become underwater, short covering accelerates the move) gives a much cleaner context for a long than anything inside the range.
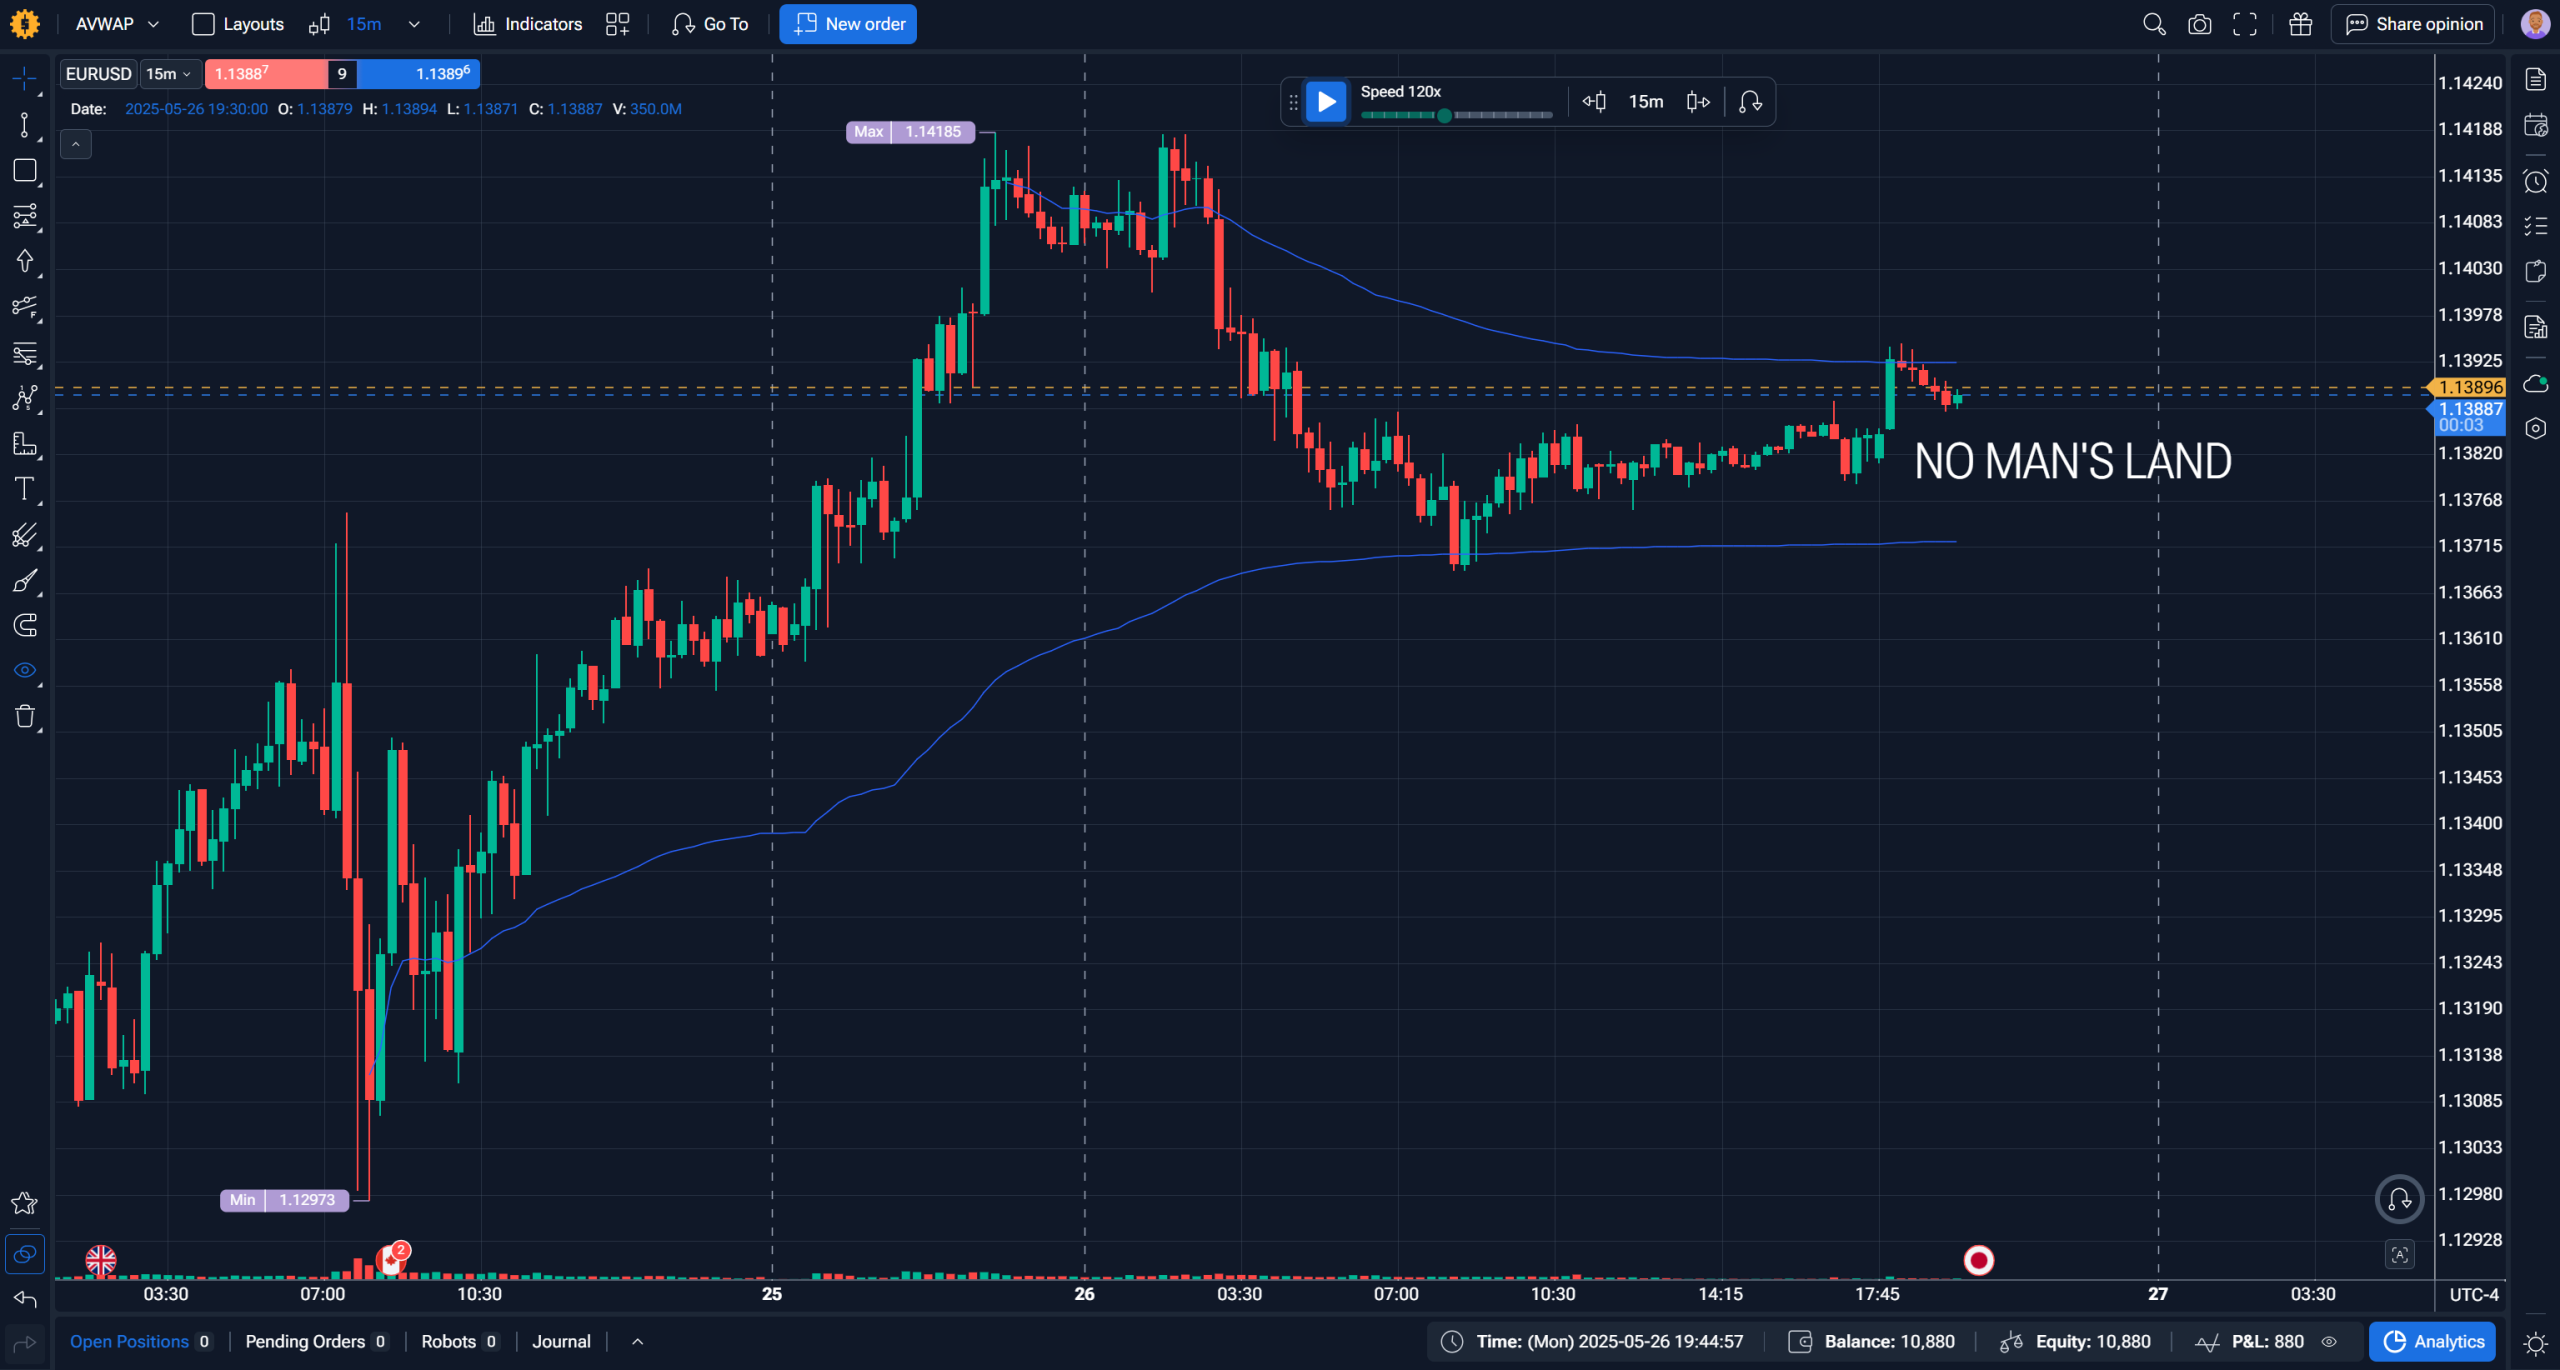
The power of this approach is that it replaces a subjective “is the trend up or down?” question with an objective one: who is currently profitable, and who is under water?
AVWAP as a Magnet, Not Just Support
Most traders learn AVWAP as a support/resistance tool and stop there. But there’s a second, equally important application: AVWAP as a mean-reversion target when price has moved too far from it.
The logic: if a stock gaps up 4% at the open on average volume, and the AVWAP from yesterday’s close sits 3% below the current price — that gap hasn’t been “tested” by volume yet. The AVWAP represents fair value relative to the volume distribution: it’s where the greatest concentration of real transactions occurred, and therefore where the largest open positions are anchored. Participants who built positions at that level have an incentive to defend it. Those who are short from above it are targeting it as a take-profit. If the opening push higher is on thin volume — meaning few new participants are actually transacting at the extended price — the market hasn’t genuinely accepted the new level, and the gravitational pull back toward the volume-heavy AVWAP remains intact.
This flips the standard mental model. You’re not looking for price to bounce from the AVWAP — you’re looking for price to return to it as a target. Practically: anchor from the prior day’s close (or the prior swing high for a gap-up into resistance), note where AVWAP sits, and if the opening push has weak volume, the AVWAP level becomes your first profit target on a counter-trend trade rather than a level you’re defending.
The invalidation is clean: strong volume on the gap continuation means buyers are genuinely stepping in at the extended price, and the AVWAP magnet effect is cancelled.
AVWAP Confluence with Fixed Levels
AVWAP becomes significantly more reliable when it aligns with levels other traders are already watching. The reason is simple: a level that only AVWAP traders see produces a weaker reaction than a level where AVWAP traders, horizontal level traders, and volume profile traders all converge simultaneously.
Concrete example from NQ futures, intraday: daily VWAP sitting at 19,400. AVWAP from the morning session high at 19,410. Horizontal resistance from the prior day’s high at 19,405. That’s a 10-point cluster of three independently-calculated levels. Each group of traders sees their own reason to sell at that zone — the result is a much sharper rejection than any single level would produce.
The practical approach: once you’ve placed your AVWAPs, note where they align with prior session highs/lows, round numbers, or volume POC from a Volume Profile. Confluences within a 5–10 pip zone (in forex) or 5–10 point zone (in indices) are meaningful. Isolated AVWAP levels that don’t overlap with anything else require more volume confirmation before acting.
Stop placement in confluence trades is also cleaner: you put the stop above the entire cluster, not just above the AVWAP line. A break through the whole cluster — not just one level — is the signal that the setup is invalidated.
Anchored VWAP for Swing Trading vs. Day Trading
AVWAP applies to both timeframes, but the methodology differs significantly in anchor selection and holding period.
| Dimension | Swing Trading | Day Trading |
|---|---|---|
| Typical Anchor | Weekly/monthly swing high or low; earnings date | Prior session high/low; intraday event candle |
| Holding Period | Days to weeks | Minutes to hours |
| Chart Timeframe | Daily, 4H | 15-min, 5-min |
| Key Use | Multi-day support/resistance; trend confirmation | Intraday mean reversion; VWAP reclaim setups |
| Limitation | Anchor selection requires market context knowledge | More noise; requires tighter invalidation levels |
For swing traders, AVWAP anchored from a weekly swing low becomes a dynamic level that evolves with the market — unlike a static horizontal support line that doesn’t account for changing volume distribution. The indicator effectively tracks whether participants from that key turning point are still in the money.
For day traders, anchoring from the prior session’s high or low is particularly effective. If price opens above yesterday’s high AVWAP, the overnight buyers are profitable and that level becomes logical support. This approach pairs well with day trading simulator practice, where you can test intraday AVWAP reactions across hundreds of sessions without touching a live account.
Step-by-Step: Practice Anchored VWAP Backtesting via Forex Tester Online
Understanding AVWAP conceptually is one thing. Knowing how it behaves across hundreds of real historical sessions — under different volatility regimes, trending and ranging markets, with your own entry logic — is another. Below is a concrete example built directly on the dual-AVWAP bias logic described above, followed by how to replicate in a dedicated backtesting software and extend it yourself.
Case Study: Dual Prior-Day AVWAP Breakout System on USDJPY
This strategy is a direct application of the two-AVWAP bias framework: instead of anchoring from a major swing high and low, you use the previous day’s high and low as anchors — resetting the bias reference daily. The rules are fully mechanical:
Setup rules:
- At the start of each session, place two AVWAPs: one anchored to the prior day’s high candle, one to the prior day’s low. For Monday, Sunday’s candles are treated as an extension of Friday — the anchor is placed on the combined Friday+Sunday high and low.
- If price closes a candle above the upper AVWAP (prior day’s high anchor) → go long.
- If price closes a candle below the lower AVWAP (prior day’s low anchor) → go short.
- If a position is already open when the opposite signal fires → reverse.
- Close all positions at end of day. No fixed stop loss. No take profit.
Filters:
- If the session opens already above the upper AVWAP or below the lower AVWAP → no trade. Wait for the next valid signal.
- If the two AVWAPs cross each other intraday → hold the existing position unchanged. Exit only at end of day or on a valid reversal signal.
Results on USDJPY, 30 trades:
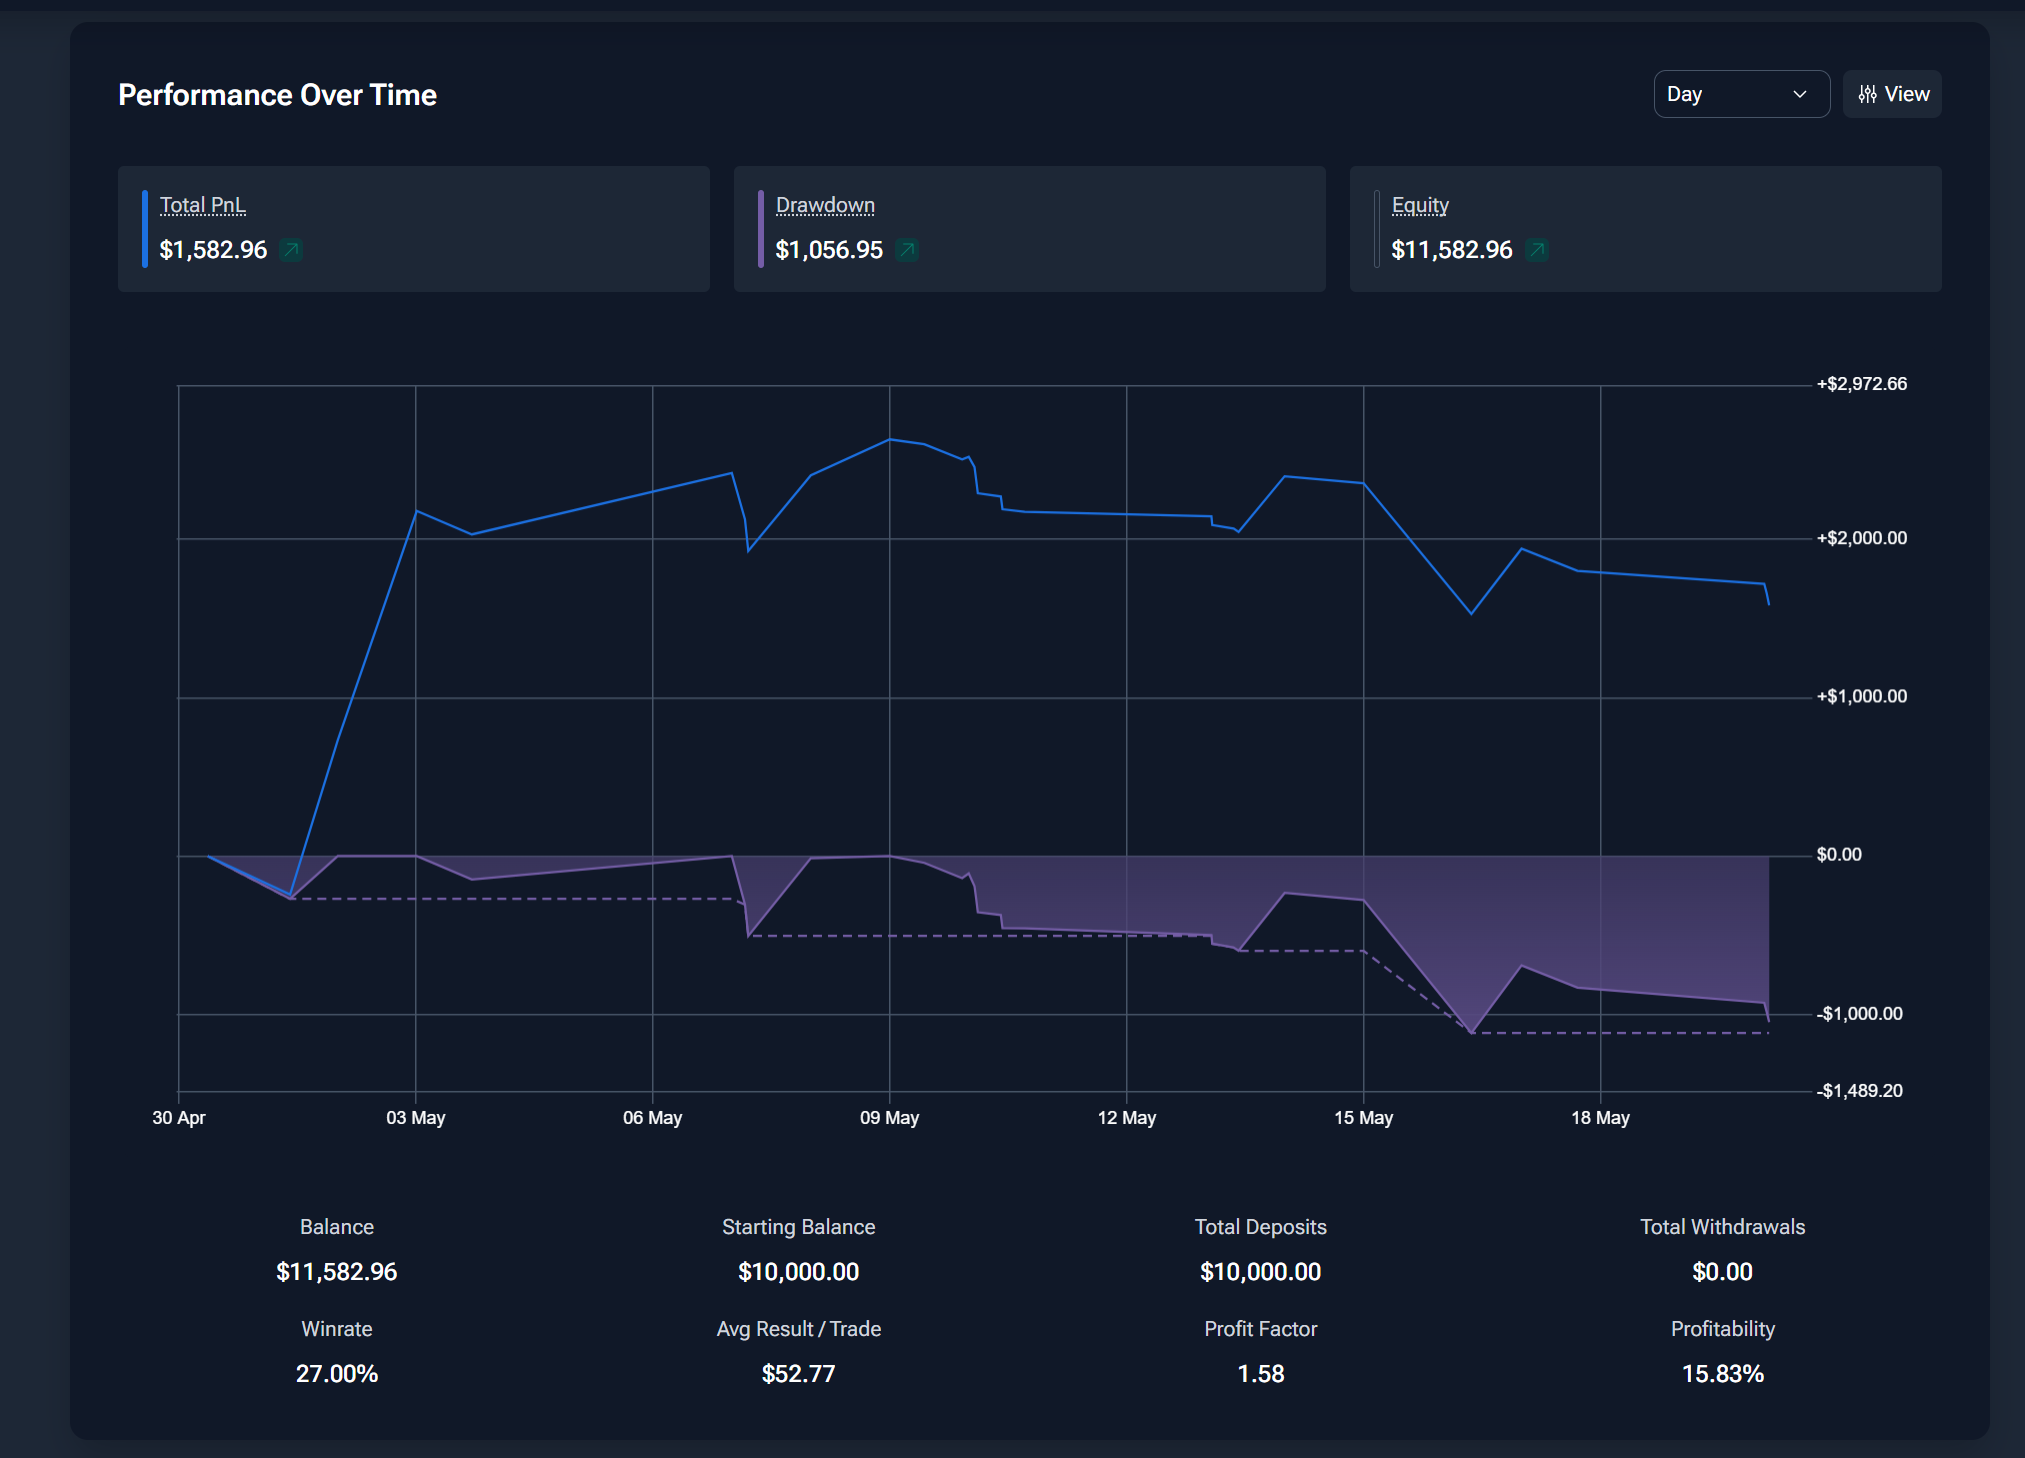
- Win rate: 53%
- Profit factor: 2.02
- Net profit: $3,322 on a $10,000 account
- Exits: end-of-day only — no fixed SL or TP
The equity curve is characteristically volatile: the strategy earns its returns by catching a handful of large trending moves. Flat and choppy sessions generate frequent reversals that erode smaller gains. The overall profile is positive, but the curve shape tells you this isn’t a smooth compounder — it’s a trend-following system with inherent variance.
What the Exit Optimizer suggests:
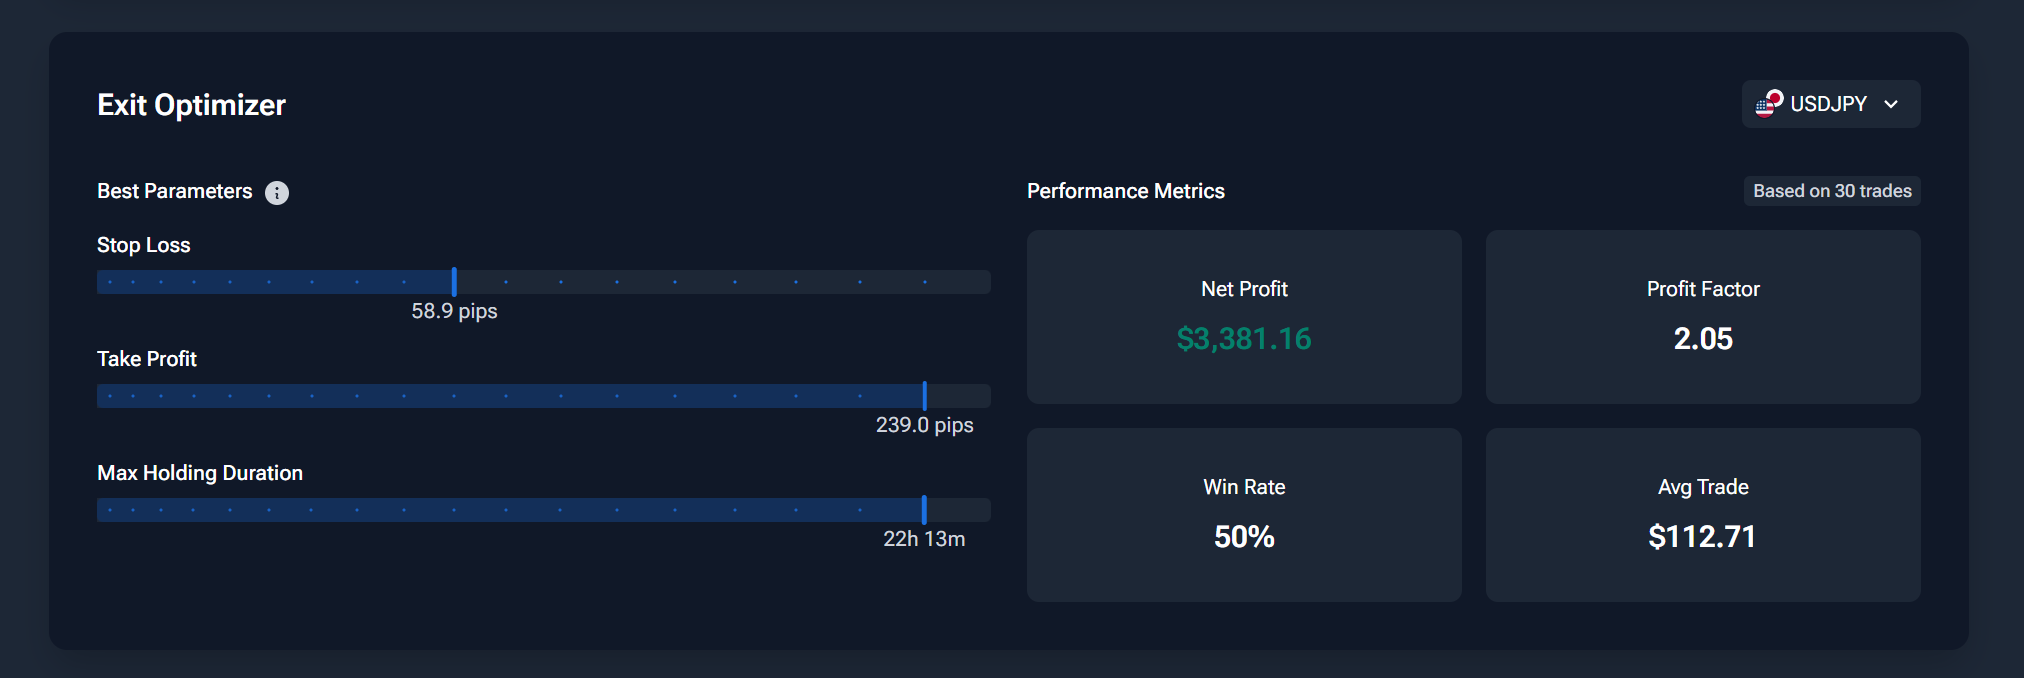
Keeping the end-of-day exit intact (Max Holding Duration aligns with the daily close rule) makes sense. The more interesting finding is the stop loss parameter at 58.9 pips — the strategy currently runs without stops, which is why the equity curve has deep drawdown periods. Testing a fixed stop in that range during forward testing is the logical next step. The take profit at 239.0 pips is less relevant given the end-of-day exit handles the upside naturally.
What this result means — and what it doesn’t: 30 trades is enough to see that the logic has some signal, but not enough to draw firm conclusions about live performance. The strategy needs more trades across different market regimes and forward testing before it’s ready to trade with real capital. What it does demonstrate clearly is that the dual prior-day AVWAP structure — anchoring bias from the previous session’s extremes — produces tradeable signals, not noise.
Idea
Already using Forex Tester Online? Open the project directly and use it as a starting point for forward testing.
AVWAP is flexible enough to support very different strategies — the anchor point and the rules around it can be adapted to almost any trading style.
Test Your Own AVWAP Setup — or Extend This One
The steps below work for any AVWAP-based strategy. Whether you want to forward-test the prior-day breakout system described above, try anchoring from a swing low, or experiment with event-based setups — the process is the same.
Forex Tester Online runs directly in your browser — no installation, no download needed.
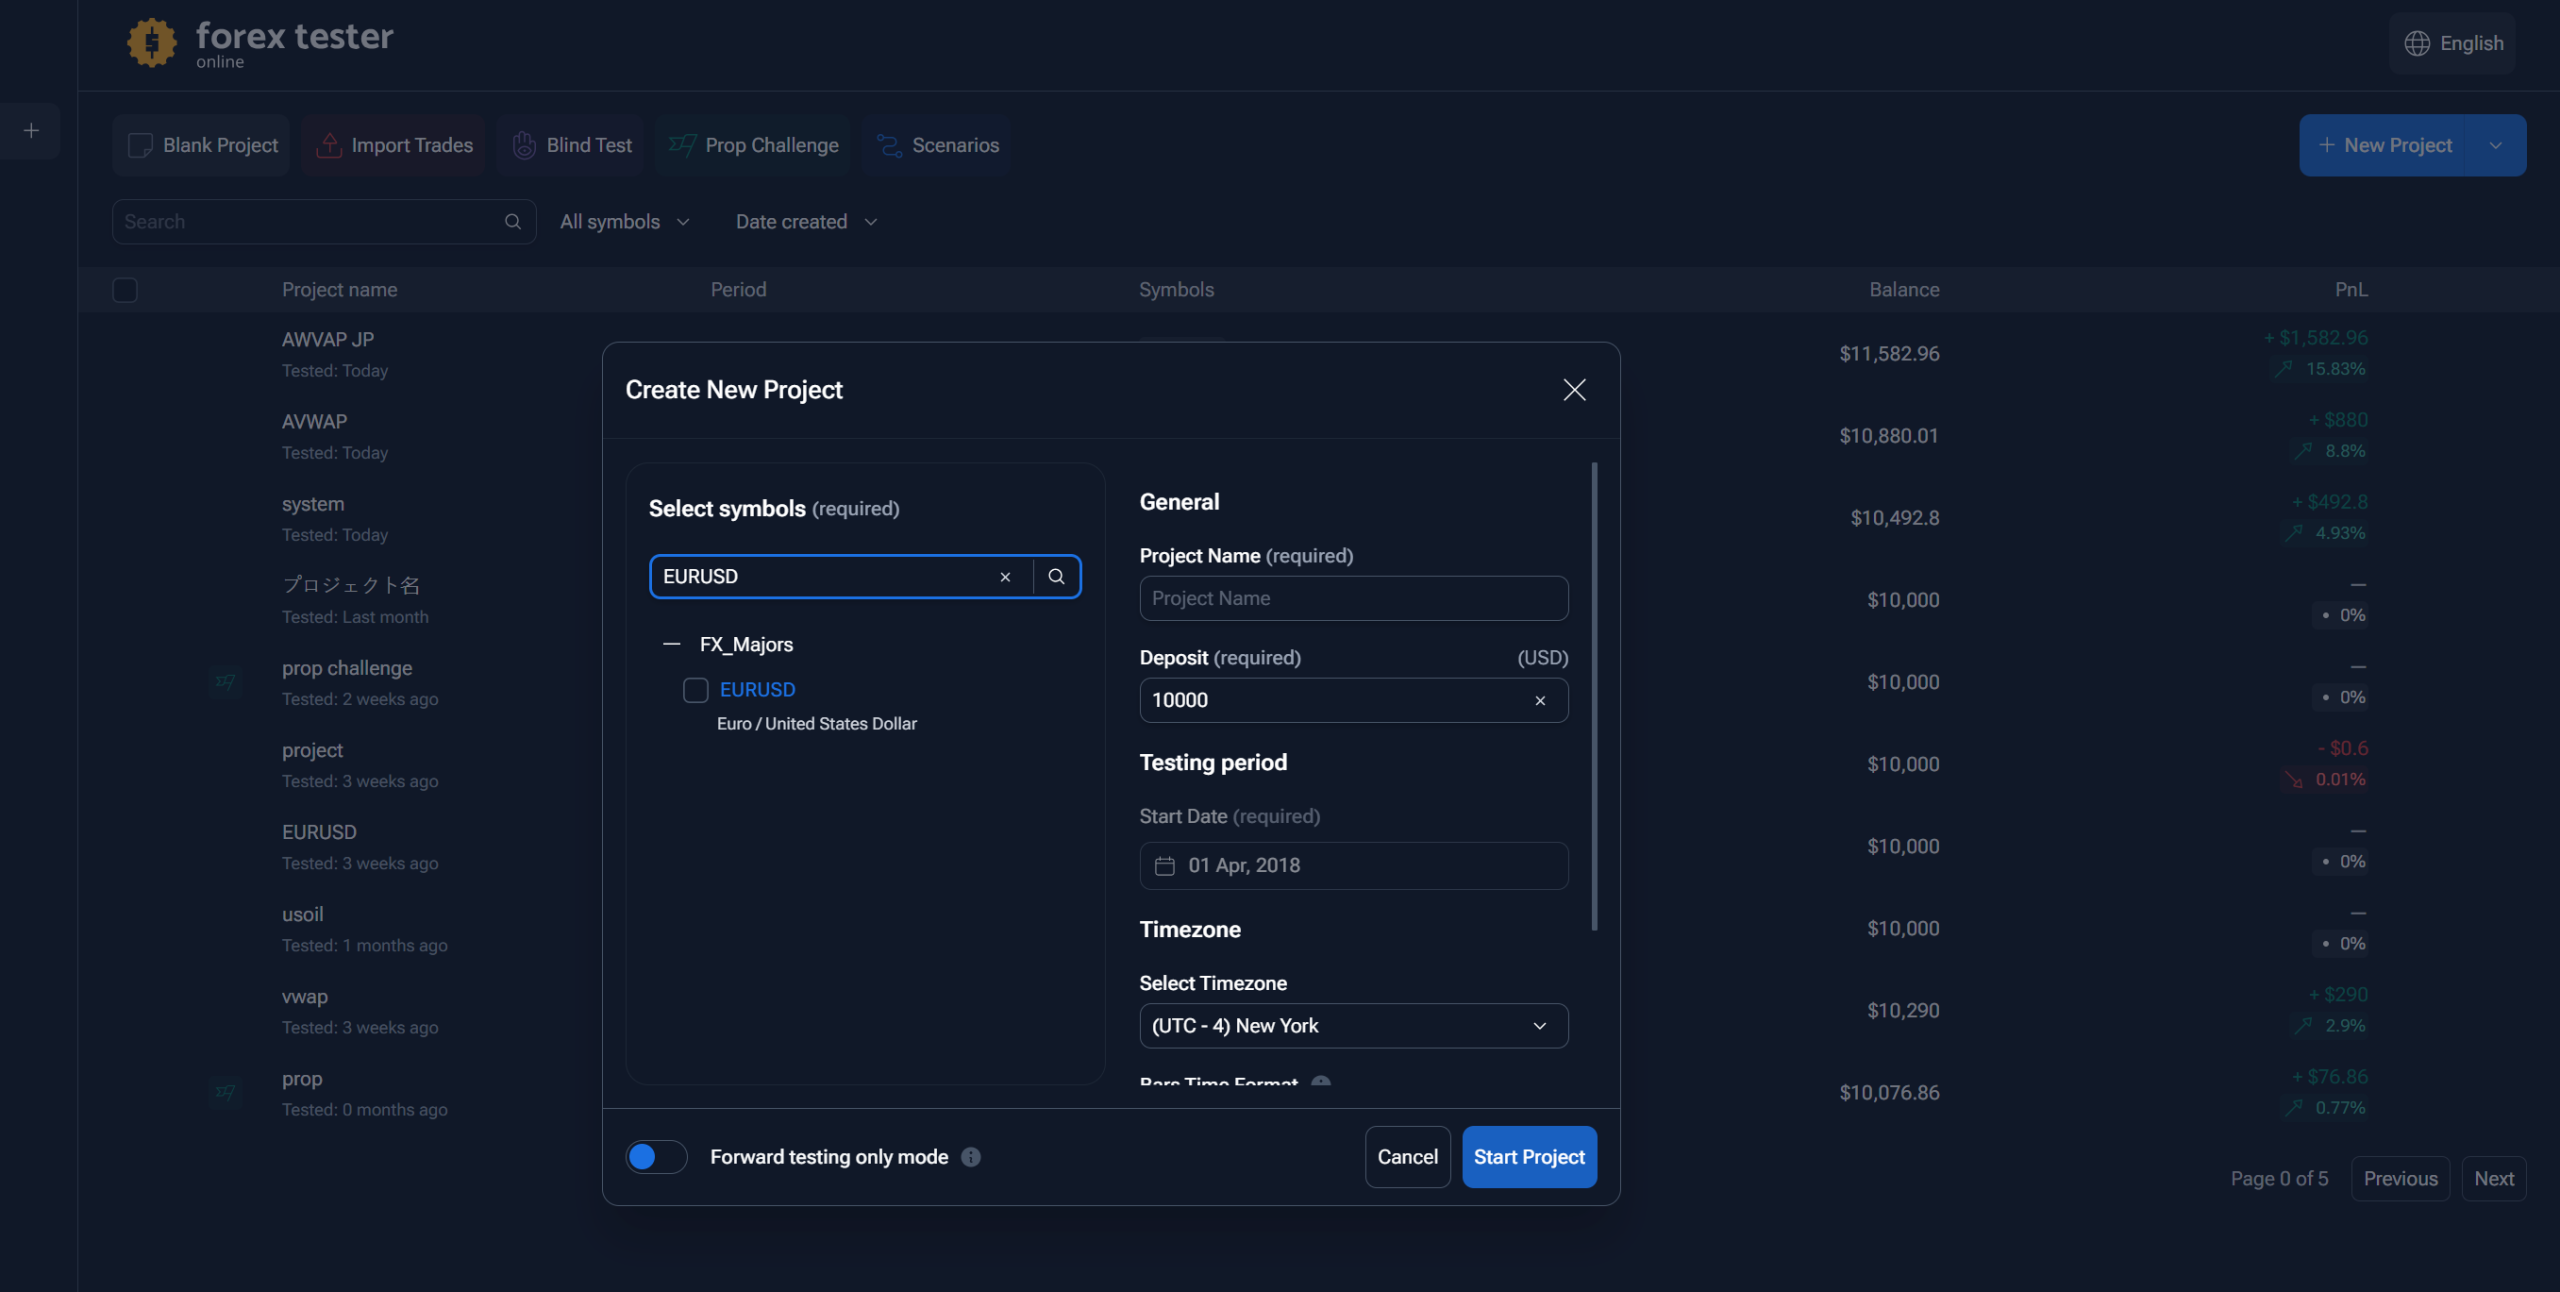
Step 1: Open Forex Tester Online and create a new project. Go to forextester.com and start a new project. Select your instrument (USDJPY, EURUSD, or whichever pair you trade) and set a date range covering at least 2–3 months of history.
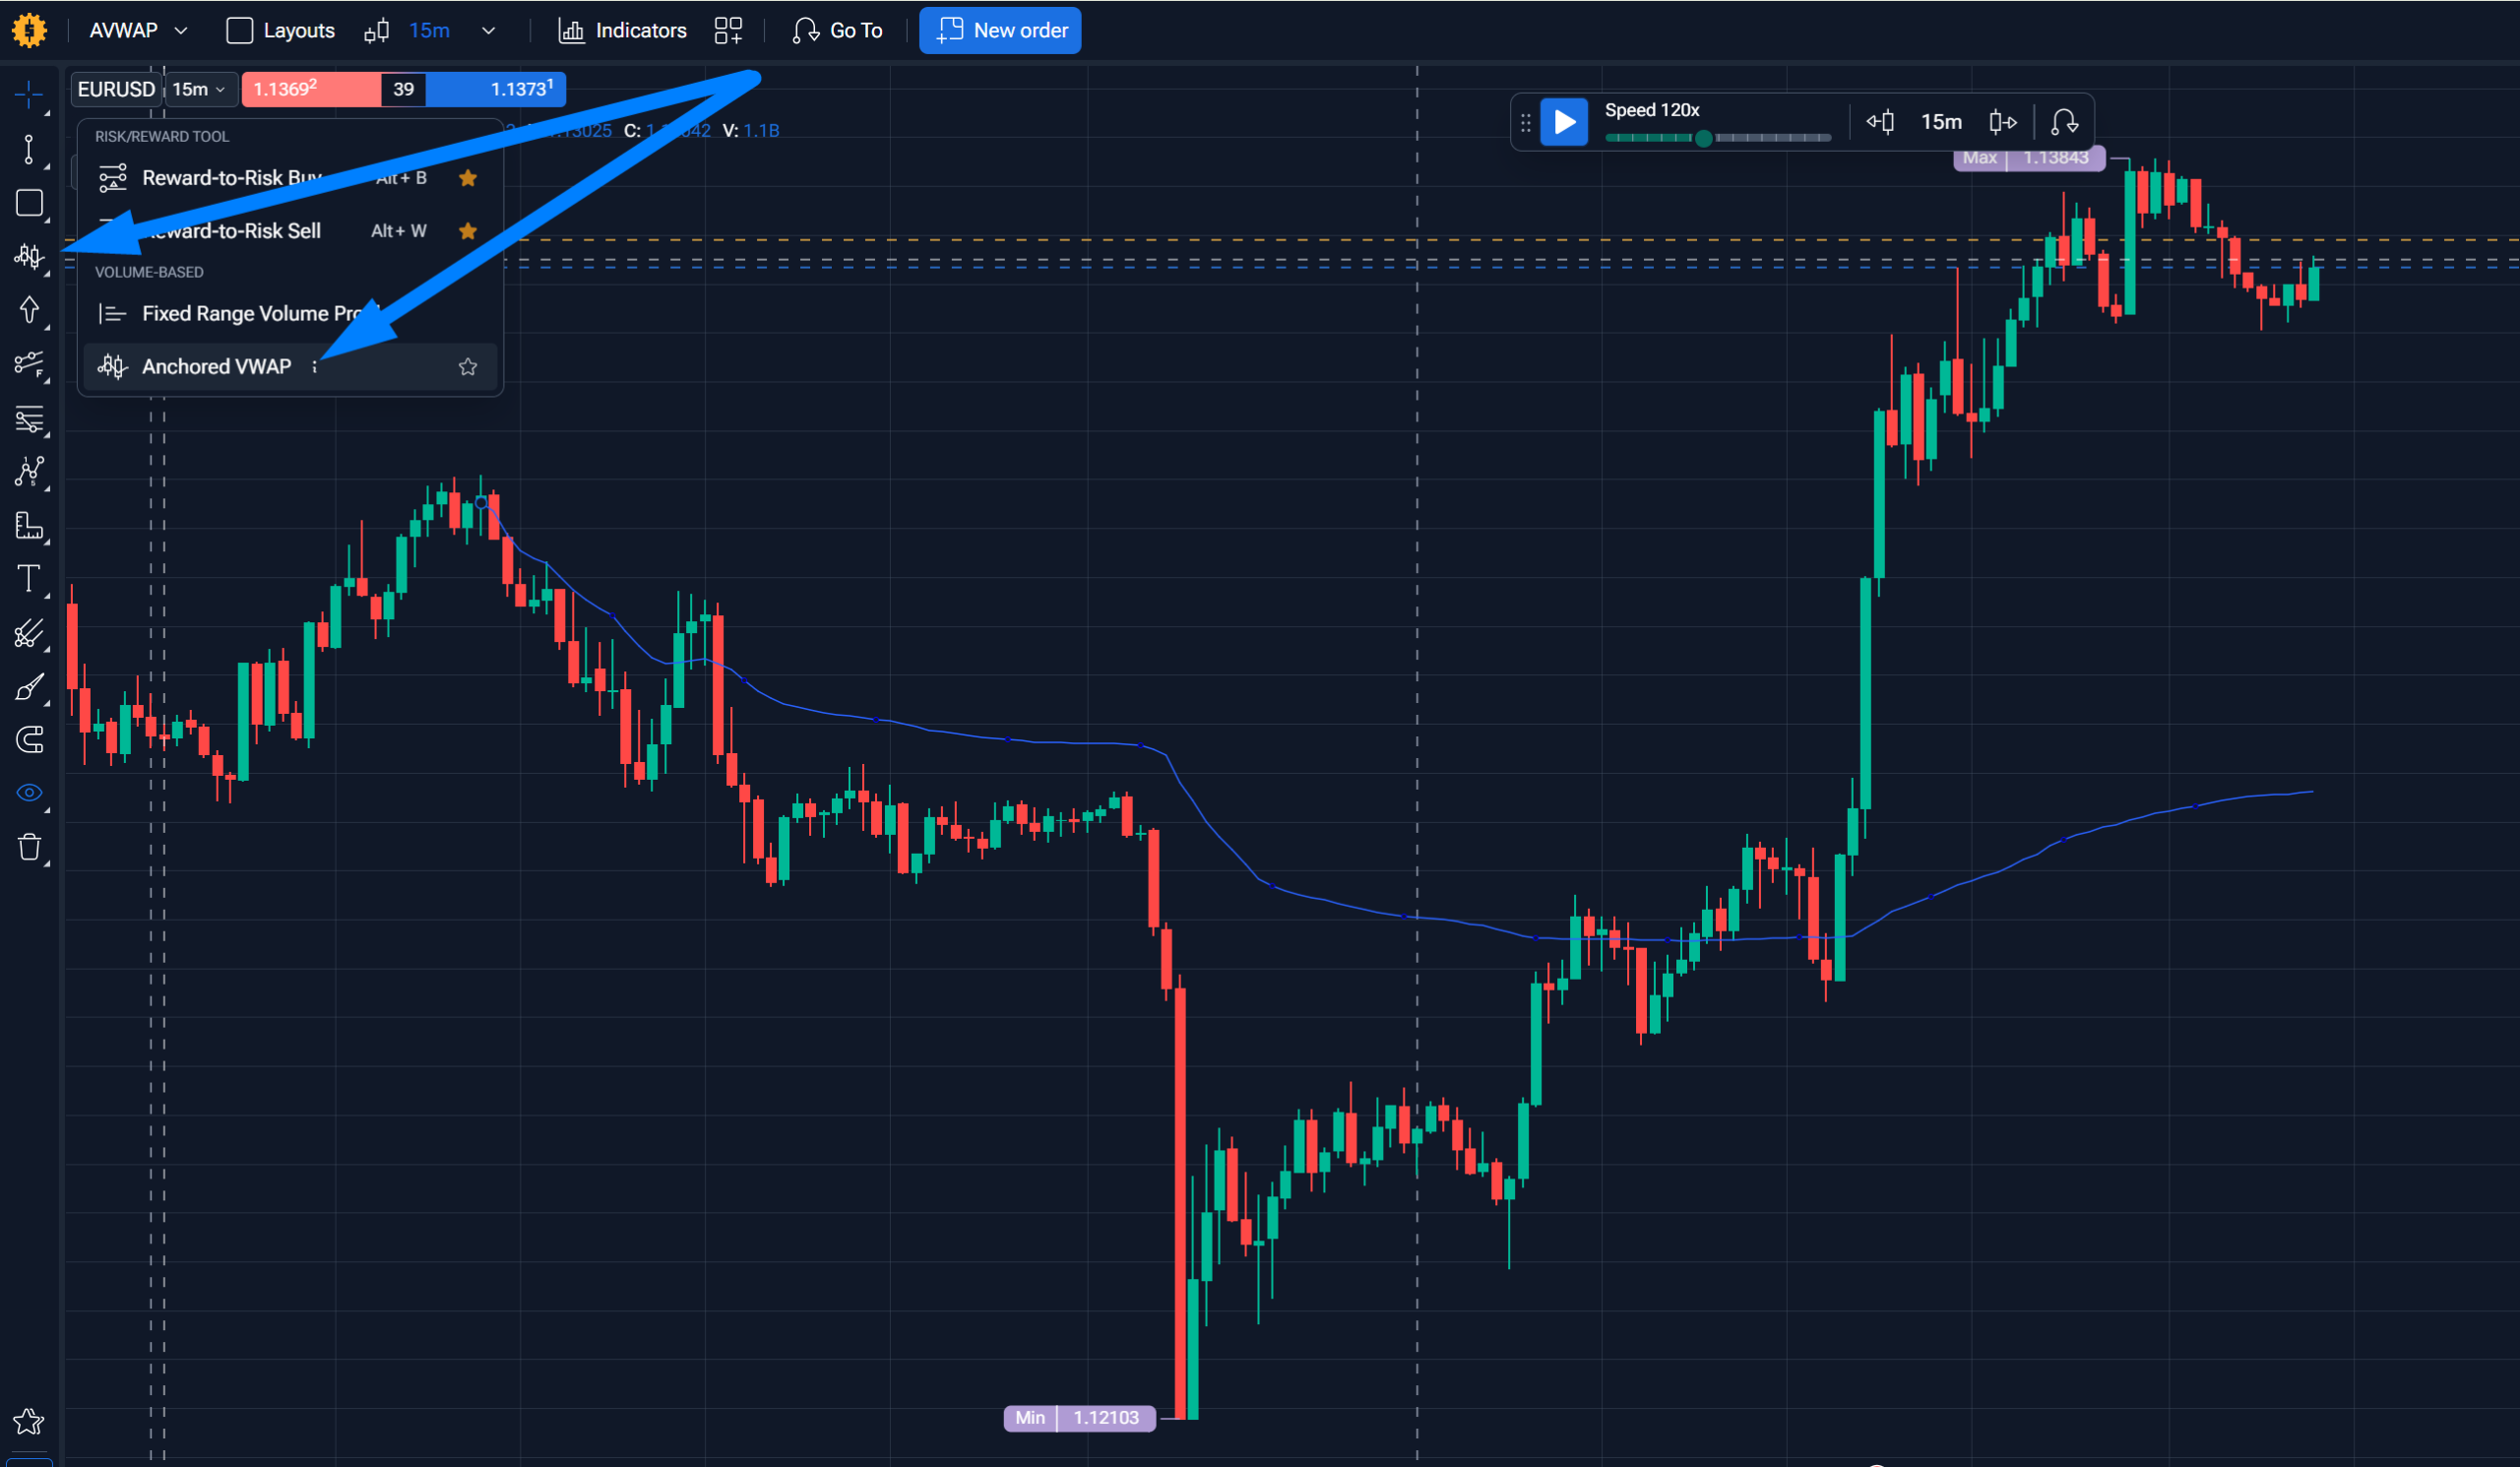
Step 2: Add the Anchored VWAP indicator and set your anchor. In the indicator panel, find AVWAP and add it to the chart. Set the anchor to the candle your strategy rule specifies, and configure the settings. Apply to price, bands multipliers — according to your setup logic.
Step 3: Advance the chart bar by bar and follow your entry rule. Use the playback controls to move through the session. When your signal condition is met, place the simulated order. Execute mechanically — don’t adjust anchors or rules mid-session.
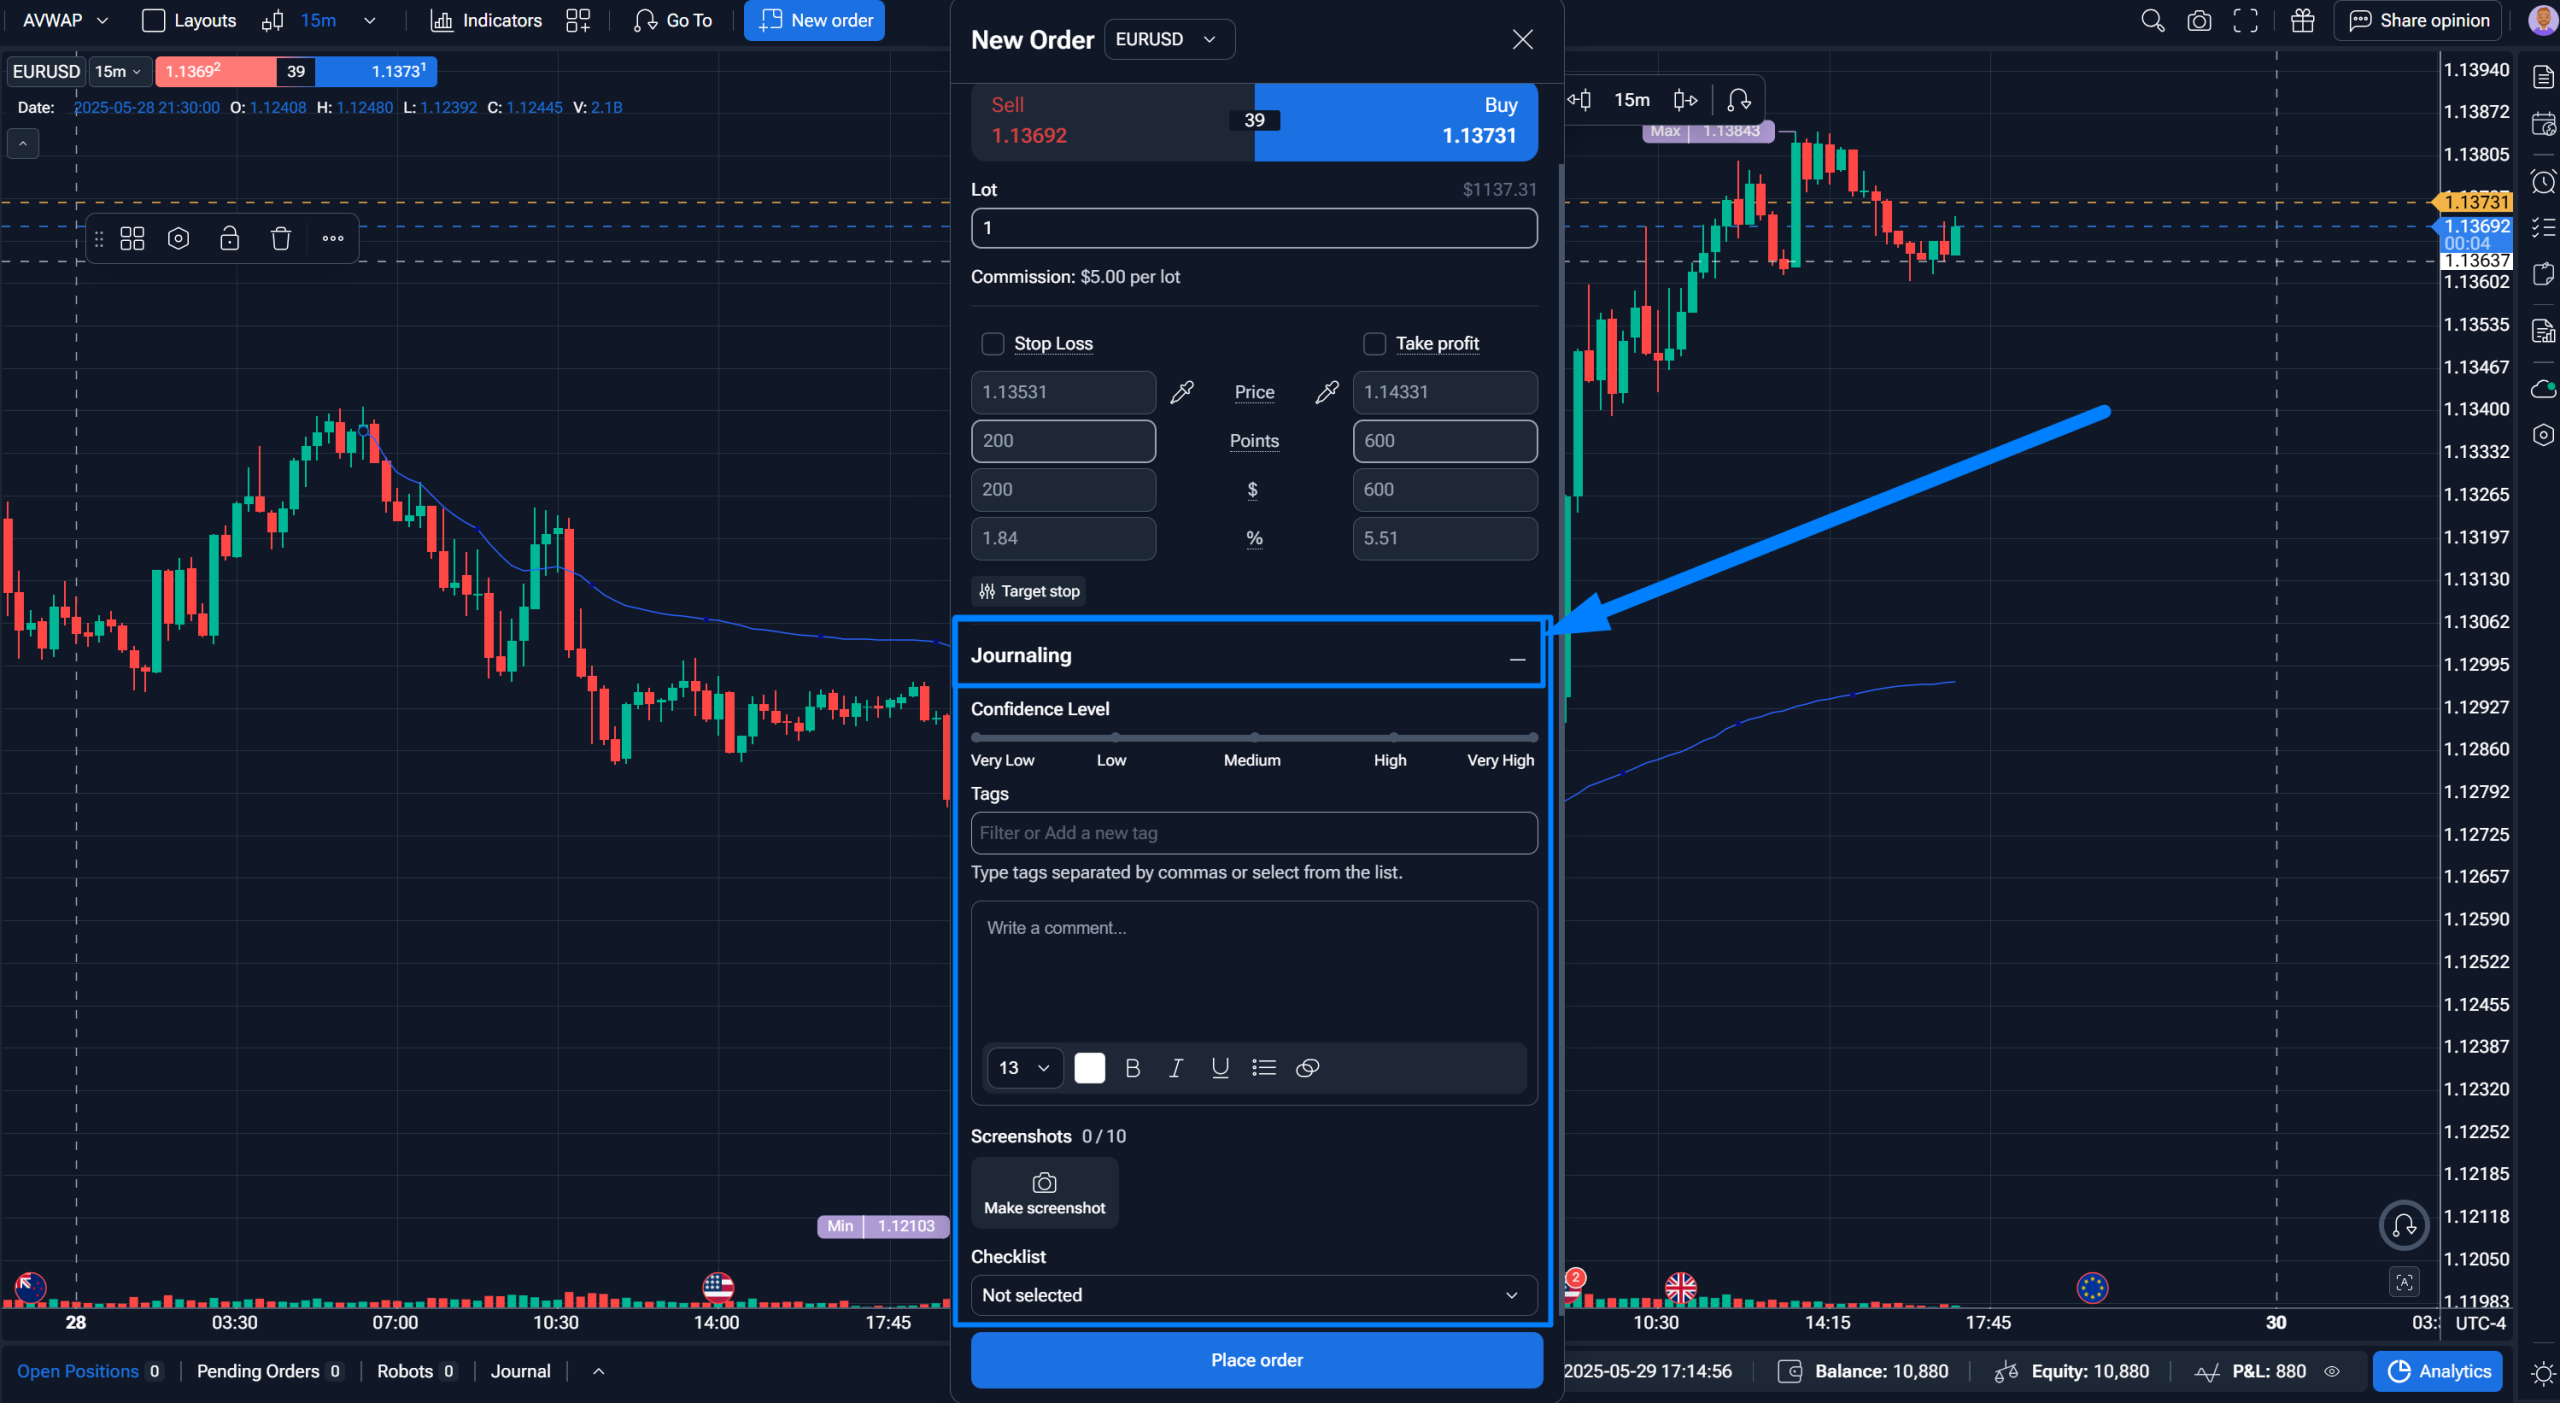
Step 4: Use the trade journal to stay organized. Forex Tester’s journal logs trades as they open. Add tags to distinguish different setups if you’re testing more than one anchor approach, and use notes or screenshots to mark anything worth reviewing later.
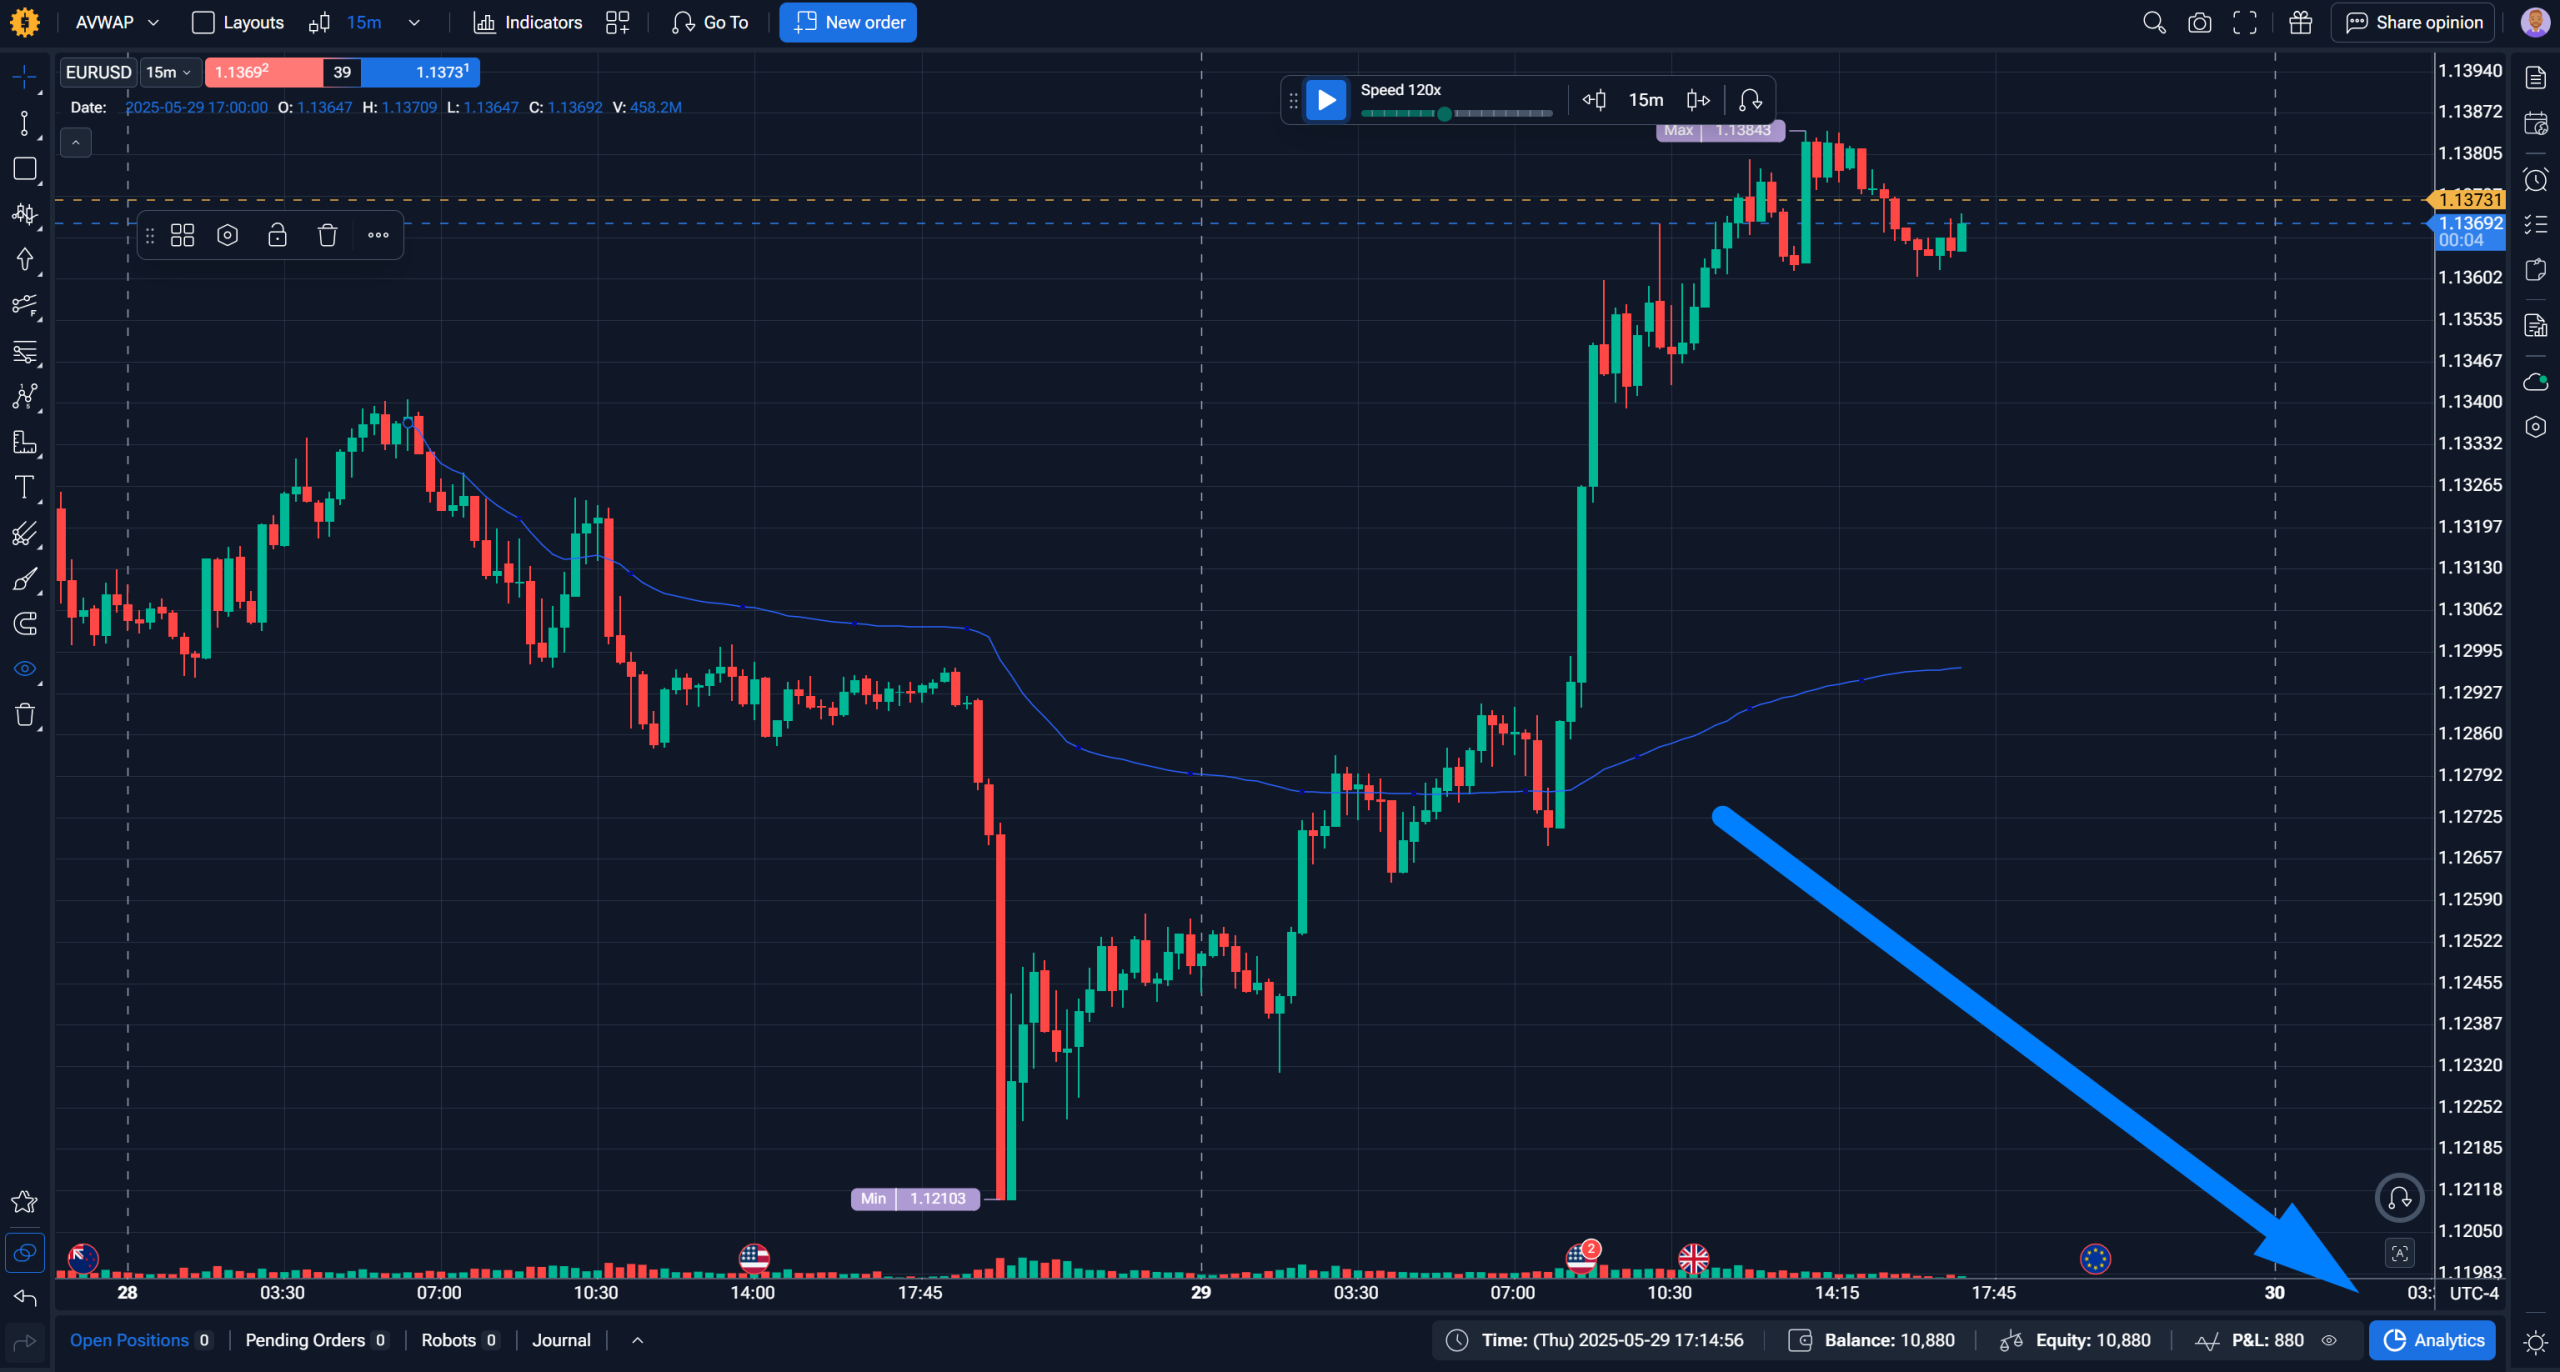
Step 5: After 30+ trades, review the Analytics tab. Open Analytics to see win rate, profit factor, and the equity curve. Look at which sessions produced the largest wins and the worst drawdowns — this tells you in which market conditions your setup actually has edge.
Step 6: Check the Exit Optimizer results. In the Analytics section, Exit Optimizer appears automatically and shows the statistically optimal stop loss, take profit, and max holding duration for your trade sample. Use the results to consider whether your exit logic needs adjusting.
Step 7: Forward test before going live. If the backtest holds up, run the strategy on data you haven’t seen yet. Forward testing across a different market period will tell you far more about whether the edge is real or curve-fitted.
Backtest Your AVWAP Strategies Free — No Download Required
Reading about AVWAP is useful. Actually placing anchors on historical charts, testing your signal rules, and seeing how the strategy behaved across different market conditions in a dedicated backtesting software – that’s where understanding becomes edge.
Forex Tester Online lets you do exactly that in your browser, right now. No installation required. No software to configure. You open it, select a pair and a date range, add your AVWAP anchors to historically meaningful candles — earnings dates, swing lows, breakout candles — and replay the market tick by tick to see how your rules would have performed.
Key features that make AVWAP backtesting practical in Forex Tester Online:
- AVWAP indicator built in — anchor to any candle with a click; add multiple anchors simultaneously
- 23+ years of tick data — test your setups across trending markets, choppy ranges, and major macro events
- Exit Optimizer — after accumulating trades, let the system find statistically optimal stop loss and take profit parameters based on your actual entry logic
- Trade journal with tagging — tag each trade by setup type (e.g., “AVWAP retest,” “AVWAP breakout”) and filter analytics by tag to isolate which anchor types actually produce edge
- Multi-chart layout — run the same AVWAP strategy across multiple pairs simultaneously to see where the setup works best
Don’t spend live capital figuring out which anchor points actually matter for your trading style. Test it first. The free trial gives you enough data to explore the indicator, place your first anchors, and get a feel for how AVWAP behaves in real market conditions — a good starting point before committing to a full plan.
Disclaimer
Trading involves risk. The indicators and strategies in this article are for educational purposes only and are not financial advice. Past performance does not guarantee future results. Always test strategies thoroughly before using real money.
Conclusion
Anchored VWAP gives traders something standard VWAP never could: a continuous, volume-weighted reference point tied to meaningful market events rather than arbitrary session resets. Whether you’re using two simultaneous AVWAPs to define market bias, identifying confluence zones where multiple participant groups overlap, or reading AVWAP as a mean-reversion magnet rather than static support — the indicator rewards traders who understand the mechanics behind it, not just the rules on top of it.
The dual prior-day high/low AVWAP approach demonstrated in the FTO section is one concrete example of how a simple, rules-based system built around this indicator can produce a positive profit factor across 30 trades. But 30 trades isn’t enough to draw firm conclusions, and a single example isn’t a strategy — it’s a hypothesis worth testing.
The next step is putting anchors on real historical charts and seeing how the signals actually behave in the markets you trade. That’s what backtesting is for — and it costs nothing to start.

Forex Tester Online
Start backtesting AVWAP indicator for free