English
 Deutsch
 Italiano
 Français
 Português
 ไทย
ไทย
 Tiếng Việt
 Polski
 Türkçe
 Nederlands
 Română
 한국어
한국어
 Svenska
 Español
Cumulative Volume Delta, or CVD, sits below your price chart as its own oscillator. It keeps a running score of buyers versus sellers: every trade is someone buying aggressively (hitting the ask) or selling aggressively (hitting the bid), and CVD adds up the difference, trade after trade. Climbing means buyers are winning the fight. Falling means sellers are. It’s now built into Forex Tester Online.
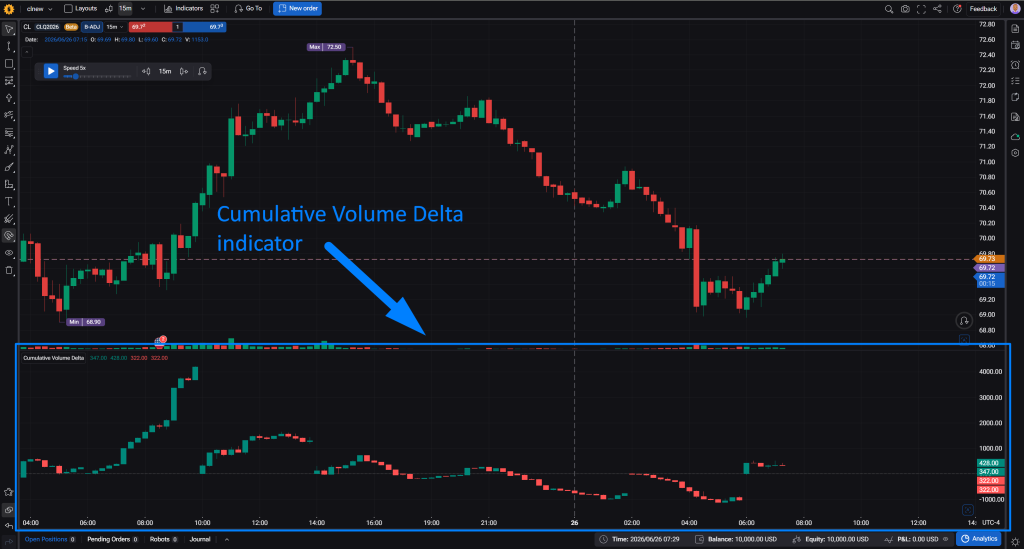
That direction is a decent starting point. The real value shows up when CVD stops agreeing with price, worth knowing before you glance at it and move on.
A single bar’s delta swings around too much to mean much, which is why it’s easy to write off as noise. The running total is what matters, and on CME futures FTO builds it from real, exchange-reported order flow rather than an estimate, a distinction worth understanding before diving in further down.
What CVD Actually Shows You
A single bar’s own delta always starts over at zero on the next bar. CVD doesn’t: it keeps adding to the same running total, bar after bar. That total only drops back to zero at the start of a new anchor period, a fixed block of time (a few hours, or a full trading day, depending on your chart’s timeframe) set in the indicator’s settings. Without that periodic reset, the number would just keep growing for as long as your data goes back, burying any intraday structure under months of accumulated noise. FTO plots the whole thing as its own set of candles, not a line.
Those CVD candles work exactly like price candles, just built from a different number:
- Open is the accumulated delta at the start of the bar.
- Close is the accumulated delta at the end of the bar.
- High and low are the highest and lowest the running total reached while that bar was forming, not over the whole period, just inside that one bar.
So a CVD candle with a long upper wick and a close near its open is telling you something specific: buyers pushed the cumulative total up hard during the bar, then gave most of it back before the bar closed. That’s a different read than a CVD candle that closes at its high with almost no wick, which is one-directional pressure all the way through.
How To Read It
Direction. A rising sequence of CVD candles means buyers have been winning the order flow fight since the last reset. A falling sequence means sellers have. That part is intuitive.
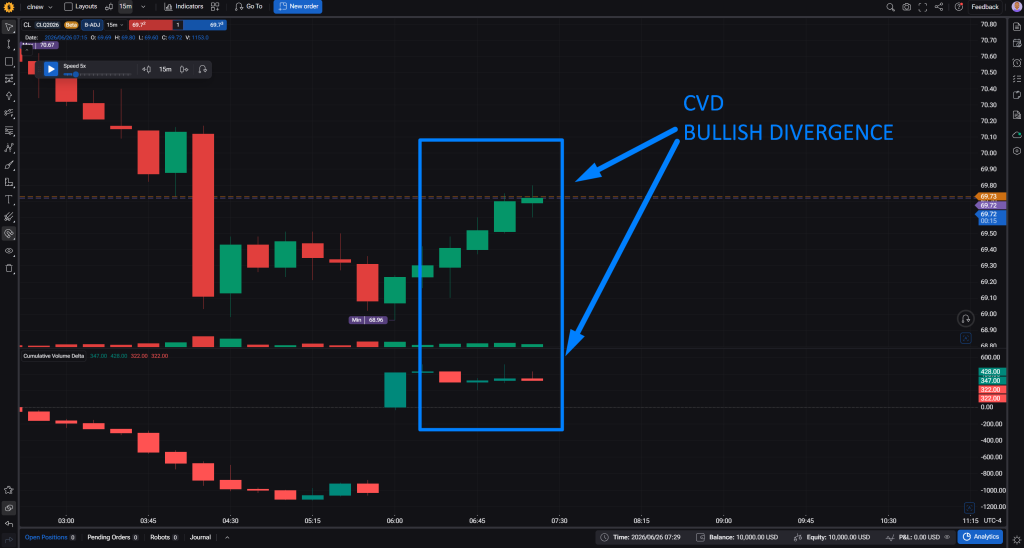
Divergence, the main reason to run this indicator. Price makes a new high, CVD doesn’t. That’s not “more buying,” that’s the rally continuing because sellers stepped out of the way, not because buyers stepped up. Read it the same way in reverse at a low: price makes a new low but CVD holds above its prior low, and the move down is running out of the aggressive selling that would confirm it. Divergence between price and cumulative delta is the entire reason this indicator is worth a subwindow of chart space.
Wicks. The high and low of a CVD candle show how far the running total swung inside that bar before settling. A big wick with a small real body means one side pushed hard and got absorbed. A candle with almost no wick and a wide body means the push was clean and didn’t meet resistance along the way.
The reset. A CVD candle right after an anchor boundary is only comparing against a few bars of history, so direction or divergence read on it don’t carry much weight yet. Give it time to build before leaning on it. The specific timing of each reset, and how to check it, is covered further down.
One thing worth internalizing early: the absolute number on the CVD scale isn’t comparable to anything outside its own chart. It depends entirely on where the volume data came from, and that source changes with timeframe. What carries meaning is the shape of the curve and whether it agrees with price, not the raw figure.
How The Delta Is Calculated
Most CVD indicators, TradingView’s included, estimate the buy/sell split from intrabar price and volume behavior rather than reading it directly off the tape, because most data feeds don’t report which side of a trade was the actual aggressor. FTO’s CVD uses that same estimation as its baseline, and adds a tier most platforms don’t have: on CME futures at M15 and below, it skips the estimate and uses the real thing, buy and sell volume as reported directly by the exchange.
| Chart timeframe | Instrument | Source | What it means |
|---|---|---|---|
| M15 and below | CME futures | Real order flow | Actual buy/sell contract volume from the exchange, on every tick |
| M1 only | Not CME | Emulated tick rule | Side inferred tick-to-tick from price direction, scaled to the bar’s volume |
| M15 and below (not M1) | Not CME | Lower 1-minute bars | Direction taken from each 1-minute bar’s own up/down volume |
| Up to H4 | Any | Lower 5-minute bars | Same idea, one timeframe step down |
| Below W1 | Any | Lower 1-hour bars | Same idea |
| Below MN1 | Any | Lower 4-hour bars | Same idea |
| MN1 and above | Any | Lower daily bars | Same idea |
M1 gets a separate rule because there’s no smaller bar left to borrow direction from, so at that timeframe the calculation reads raw ticks directly instead. It only applies to non-CME symbols: M1 on a CME contract still gets the real order flow from the first row.

Forex Tester Online
See order flow built from the real side of the trade
Anchor: When The Running Total Resets
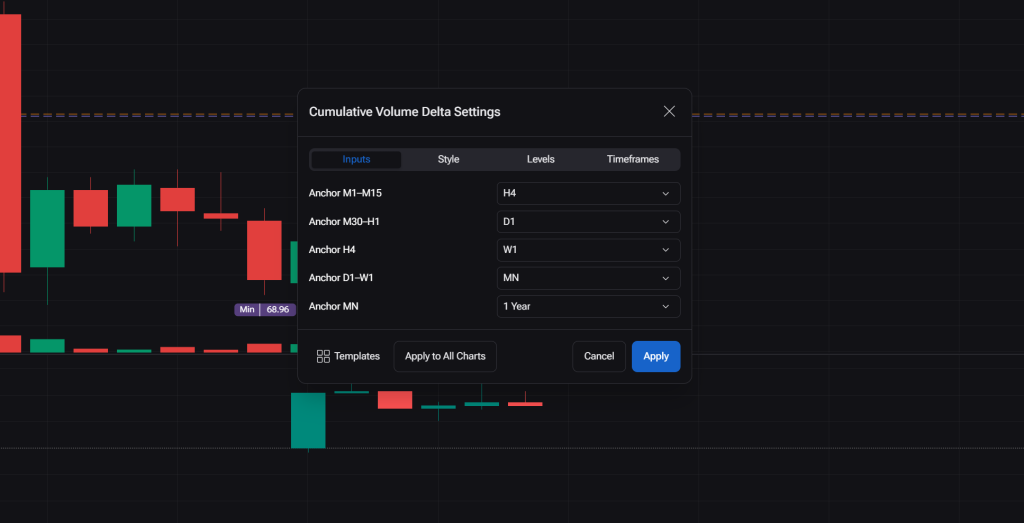
CVD resets to zero at the start of each anchor period, and which period that is depends on your chart’s timeframe. There are five separate anchor fields, each covering its own timeframe range, and each is a dropdown you can change: M1–M15 charts default to resetting every 4 hours, M30–H1 resets daily, H4 resets weekly, D1–W1 resets monthly, and MN resets yearly. Only the field matching your current chart timeframe is actually doing anything, but all five stay visible in the settings regardless, so it’s worth checking which one you’re editing before assuming a change did something. If the default period doesn’t fit how you trade, pick a different one from the dropdown, the setting isn’t locked to those defaults.
One detail specific to CME futures: the daily reset for those instruments follows the exchange’s own trading day, not midnight UTC. Futures sessions don’t line up with the calendar day, so if your CVD reset point looks like it’s happening at an odd hour, that’s the exchange’s session boundary, not a bug. All of this works the same way regardless of chart timeframe, from M1 up through monthly bars.
Reading It Is Not The Same As Testing It
Spotting a divergence after the fact, scrolling back and pointing at the place where CVD and price disagreed, is the easy part, and also the fun part: once you start looking, you’ll find them everywhere. The real order flow, the candle shape, the anchor resets, all of it is just setup for the actual question, which is whether that pattern actually does anything useful for you, entries, exits, or just confirmation, on your instrument, at your timeframe. Take that same curiosity into a backtest, and find out for real.
Forex Tester Online
Practice Cumulative Volume Delta Strategies in a Risk Free Environment