English
 Deutsch
 Italiano
 Français
 Português
 ไทย
ไทย
 Tiếng Việt
 Polski
 Türkçe
 Nederlands
 Română
 한국어
한국어
 Svenska
 Español
A regular candle tells you where price opened, closed, and how far it moved. It doesn’t tell you how much actually traded at each price inside that range, or which side was doing the buying and which was doing the selling. Footprint indicator fills that gap: it splits each bar into horizontal price rows and shows, row by row, how much volume traded on the buy side and how much traded on the sell side. Instead of one candle, you get a compact ladder showing exactly where inside that bar the trading happened, and who was pushing.
This article covers Forex Tester Online’s implementation specifically. On CME futures, FTO reads the buy and sell split straight from the exchange; on everything else, it’s estimated, and FTO says so directly. How each of those two data sources actually works is covered below.
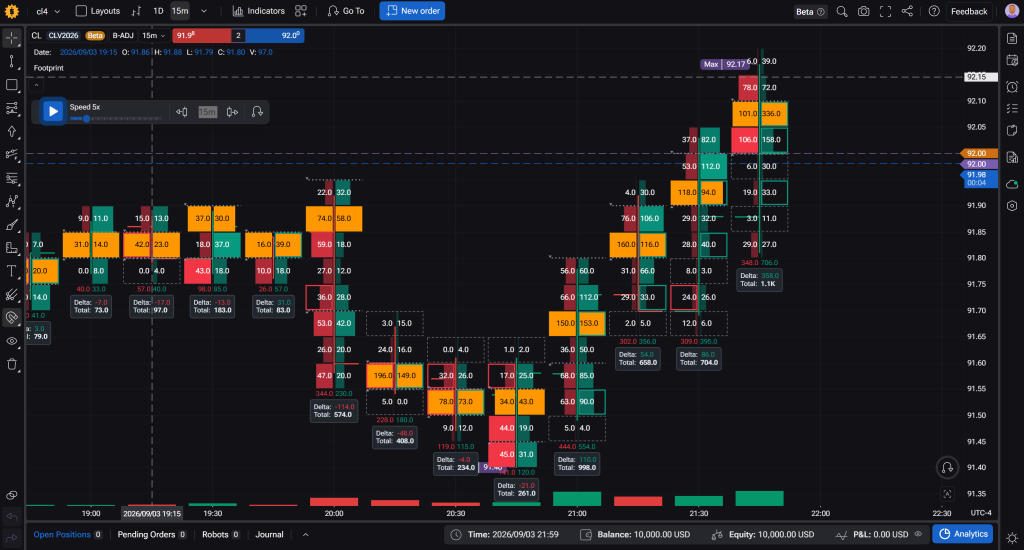
How It Looks On The Chart
Each bar gets its own stack of price rows, aligned to the candle’s actual high-low range. A few things are marked automatically once the relevant settings are turned on:
- POC (Point of Control): the row with the most combined volume in the bar. It’s filled with a solid, contrasting color by default (black, with white numbers) so it stands out from every other row at a glance.
- Value Area: the price band that contains a chosen share of the bar’s total volume, 70% by default. It’s marked with a dotted boundary line above and below the range, so you can see immediately whether a given row sits inside or outside the “fair value” zone for that bar.
- Imbalance: a diagonal comparison between neighboring rows where one side heavily outweighs the other. Rows flagged this way get a colored outline, matching the buy or sell color, along the edge where the imbalance was detected.
- Stacked imbalance: several imbalanced rows of the same side, one after another. These get a thicker outline than a single imbalance, so a real push through a range of prices reads differently on the chart than one isolated print.
- Low volume rows: thin rows, outlined with a dashed border, marking prices the bar barely traded through.
- Bar summary: underneath each bar, a small box totals up the sell volume, buy volume, the net Delta (buy minus sell), and the bar’s Total volume.
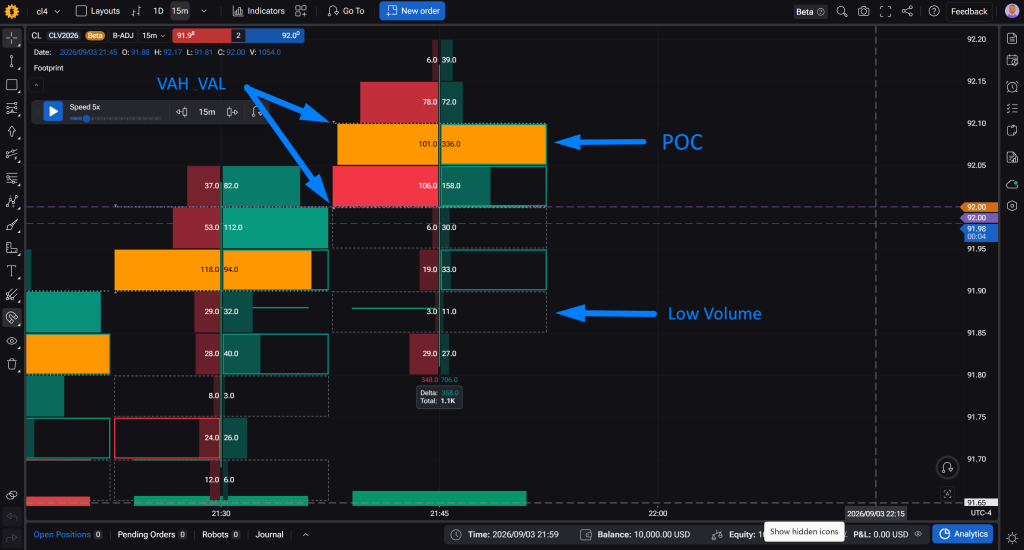
Reading a single footprint bar in FTO
Where The Numbers Come From
On CME futures, Footprint uses real order flow. Every trade the exchange records already carries a known buy volume and sell volume, so nothing is estimated: a trade filled against the ask counts as buy volume, a trade filled against the bid counts as sell volume, exactly as the exchange logged it.
On any other instrument, FTO falls back to an emulated tick rule instead. It compares each tick’s bid price to the one before it: price moved up, counted as a buy; moved down, counted as a sell; unchanged, the tick is dropped entirely and doesn’t count toward either side. In this mode, “volume” is really a tick count, not contracts or lots. The first time you open Footprint on a non-futures symbol, FTO shows a message telling you this directly: the buy/sell split there is simulated from ticks, not exchange data, and the numbers are approximate.
That distinction matters for how you read the numbers. On CME futures, the volume figures on the chart are the real thing. On everything else, treat the shapes and the general one-sided-versus-two-sided behavior as useful, but don’t read the exact volume numbers as literal contract counts.
Three Ways To Look At The Same Data
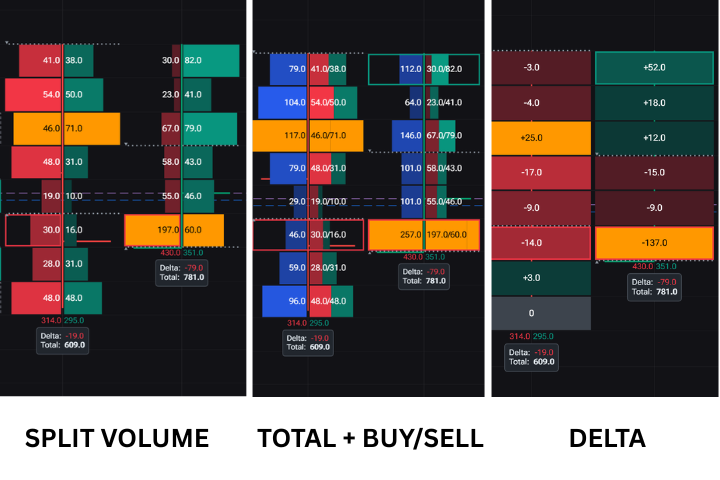
Footprint has three display modes, and switching between them changes which question is easiest to answer at a glance:
- Split Volume (the default): two columns per row, sells on the left, buys on the right. Best for comparing which side traded more at a specific price.
- Total + Buy/Sell: total volume on the left, the buy/sell breakdown on the right. Better when the total volume at a price matters more than which side won it.
- Delta: a single filled row, colored by whichever side had more volume, with the shading getting stronger the more lopsided the row was. This mode drops the raw numbers in exchange for speed: it’s the fastest way to scan a full bar, or a whole session, for where the imbalance concentrated.
Reading POC And Value Area
POC marks the single price the bar traded around the most. It’s not the open, the close, or the midpoint, it’s wherever the actual volume concentrated, and it’s the first thing worth checking on any bar you’re studying closely.
Value Area extends out from POC in both directions until it captures a set share of the bar’s volume, 70% by default. The two edges of that band are typically referred to as VAH (Value Area High) and VAL (Value Area Low). Everything inside the band is where most of the bar’s real trading happened; everything outside it traded comparatively thin. That makes VAH and VAL useful as levels in their own right, similar to how a volume profile’s value area gets used, just recalculated for a single bar instead of a whole session or range.

Backtest Footprint Strategies
Real data, reliable results. Try now.
Turning On Imbalance And Stacked Imbalance
Imbalance highlighting is off by default and needs to be switched on in the indicator’s settings before anything gets flagged. Once it’s on, FTO compares volume diagonally between neighboring rows rather than comparing buy and sell on the same row: a row’s buy volume gets checked against the sell volume on the row just below it, and separately, that same row’s sell volume gets checked against the buy volume on the row just above it. Whichever side wins gets outlined, on that one row only, in that side’s color, not both rows at once. That’s intentional. A resting order sitting at one price meets aggression that came in from the row next to it, not from the exact same price a moment later, so comparing diagonally is what actually reflects how the trade happened.
By default, one side needs three times the volume of the other to count as an imbalance, and both sides need at least some minimum volume, so a handful of contracts against literally none doesn’t get flagged as a dramatic imbalance. Both of those thresholds are adjustable in settings.
Stacked imbalance highlighting is a separate toggle, also off by default, and it only works if imbalance highlighting is switched on as well: it looks for a continuous run of same-side imbalances (three rows in a row, by default) and marks the whole run. A single imbalanced row could be one aggressive order. Three or more stacked on top of each other is a different signature entirely, it’s typically read as a genuine push through that price range rather than an isolated print.
Low Volume Rows
A low volume row is a price the bar traded through without much real activity, by default 10% or less of that bar’s busiest row. It’s not zero, an empty row isn’t flagged separately, it’s just thin compared to everything around it.
Picture a bar where most rows show volume in the hundreds, and right in the middle there’s a single row with a handful of contracts, sandwiched between two much heavier ones. That thin row is what gets outlined with a dashed border once this setting is turned on. Visually, it stands out as a gap: price moved through that level quickly the first time, without much trading actually happening there.
This setting is off by default and needs to be enabled before FTO starts marking these rows.
Key Settings And How To Use Them
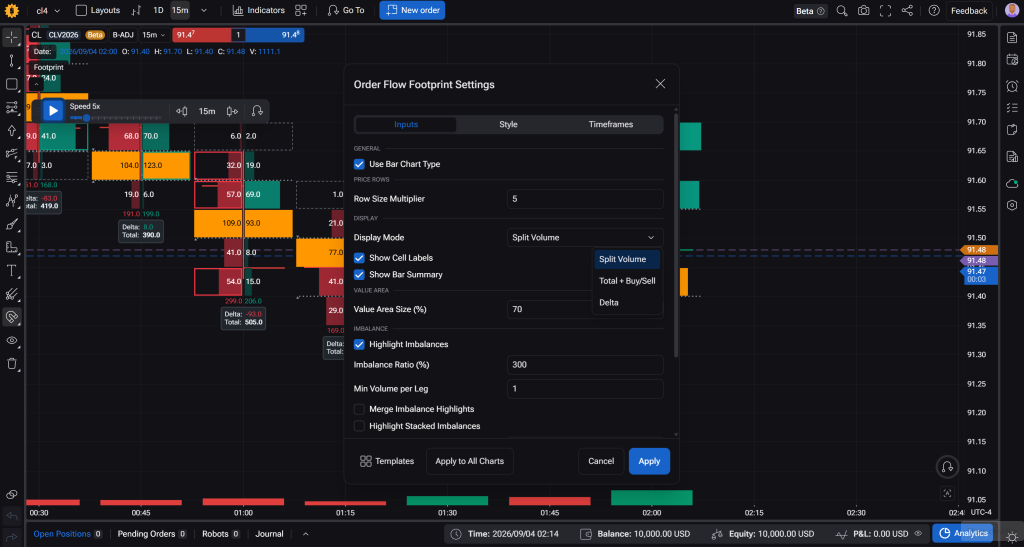
Footprint Settings in Forex Tester Online
- Row Size Multiplier: controls how tall each price row is, relative to the instrument’s minimum price step. A higher multiplier means fewer, wider rows per bar; a lower one means more, finer rows. Start wide on a fast-moving future and narrow it down if the rows feel too coarse to be useful.
- Value Area Size (%): the share of the bar’s volume the Value Area captures. Raise it toward 100% to widen the band, lower it to tighten the focus around POC.
- Imbalance Ratio (%) and Min Volume per Leg: together they define how strict the imbalance detection is. Raise the ratio to only flag the most extreme imbalances; raise the minimum volume to ignore imbalances built from very few contracts.
- Min Stacked Rows: how many consecutive imbalanced rows are needed before a stack gets marked. Lower it to catch shorter pushes, raise it to only flag longer, more decisive runs.
- Threshold (% of Bar Max): the cutoff used for low volume rows, relative to that bar’s busiest row.
- Merge Imbalance Highlights / Merge Low Volume Rows: when the same highlight repeats at the same price on consecutive bars, this combines them into a single continuous zone instead of redrawing the highlight bar by bar. Useful on a level that keeps getting revisited across a whole session.
- Use Bar Chart Type: switches the underlying chart from candles to bars while Footprint is active, since a candle’s wide body would otherwise sit on top of the price rows and cover them. FTO restores the original chart style automatically when Footprint is turned off.
One practical limit worth knowing: Footprint only calculates on timeframes of H1 and below. Above that, there’s nothing to show, since the underlying tick-level detail the indicator depends on stops being meaningful at that scale.
Pinning A Highlight As A Level
Every highlighted group, an imbalance, a stacked imbalance, a low volume row, or the POC row, gets a small “+” button next to it. Hovering over it previews how the highlight would extend to the right without committing to anything. Clicking it pins the highlight and extends it forward as an actual level on the chart, and the button switches to a “−” so the same click collapses it again.
Pinned levels are saved per chart, symbol, and timeframe, so they’re still there the next time that chart is opened, not just for the current session. There’s a cap of 200 pinned highlights per symbol and timeframe; past that, the oldest ones get dropped automatically to make room for new ones, which is only worth knowing if a lot of levels are being pinned at once on a single instrument.
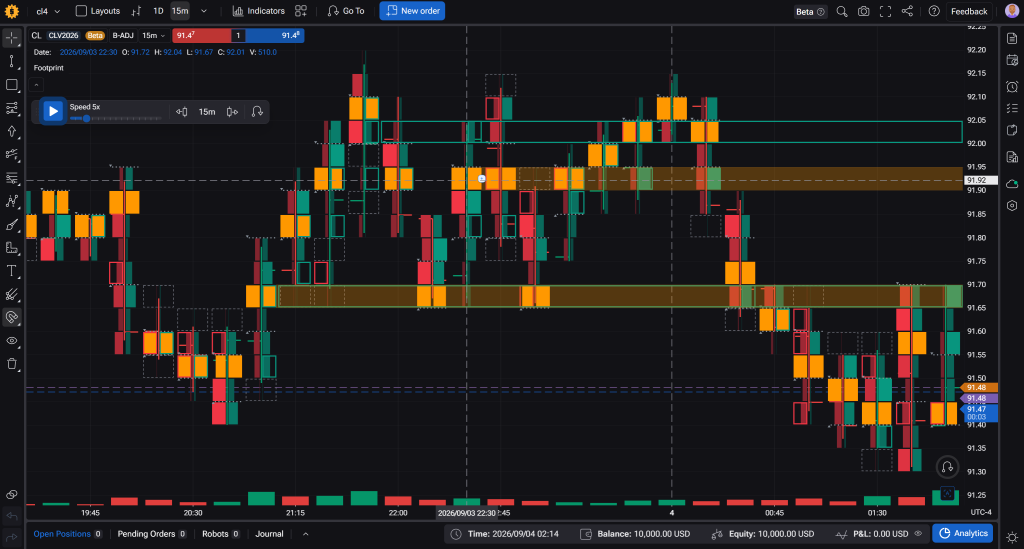
Extended POC and imbalance highlights into levels
How Traders Commonly Read These Signals
A few interpretive patterns come up often in order-flow analysis generally, worth knowing before building a read around any single bar:
A stacked imbalance appearing right where a previously tested level finally breaks is typically read as continuation, the same pressure that’s been building is what’s carrying price through. The same pattern appearing in the middle of an otherwise quiet range, with no prior context at that price, tends to carry less weight on its own.
Low volume rows near a previous swing high or low are often watched more closely than the same kind of gap sitting in the middle of an established range, on the logic that thin trading at a meaningful level is more likely to get revisited than thin trading somewhere price has no particular reason to return to.
A single lopsided Delta reading on one bar is generally treated as weaker evidence than the same imbalance repeating across several consecutive bars. One bar can be noise; a run of bars pointing the same direction is closer to a pattern worth testing.
None of this is a substitute for actually testing an idea against real data. Reading footprint charts builds intuition for what’s happening inside a bar; backtesting is what confirms whether that intuition holds up as an actual edge.
Want to see how order flow behaves on real CME data instead of an estimate? Test it directly in Forex Tester Online.
Forex Tester Online
Backtest order flow strategies with real data