English
 Deutsch
 Italiano
 Français
 Português
 ไทย
 Tiếng Việt
 Polski
 Türkçe
 Nederlands
 Română
 한국어
 Svenska
 Español
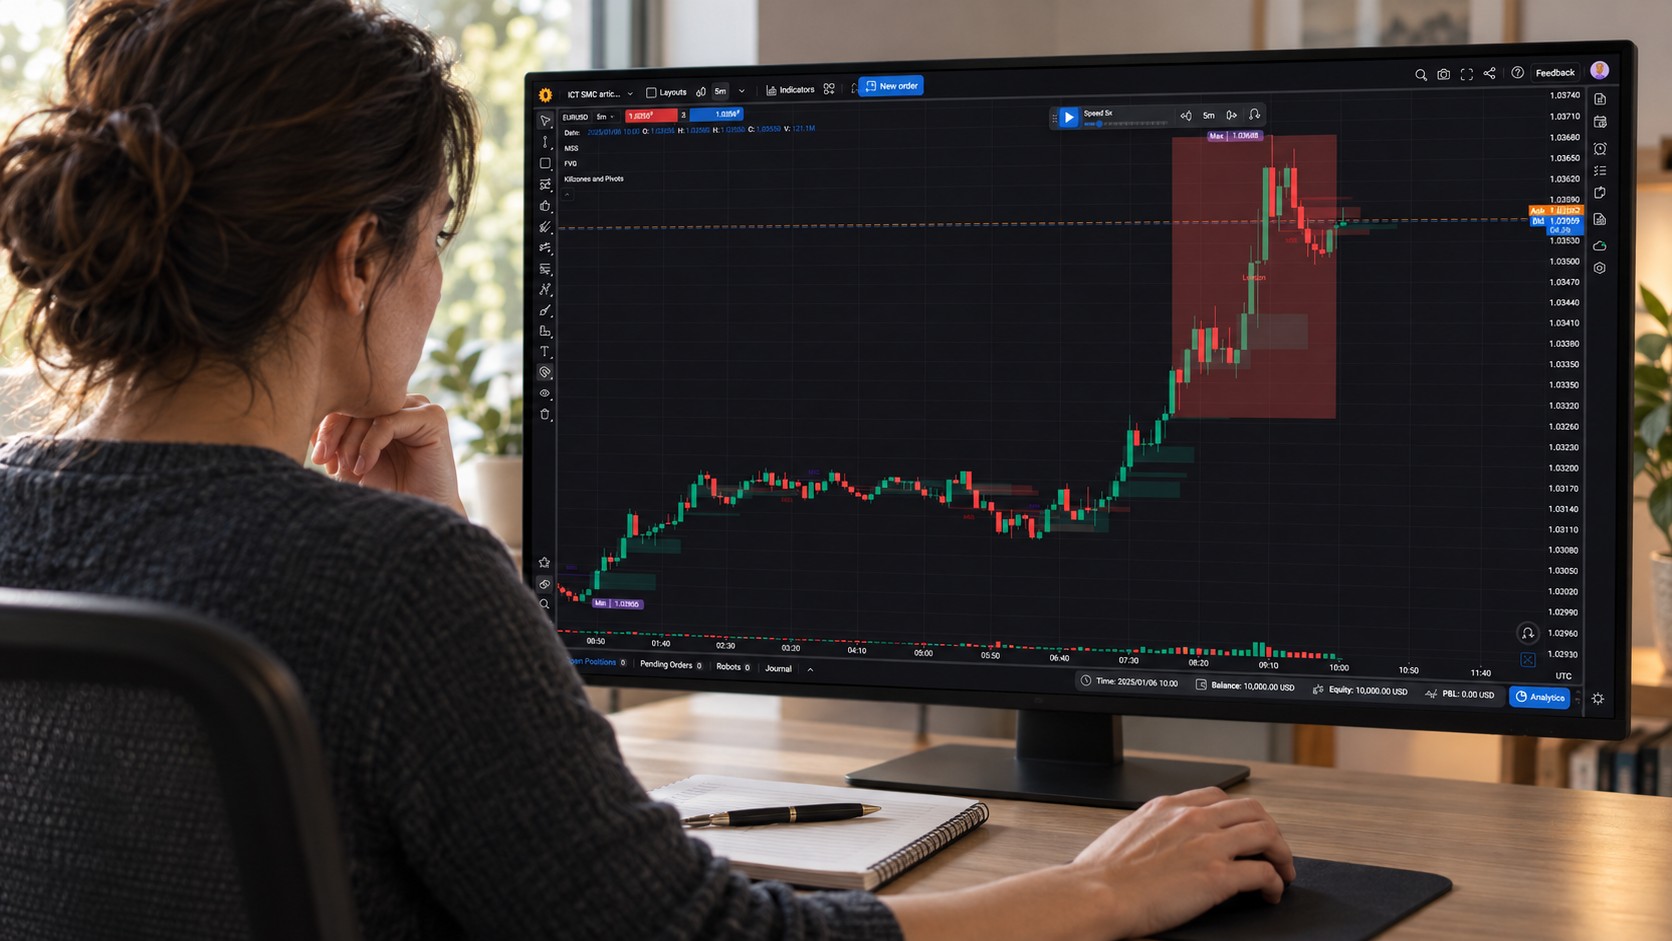
The sweep is obvious. The displacement is beautiful. The fair value gap practically has your name on it. Especially when the next twenty candles are already on the screen.
Then you hide the future, press play, and discover that your very clear trading model has developed several opinions.
Was that a structure shift? Does this smaller gap count? Would you really have taken the entry, or does it look convincing because you know where price went?
ICT SMC backtesting becomes useful when those questions have answers before the outcome. You need one recognizable setup, consistent execution rules, and a record that includes the trades you would rather forget.
This article takes one educational example through that process: a sweep, a confirmed structure shift, and a fair value gap retracement. Forex Tester Online lets you practice those decisions across historical sessions, keep the evidence and investigate what to improve. You can find expensive weaknesses in simulation before paying for them in a live account.
Why ICT SMC backtesting often fails to answer the real question
ICT and Smart Money Concepts give traders a vocabulary for describing price action. A vocabulary still needs rules before it becomes a testable strategy.
Suppose Monday’s trade needs a candle close through a swing. Tuesday’s counts on a wick. Wednesday’s uses a different swing because the first one was inconvenient. All three enter the spreadsheet under “MSS.”
What exactly did you test?
Discretionary trading can be tested, but the judgment must leave a record. “I skipped this because the retracement took too long” becomes useful when “too long” has a definition, recorded before you see the result.
Otherwise, your selection process quietly changes with every chart. Winners qualify. Losers acquire technicalities.
The first job of an SMC trading strategy backtest is to make those decisions visible. Write down what qualifies, what disqualifies, and what information was available when you decided.
The three building blocks: session, structure, entry
A repeatable ICT setup starts with three questions: when are you looking, what must price do, and how will you trade it?
Session: give the setup an appointment
Choose one instrument, one execution timeframe, and one entry window. Specify the time zone and how daylight saving changes are handled.
“London session” leaves room for interpretation. “EUR/USD, five-minute chart, entries from 08:00 to 10:00 Europe/London time” is something you can apply consistently.
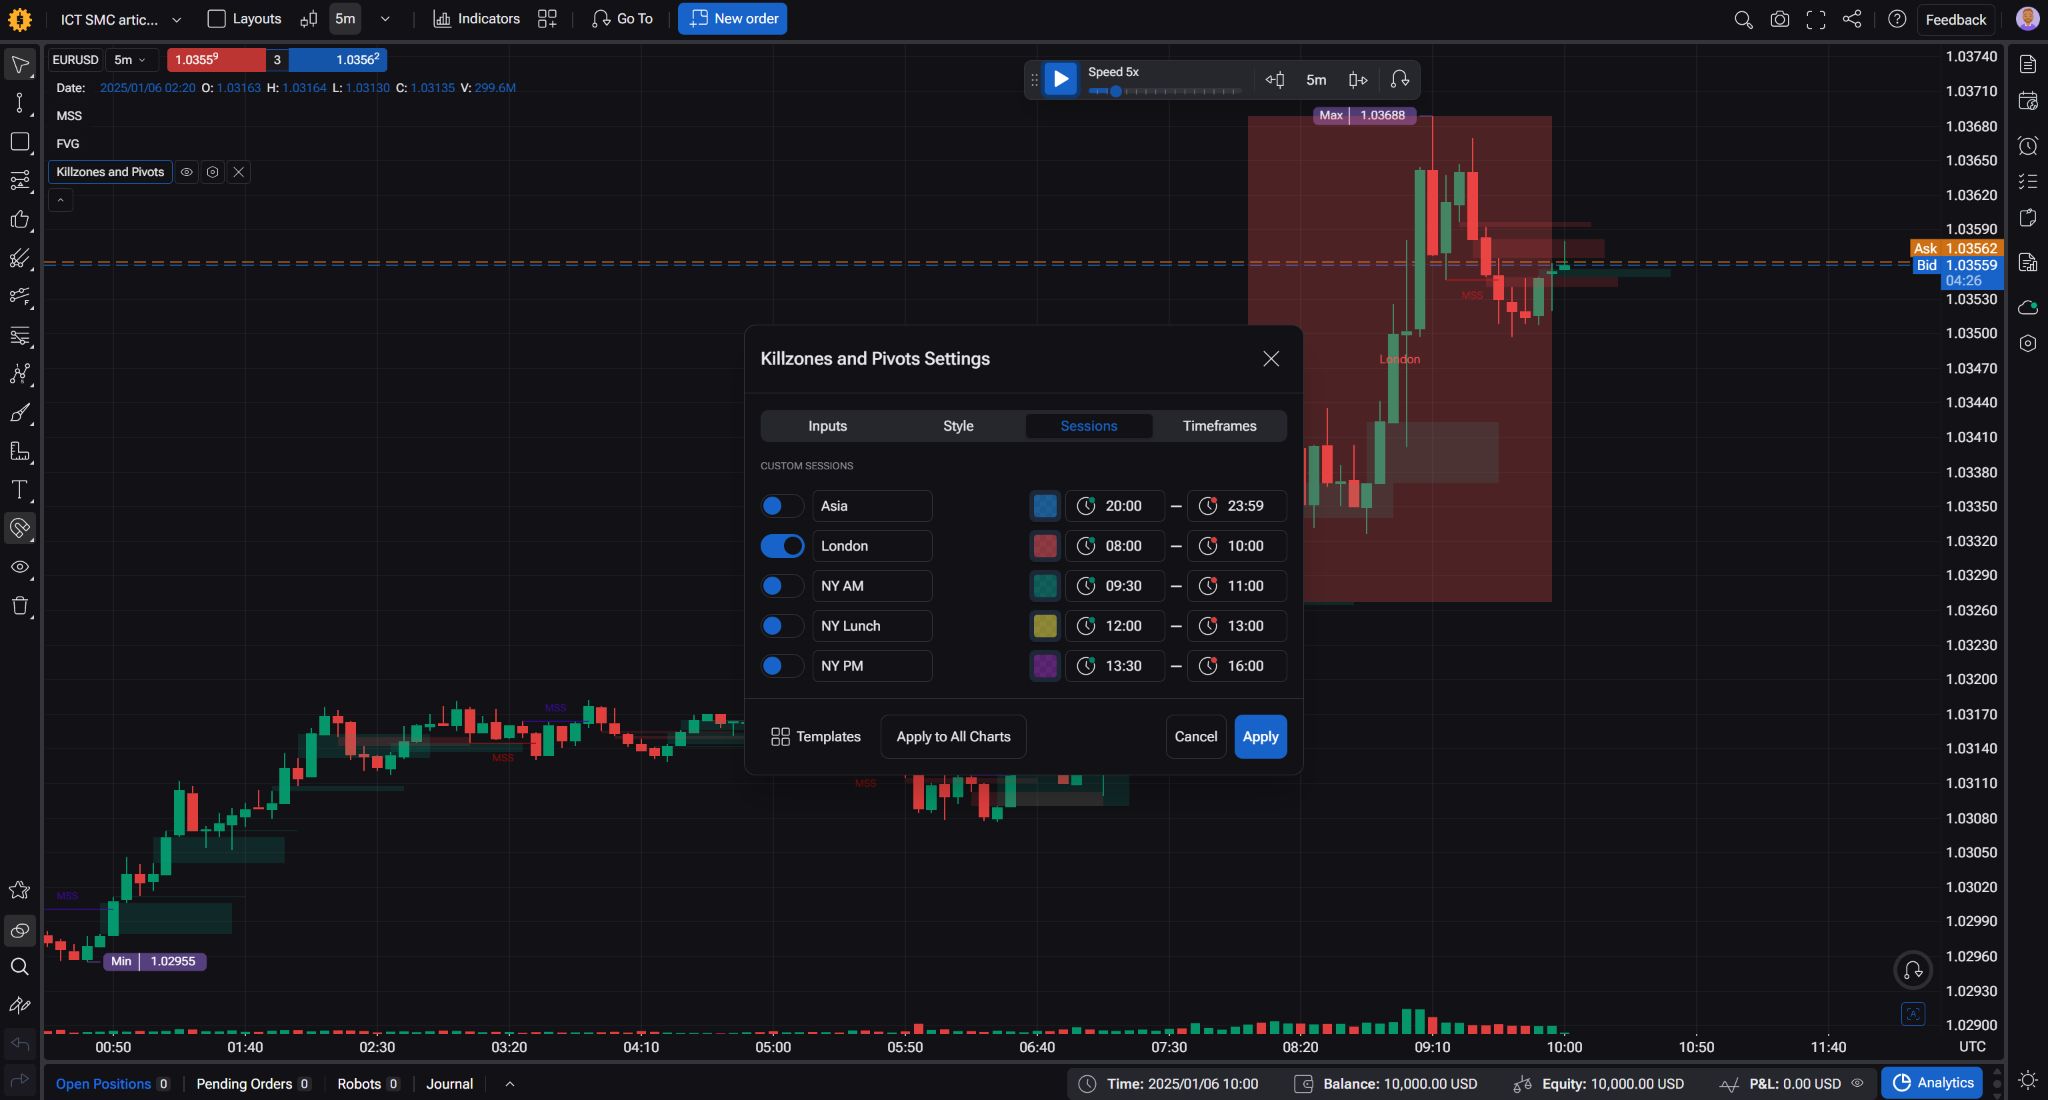
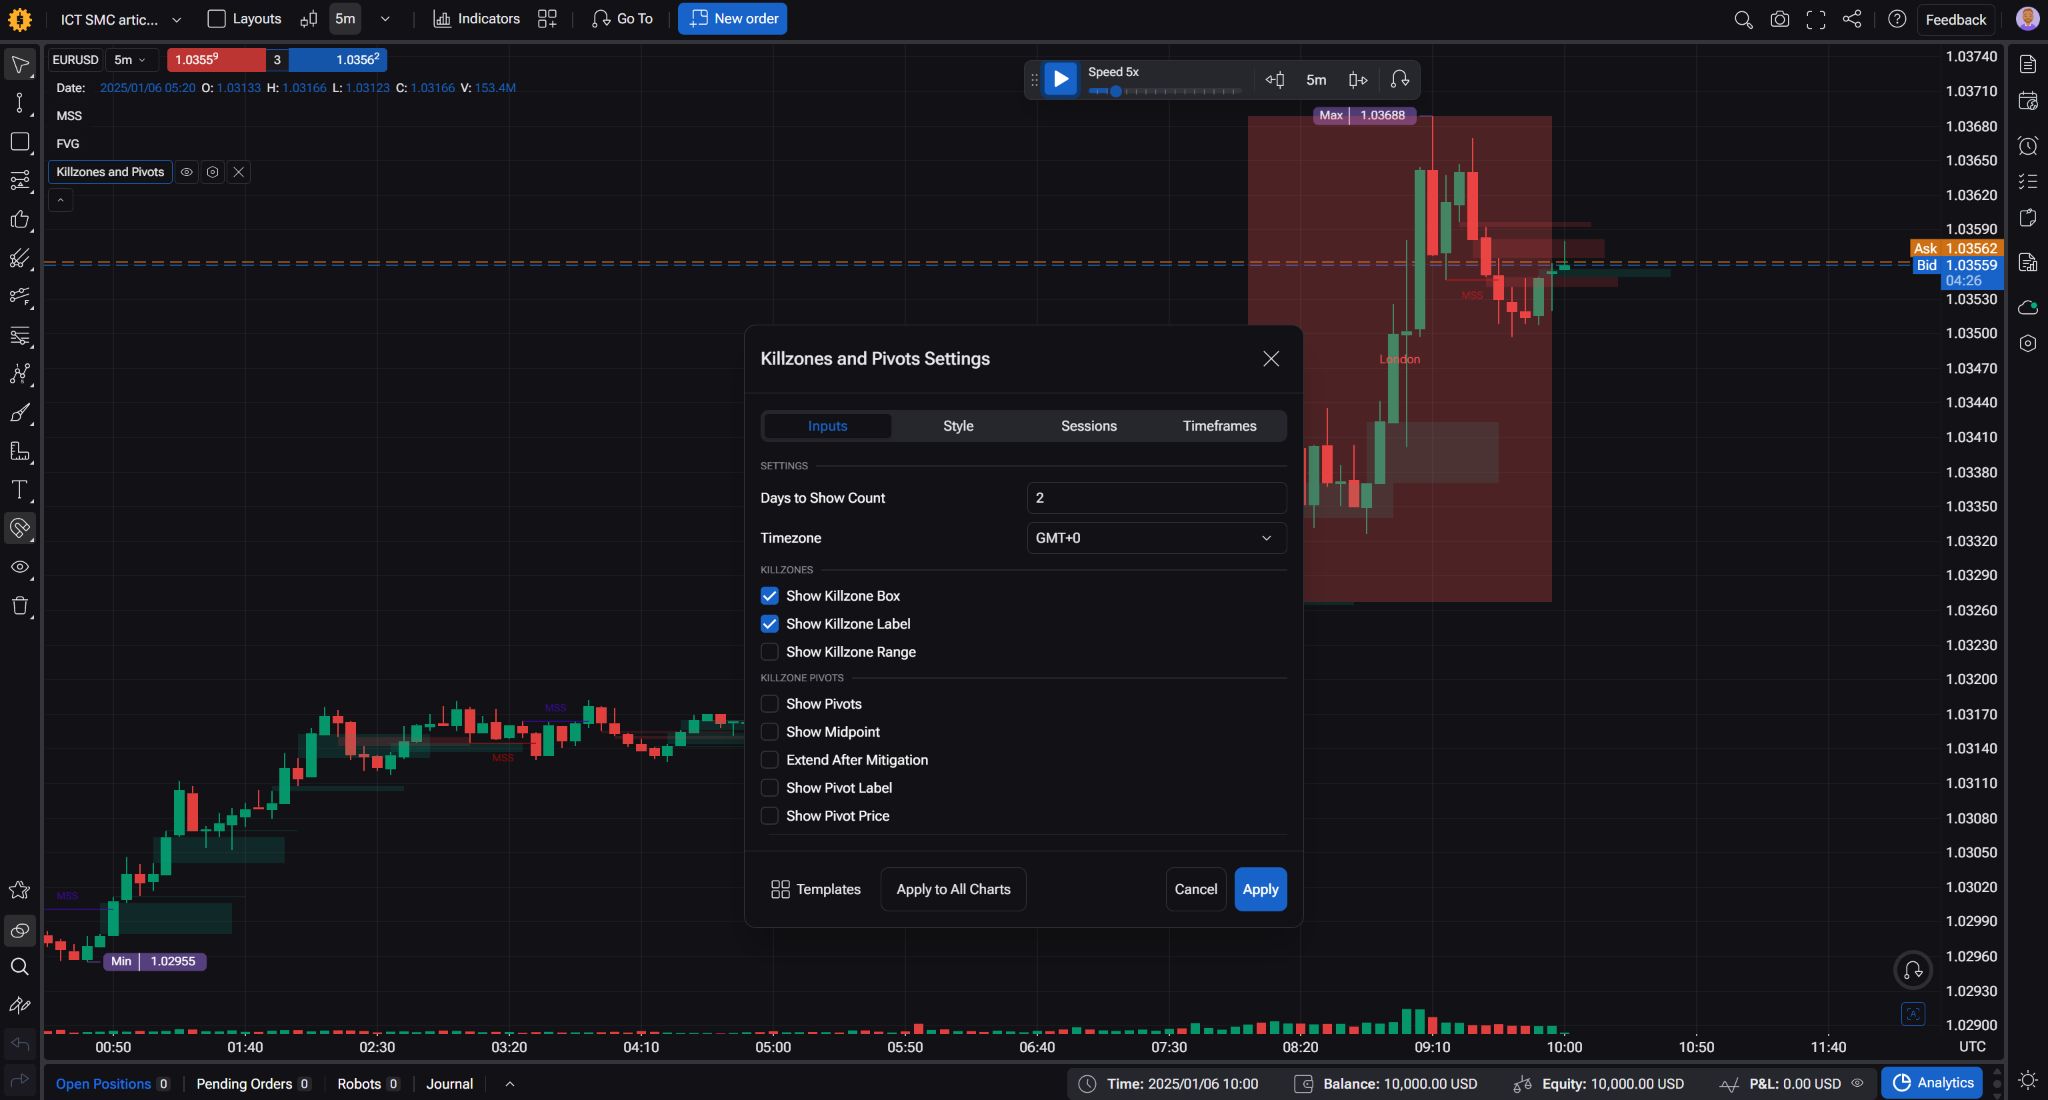
ICT killzones can help organize your observation window. Their presence on a chart does not establish an edge. Keep the window fixed while you investigate whether the setup has one.
Structure: decide what counts before it happens
For this example, we will investigate short entries after a sweep of the previous trading day’s high.
Define the daily boundary used to calculate that high. Then define the sweep and the structure break. A wick through a level and a close through it are different events.
Market structure shift backtesting also needs a rule for when a swing becomes knowable. A pivot requiring two candles on its right cannot be confirmed until those candles have closed. The finished chart will happily show you more than you knew at the time.
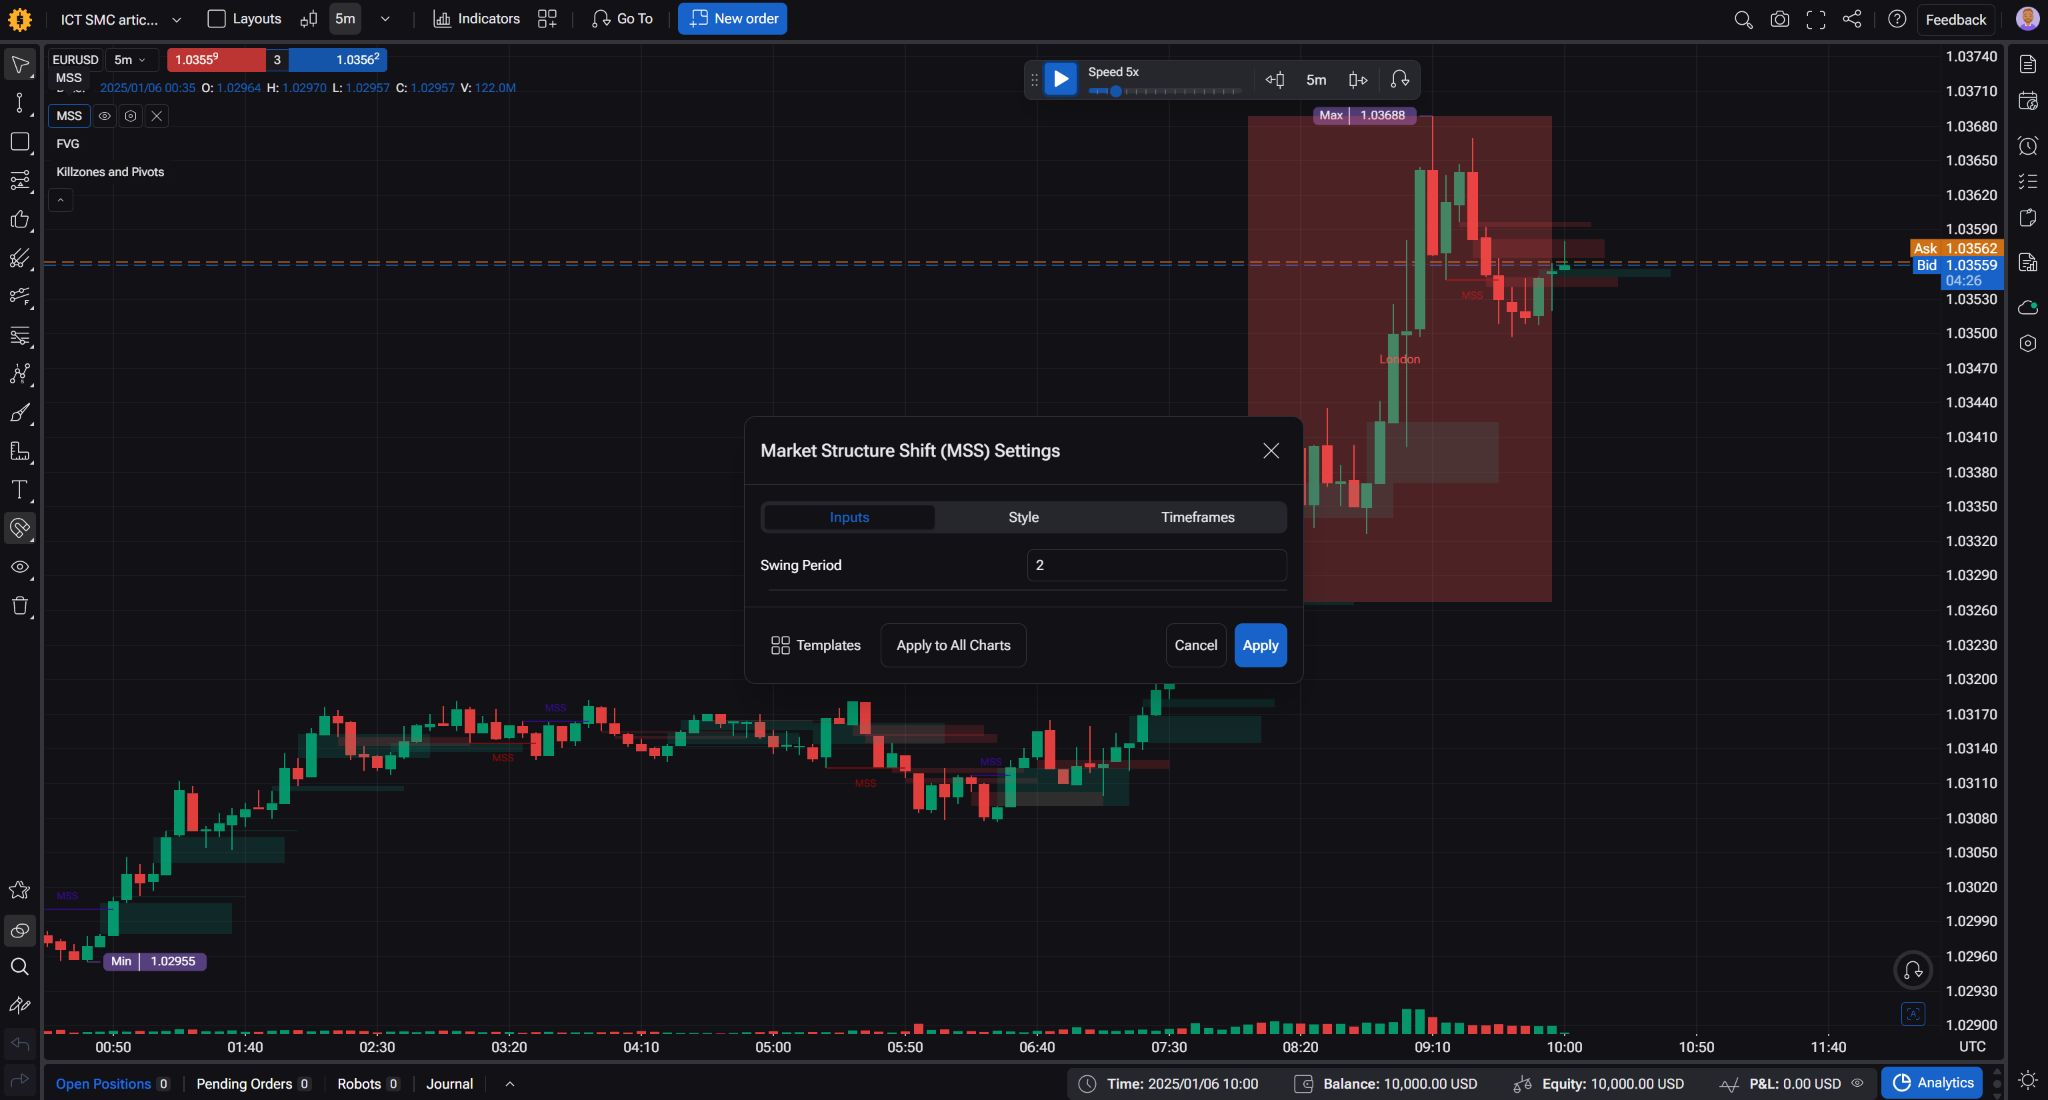
FTO’s built-in MSS indicator includes an adjustable Swing Period, which controls the scale of the swing highs and lows used to identify market structure. A smaller value makes the indicator more sensitive to minor fluctuations; a larger value focuses on broader swings and generally produces fewer structure-shift signals. In a typical two-sided pivot calculation, Swing Period 2 means comparing a potential swing with two candles on each side, so confirmation requires the two subsequent candles to close. Keep the setting fixed throughout your test and check confirmation timing in replay.
Entry: turn the picture into an order
For a bearish three-candle fair value gap, this example requires the third candle’s high to remain below the first candle’s low. The gap becomes available only after the third candle closes.
Define your entry price, stop, target, order expiry, and maximum trades per day. Specify what cancels an unfilled order.
These choices form an experimental rule set, not a claim that this is the best or only interpretation of ICT.
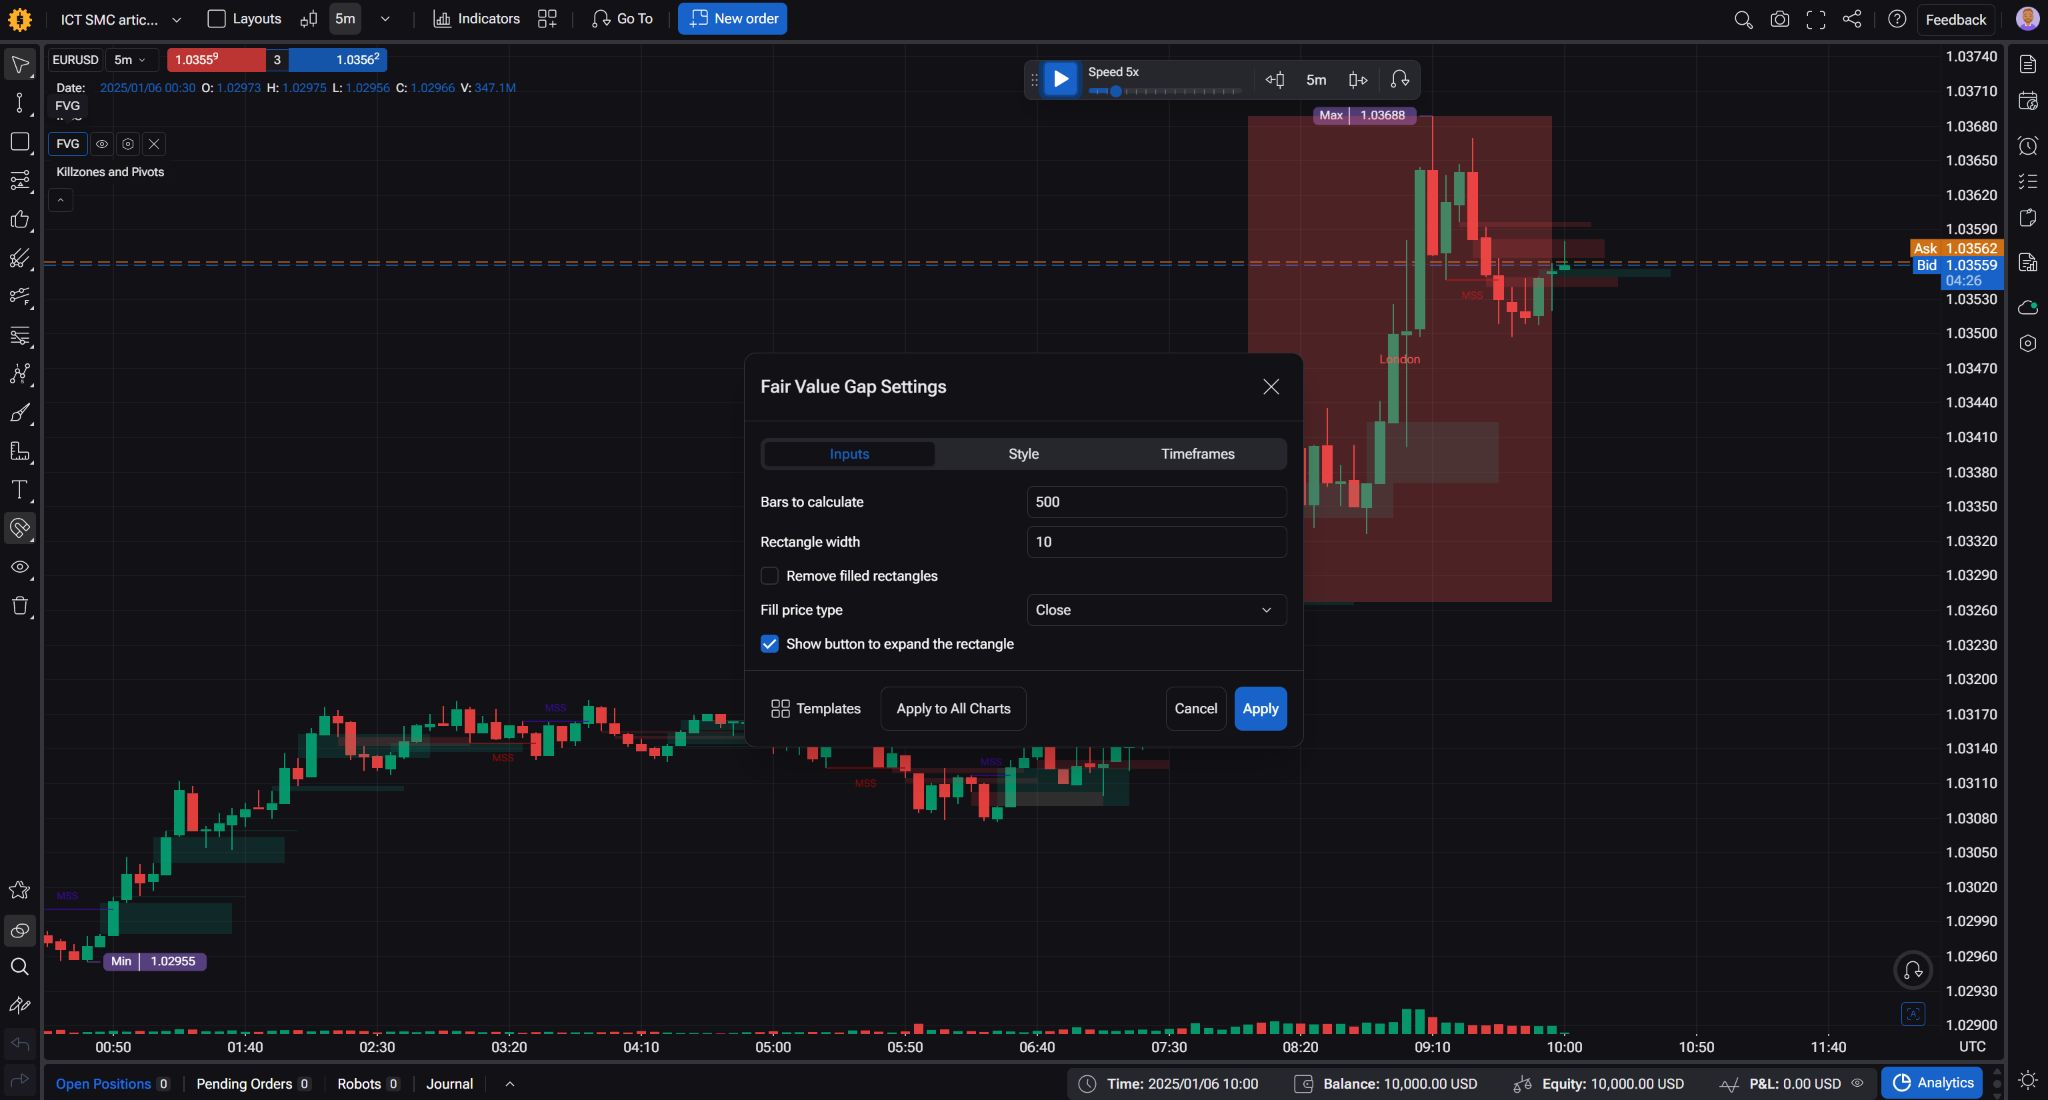
How the ICT indicator toolkit supports the process
Use the Forex Tester ICT guide for platform context, then build a layout around the decisions your test actually requires.
The ICT indicator toolkit has practical jobs:
ICT daily levels: keep reference levels visible and check their session boundaries.
MSS: help locate potential structure shifts; verify that the indicator’s settings match your written definition.
FVG and iFVG: distinguish your chosen gap setup from an inverse fair value gap setup. Test them separately if their entry logic differs.
ICT killzones: mark the time window you have chosen to study.
FTO also includes Power of Three and Session Boxes, documented in its September release notes. A Power of Three ICT model needs explicit definitions for its phases. Session boxes trading layouts help mark time ranges, but the box itself is not an entry rule.
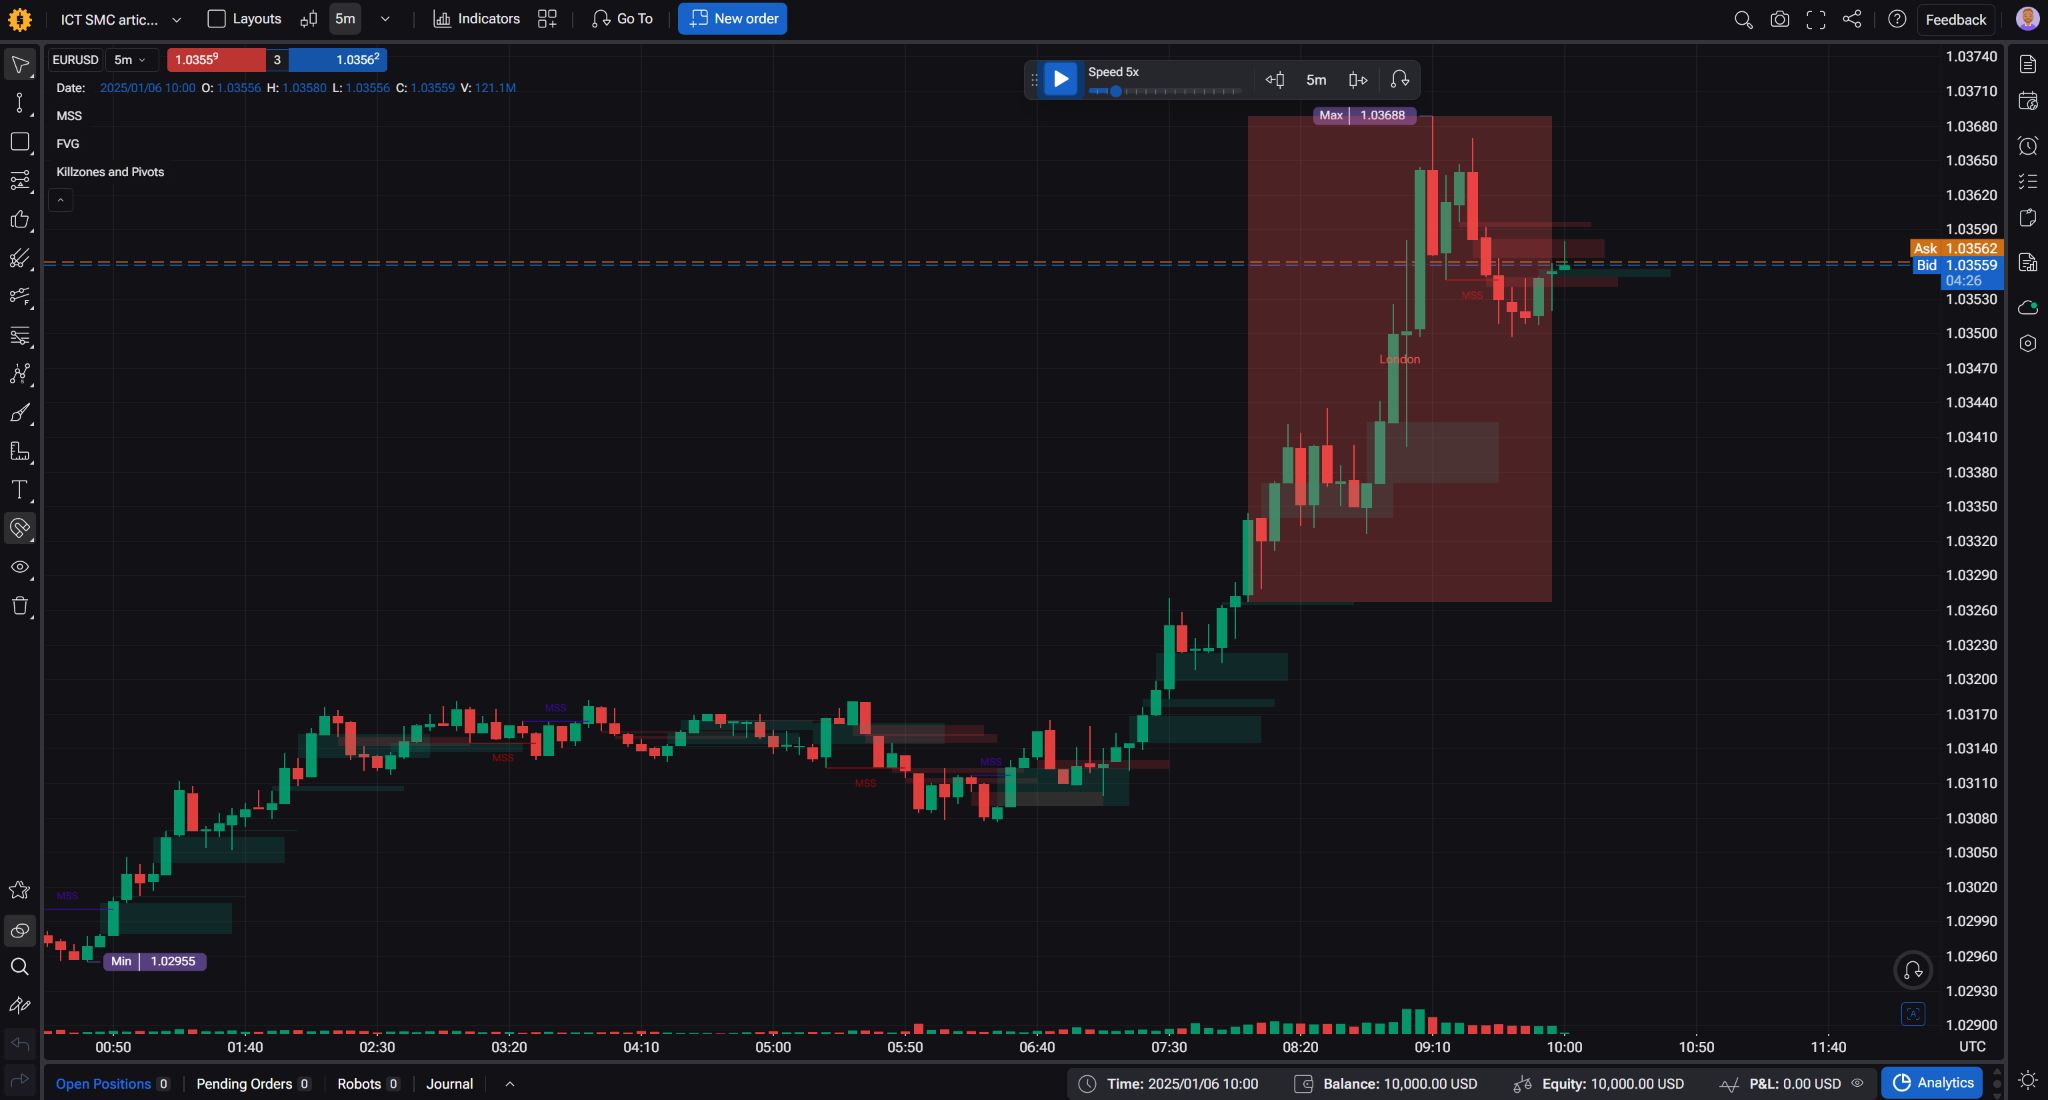
Keep MSS, FVG and Killzones in one FTO layout so you spend less time rebuilding charts and more time applying the same rules. The indicators help you locate and document the conditions; replay tests whether you could actually act on them.
FTO’s more distinctive contribution comes after that: the saved project connects your entries with a journal, Trade Analyzer findings and Exit Optimizer experiments. You can move from a losing trade to a specific rule to test next without reconstructing the study in separate tools.
Step-by-step: build one ICT SMC backtesting project
1. Write a setup card
Here is a deliberately narrow example for a fair value gap backtest. Its parameters are starting assumptions, not optimized settings or a trade recommendation.
| Component | Rule for this experiment |
|---|---|
| Market and window | EUR/USD, M5; signals and entries between 08:00 and 10:00 Europe/London time. |
| Reference level | Previous completed weekday’s high, using days bounded by 00:00 UTC. |
| Sweep | A candle trades above that high and closes back below it. Freeze the reference swing when this candle closes. |
| Reference swing | Most recent five-candle pivot low already confirmed before the sweep candle opened; its low must be below the lows of the two candles on either side. If absent, skip. |
| Structure shift | Within the next six candles, a candle closes below the frozen swing low. |
| Gap | First bearish three-candle FVG whose third candle closes at or after the structure confirmation, within that same six-candle window. |
| Entry | After the gap is confirmed, place a sell limit at its midpoint. No retrospective fills. |
| Stop and target | Stop one pip above the sweep high; target twice the entry-to-stop distance. No partial exits or trailing stop. |
| Expiry and invalidation | Cancel an unfilled order at 10:00, or earlier if price reaches the proposed stop. Close any remaining position at 12:00 London time. |
| Attempts | Evaluate only the first qualifying sweep each day; maximum one filled trade. |
Keep position risk consistent and record the spread, commission, and execution assumptions. For this initial experiment, add no discretionary news exclusions. If you want a news filter, specify it as a separate version before testing.
The exact parameters may deserve revision later. For now, they give the experiment boundaries.
2. Separate development from validation
Choose a chronological development period to clarify the rules and a later, untouched period for validation. Write both ranges down before reviewing trades.
During development, you may discover ambiguities and revise the setup card. Those results describe the development process. They do not provide an independent test of the final rules.
Freeze the final version before opening the validation period. If you revise it after seeing those results, that period becomes development data too. You need fresh observations.
3. Replay without borrowing tomorrow’s information
Set up the instrument, timeframe and trading costs in FTO’s backtesting software. Historical data, simulated orders and the journal stay in the same project. That makes a repeated test practical: you can pause at a decision, place the order and return to its reasoning when reviewing the result.
Use Smart Navigation to reach the next session or a predefined price-level touch instead of scrolling through inactive hours. For this setup, a touch of the previous day’s high is a candidate to inspect, not an automatic qualifying sweep. Work through the selected dates in order and still record no-trade days. Speed should remove waiting, not inconvenient evidence.
Check indicator confirmation timing. A label placed on an earlier candle may only become available several candles later. Higher-timeframe context must also reflect what was visible then, not the eventual completed candle.
Slow tick-level replay around the gap entry, stop and target to inspect their sequence inside a candle. A finished M5 candle can hide whether an order could have filled before the stop was reached. If the available data leaves the sequence unresolved, flag it and apply the same conservative rule.
For a separate recognition-bias check, FTO’s Blind Mode hides identifying market context such as the instrument and dates. That helps when you recognize a famous historical move. Keep the session and reference-level rules defined; hiding labels alone cannot make a test unbiased.
4. Keep the winner, the loser, and the lookalike separate
These three cases belong in your review:
Valid winner: every condition was satisfied before entry, the order filled, and the target was reached. Include it.
Valid loser: the same conditions were satisfied, but price reached the stop. Include it with exactly the same enthusiasm.
Invalid lookalike: price swept the high and eventually fell, but no qualifying structure shift occurred before the deadline. Record the rejection. The later move does not promote it into a valid trade.
A setup that never retraces to your limit is an unfilled opportunity, not a missed winning trade. Log it separately.
5. Record enough to reconstruct the decision
FTO records the simulated trades; use its journal to add what the execution record cannot explain: rule version, sweep and confirmation times, rejection reason and a decision-time screenshot. Tag compliant entries separately from rule violations. Built-in capture reduces transcription work and keeps the chart context beside the outcome. Here, 1R is the initial planned monetary risk.
Record no-trade days and rejected candidates too. They show how often the model actually offers an opportunity.
If you make an execution mistake, flag it. Keep the actual outcome separate from any hypothetical rule-compliant replay. A corrected simulation should never quietly replace the original trade.
What ICT SMC backtesting results actually tell you
A win rate answers one question: how often did the recorded trades win? You also need average win, average loss, costs, drawdown, and opportunity frequency.
For the worked calculation, take 100 trades: 40 winners averaging 2R and 60 losers averaging 1R, before costs.
Average gross result = (0.40 × 2R) − (0.60 × 1R) = +0.20R per trade.
At an average cost of 0.08R, that becomes +0.12R net per trade. The calculation shows how to reconcile a report; the setup card still needs its own recorded sample.
In your own results, use actual average outcomes. Timed exits, spread and commission can make them different from the target printed on your setup card. Live or imported trades may also include slippage or partial fills; FTO does not model slippage.
Use Trade Analyzer to investigate how that average was produced. Its session, timing and risk insights can highlight where your results weaken and suggest what to examine next. Return to the supporting trades: is the problem an unprofitable setup, inconsistent sizing or entries taken outside your own window?
A positive historical average is an estimate, not a permanent property of the setup. There is no trade count that automatically certifies an edge. Look for results that remain credible on untouched data, across different conditions, and under less generous cost assumptions.
Then take one finding into a new experiment. If exits look weak, FTO’s Exit Optimizer can compare stop, target and maximum holding-duration settings against your recorded entries. That saves repeating the full entry-selection exercise for each exit idea. Preserve the baseline and validate any revised exit on untouched dates before adopting it.
Common mistakes that undermine ICT SMC backtesting
Changing definitions after a loss. If the sweep suddenly needs another qualification, you have a new hypothesis. Preserve the original result.
Selecting only attractive days. A chronological sample includes quiet sessions, ugly price action, and no trades. Choosing dates because you remember a clean move biases the sample.
Using future confirmation. Pivot labels, completed higher-timeframe candles, and retrospective gap markings can leak information into earlier decisions. Check when each condition became available.
Treating every touch as a perfect fill. Bid/ask differences, spreads, and price gaps matter. Record the execution model and use achievable prices.
Adding filters until the history behaves. More conditions can improve the same historical sample while leaving less evidence for the next one. Keep changes explainable and validate them separately.
Confusing compliance with profitability. A perfectly executed losing trade can be valid evidence. A profitable rule violation cannot establish the edge of your written strategy.
This article is educational. The example is an unvalidated testing framework, not a trading recommendation. Historical and simulated results do not guarantee future performance.
Give one setup a fair test
Useful ICT SMC backtesting replaces a persuasive chart with decisions you can audit. You learn whether the setup qualifies often enough, whether you can execute it consistently and whether its results remain promising after costs.
FTO makes that investigation easier to repeat: navigate to relevant moments, inspect the sequence in replay, keep your decisions in the journal and use the analysis to choose the next test. The value is a faster learning loop and fewer untested decisions reaching your live account.
Choose one setup and test it in Forex Tester Online. Fix the rules, move forward, and count every qualifying trade.
Including the ones you would never post.

Give Your ICT Setup a Fair Test
Replay historical markets, practice your entries and review every trade in Forex Tester Online.