Summarize at:
A multifactor mechanism of the financial markets, that seems to be very complicated externally, is also subjected to the elementary laws of statistics. Each trading account is a part of a huge money flow and to understand the overall movement, a trader is obliged to use any average value correctly.
The ADR indicator (Average Daily Range) calculates the most important value − the average daily price range for the selected financial asset.
Apparently, this indicator was developed by the intraday trading enthusiasts: you are offered an automatic «calculator» for analyzing the average volatility for a period, which allows you to solve the main problems of short-term trading − determining the optimal entry/exit points.
Why ADR Matters for Traders?
Correct analysis of volatility is an extremely important element of any trading strategy. Insufficient attention to the market activity leads to an incorrect installation of the Take Profit/Stop Loss orders, that is − either to losses or losing a potential profit.
The Average Daily Range is represented by «reasonable», statistically justified price boundaries, in which the market movement is highly expected − this allows choosing the right trade tactics in a zone of the strong price levels.
In fact, the ADR indicator shows changes in the price values per unit of time (for example, for medium-term and intraday methods, the D1 timeframe is usually used) and solves the following tasks:
- automatic calculation of trading ranges for a trading day, week, month;
- determination of potential levels of the market demand/supply (support/resistance);
- determines the extreme price points (max/min).
Ready to test trading strategy with ADR indicator?
To check this (or any other) strategy’s performance you can try Forex Tester Online (FTO).
To better understand how to use FTO check our step-by-step guide or watch this video:
Want to see if ADR levels really help with timing trades and setting stop-losses? Here’s how to test ADR-based strategies step by step in Forex Tester Online — without risking real capital.
1) Sign up and open the platform
Go to the FTO website, register, and activate your subscription. No downloads — everything runs in your browser.
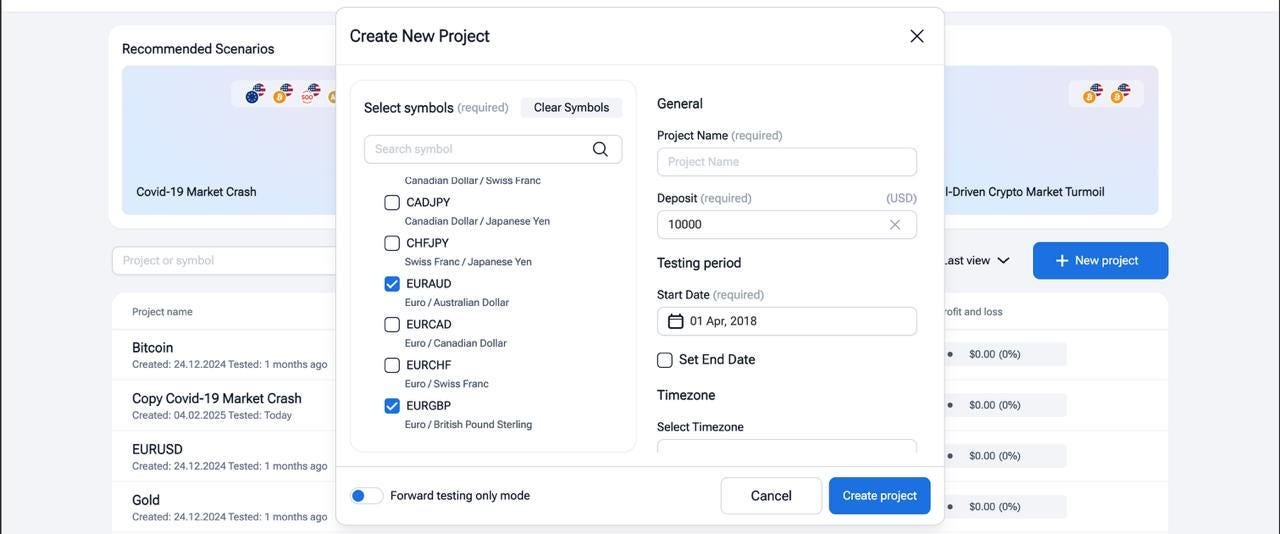
2) Create a new project
Click + New Project
-
Select your asset (e.g., GBPUSD)
-
Choose a timeframe (e.g., H1 or H4)
-
Pick a recent date range (e.g., last 30–60 days)
-
Name the project and hit Play
3) Add ADR indicator
In the Indicators panel, search for and add the Average Daily Range indicator.
Set parameters — for example, Day_x = 14 to calculate a 14-day ADR.

You’ll now see the daily high/low boundaries and ADR values on the chart.
4) Mark levels and test setups
Try a simple intraday setup:
-
Asian session range breakout (before London open)
-
Place Buy/Sell Stop orders just outside the ADR levels
-
Use TP/SL at 50–75% of the current ADR, as per your risk preference
Use the “Go Forward till price touches object” tool to fast-forward to key price reactions at ADR levels.
5) Run the backtest
Use tick-by-tick simulation to mimic live trading.
Place trades based on price behavior around the ADR bands.
Try reversal entries near top/bottom of the ADR range or breakout entries beyond ADR + news spike.
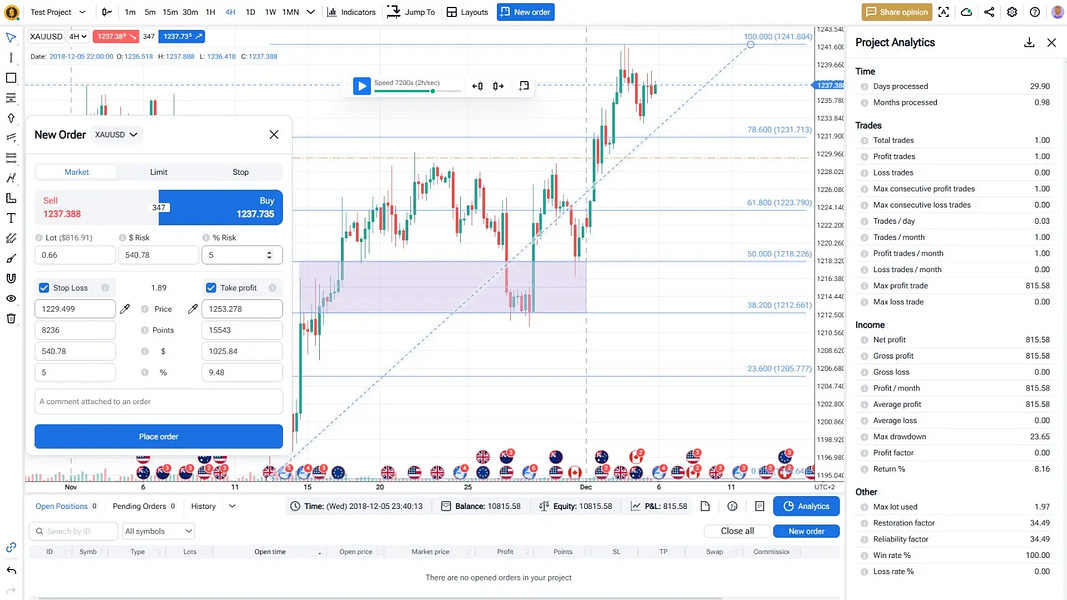
6) Check the results
Go to Analytics
-
See your win rate, net profit, average trade length, drawdown, etc.
-
Analyze which ADR setups performed best across different days or sessions
7) Iterate and optimize
-
Adjust ADR periods (e.g., 5 vs. 20 days)
-
Test with different timeframes or assets
-
Try combining ADR with filters (like volume, sessions, or news)
Backtest your ADR-based setups before risking real money.
Trade smarter with Forex Tester Online.
How to Calculate Average Daily Range: Formulas and Examples
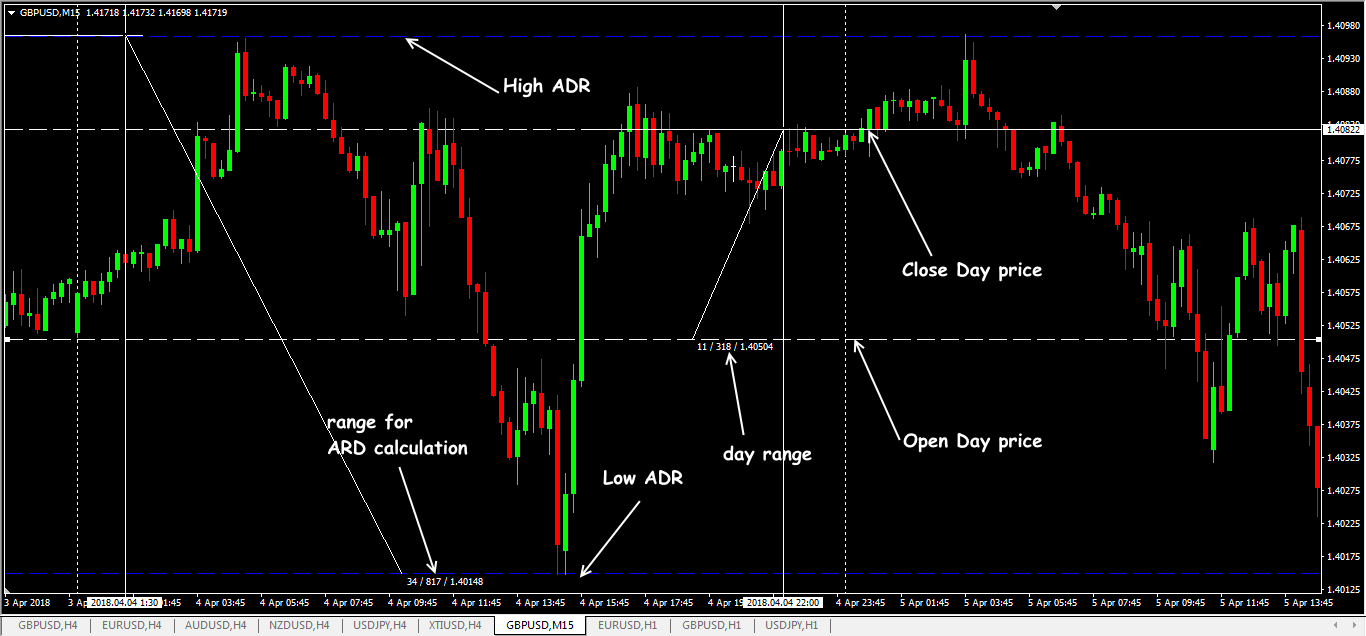
The average price range is a value that the price has passed from min to max within one trading day. The result of calculation is displayed in the trading terminal window in a separate information board.
Reminder: this range is not equal to the distance between the opening and closing prices of the trading day!
ADR is calculated as the Average Daily Range (the difference between high price and low price values of a day bar) for the selected period. For example, if you want to determine the value for a week, then calculate the sum of the data for each day of the week, and divide by the number of trading days:

The result is obtained in price points. The same calculation mechanism is applied to any other period.
Borders of the ADR range
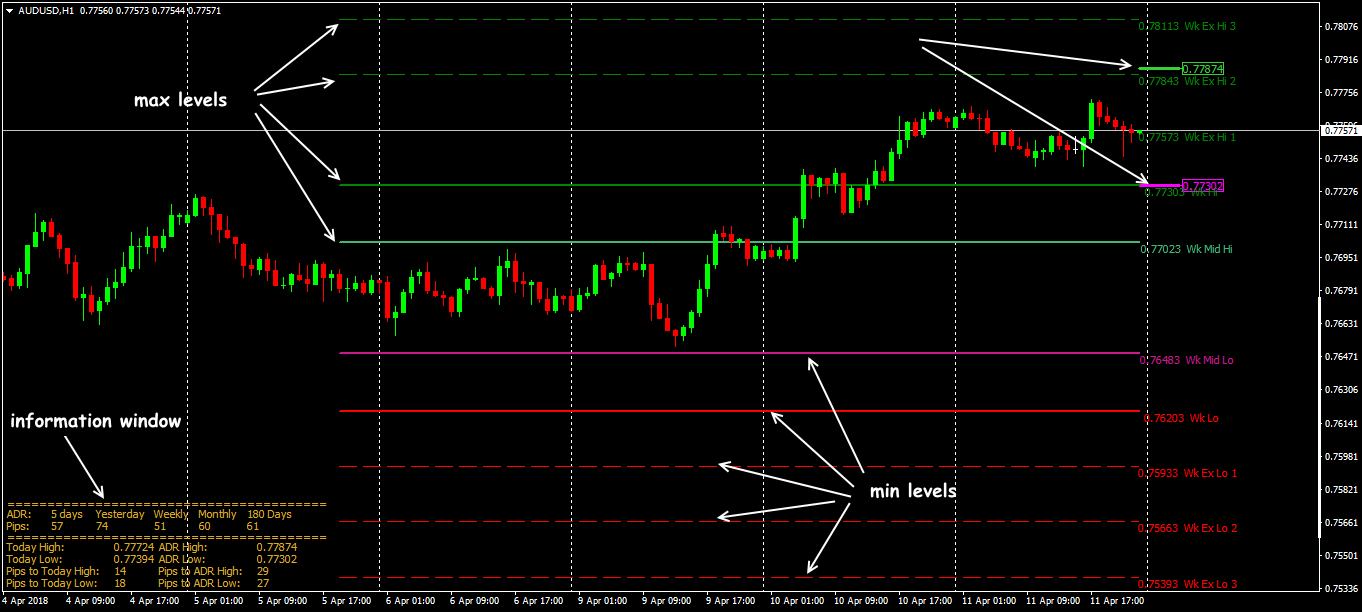
In addition to the two main ADR lines, after the calculation on the price chart (depending on the parameters − read below), several additional price levels are displayed. They are also calculated on the ADR principle.
The subsidiary WeekHi level is the sum of ADR for the week and the last Friday’s closing price; similarly, the WeekLo level is calculated as the difference between ADR for the week and the last Friday’s closing price.
If the sum of ADR for the week and ADR for the month is divided by 4, and then last Friday’s closing price is added, then we get the WeekMidHi level. If we minus this value, we get the WeekMidLo level.
The remaining levels are constructed additionally at the distances equal to the difference between (WeekHi − WeekMidHi) and (WeekLo − WeekMidLo).
The following levels are calculated with the same interval. There is no special fundamental logic in these calculations, but they have been approved by many years of practice, and this is a serious argument.
ADR Indicator Settings: Customizing for Optimal Use
In most popular trading platforms, the ADR indicator is not included in the standard package, but its various versions can be freely found online.
Let’s consider the most popular and «visually» correct variant.
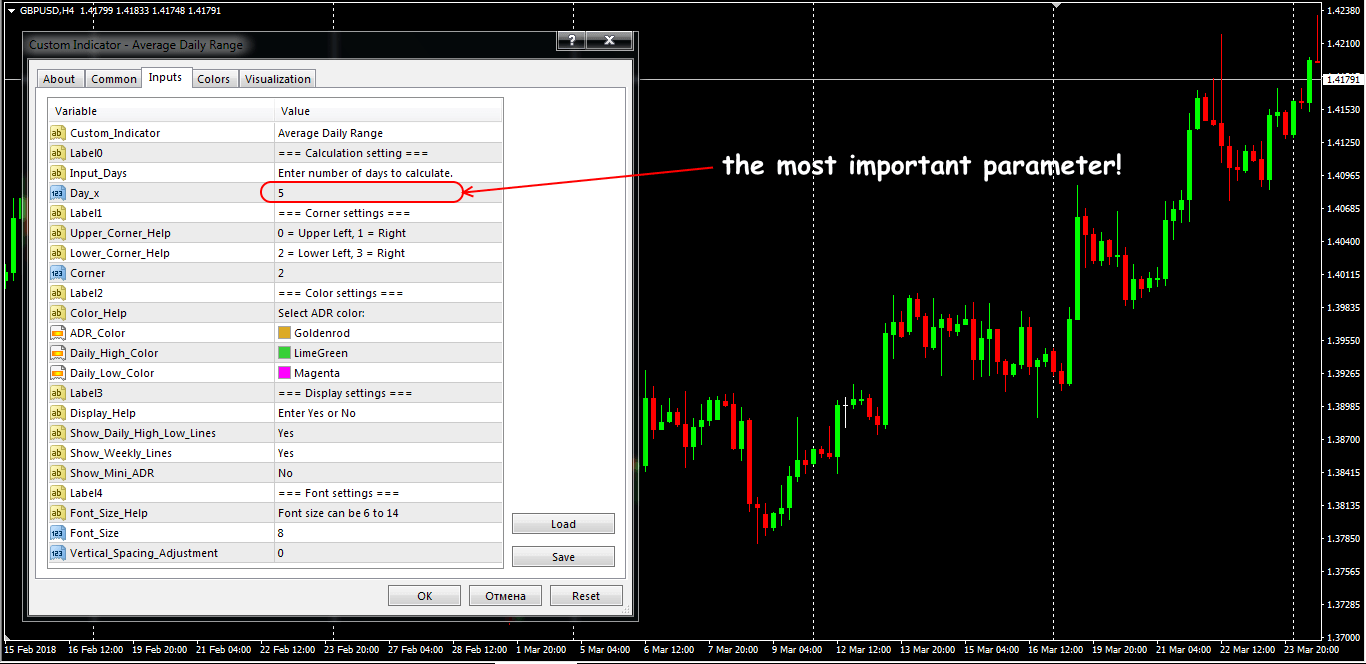
Standard version of the Average Daily Range indicator
Basic parameters of the ADR indicator:
- Day_x: the number of trading days for the calculation;
- Corner: location of the information window on the working screen (0 − upper left corner, 1 − upper right corner, 2 − bottom left corner, 3 − bottom right corner);
- ADR_color: the text color of the information window;
- Daily_High_Color: color of the Hi ADR mark;
- Daily_Low_Color: color of the Low ADR mark;
- Show_Daily_High_Low_lines: enables/disables the display of the boundaries of the High/Low day range («Yes» by default);
- Show_Weekly_Lines: enable/disables the display of the boundaries of the week range («Yes» by default);
- Show_Mini_ADR: minimization of the information window («No» by default);
- Font_Size: size (from 6 to 14) and Vertical_Spacing_Aquiment the line spacing for a font in the information window.
Actually, these settings do not influence the calculation mechanism. Settings for the visual display («Yes»/»No») are entered manually.
The result?
Basic levels of Average Daily Range
If it seems to you that the indicator’s levels «encumber» the price chart visually, then it is possible to disable the display of the lines, and keep only the information window.
In the information block, the results of calculation can be found (in price points):
- daily (see parameter Day_x);
- for the previous day;
- for the week;
- for the previous 6 months;
- High and Low prices of the current day;
- distance from the current price level to the current max/min;
- calculated values of the ADR indicator;
- distance from the current price to the calculated High/Low values of ADR.
How to apply all this in real trading − let’s look at it in detail.
How to Trade with ADR: Signals and Entry Strategies
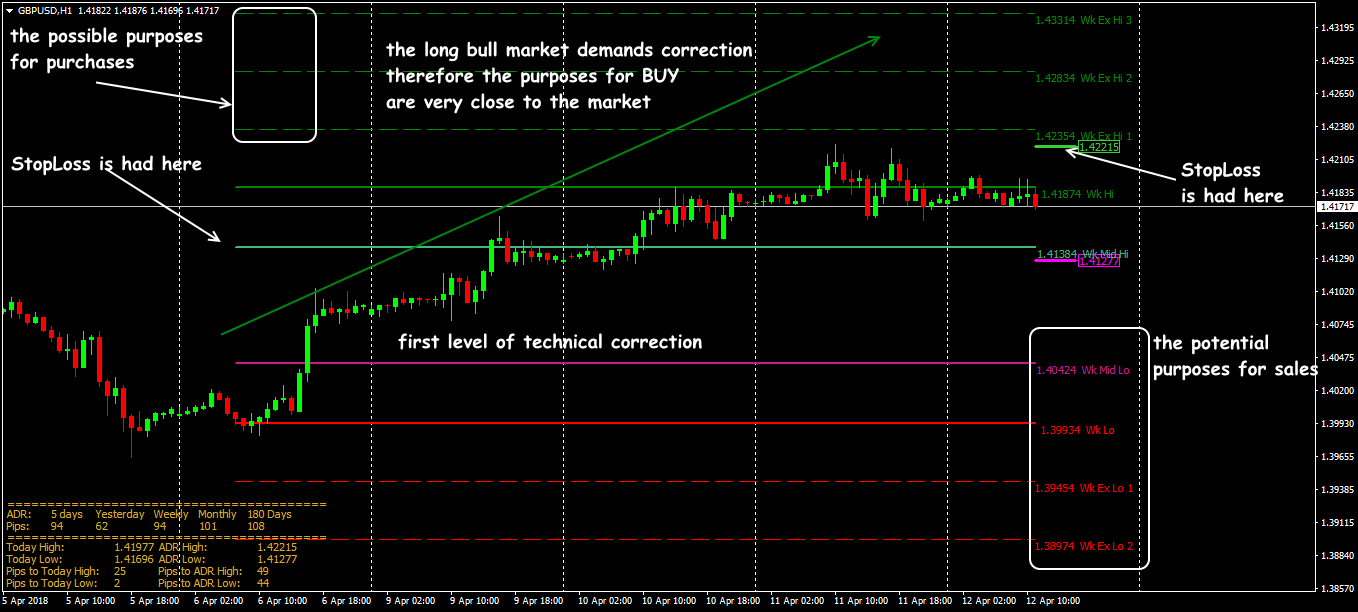
In practice, the ADR indicator doesn’t generate obvious signals for the entrance to the market; use of this tool comes down to restriction of the Take Profit size or to the Stop Loss adjustment.
All trade ideas are based on the ordinary logic of behavior in a zone of strong price levels: it is considered irrational to sell if the price is near the min range (capacity of the price movement is strongly limited). The similar rule works for the max value of the day range – probability of further growth is too small.
Reminder: The ADR range borders do not necessarily coincide with the Pivot levels! Breakdown on a trend (as a rule, with the subsequent rollback) and a reversal in the ADR area are equally possible events, from the point of statistics.
Practice shows that for the main currency assets, the H1-H4 period will be the most adequate. The ADR values can be used for more exact determination of the target levels in any strategy with a period of retention of the open trades that lasts from one day to one week.
Incorrect Average Daily Range levels
For the correct work on the ADR levels, a not speculative, rather predicted market is necessary. All such strategies use the effect of averaging and therefore they should be checked previously on the historical data.
Application in the ADR indicator trade strategies
There is no special and «super profitable» trade strategy for the ADR indicator – after all, it is an auxiliary technical tool (A Unique Way to Use ADR to Your Advantage).
Of course, it is easy to give advice, but from the point of view of the fundamental analysis, the Average Daily Range boundaries aren’t the accurate support/resistance levels. As a result, it isn’t recommended to trade in a reliance on the firm breakdown of these lines.
However, the use of ADR allows to calculate the size of a potential Take Profit/Stop Loss benefit, taking into account historical and current volatility of the asset. As an example, we will give a technique that is especially popular among scalpers.
Breakdown of the morning flat
Because of the fact that American and European exchanges are closed during the Asian («night») Forex session, market volumes are weak, and an active movement on the main currency pairs begins with the opening of trading floors in Europe.
It is the time when the volatility begins to increase. It defines the direction of movement, at least, till the middle of the European session or till the moment when the statistics on EUR, GBP, CHF appear.
Pending orders on the ADR range boundaries allow to take 10-12 (and even more) points of a profit.
However, modern analysts recommend «to catch» such a moment when the trading in the Chinese market is already closing, especially during the periods of expiration of the futures contracts or large options on the Asian stock exchanges.
In that case, the ADR indicator can be used as an additional filter while setting out the Asian session range, as well as for definition of the profit purposes, for example:
We place Take Profit several points above/below the ADR levels because it is a daily average range and the deviations in both sides are probable enough.
If the first pending order has fulfilled the minimum profit and the short-term consolidation begins, then it is possible to put the Limit-order to the opposite side («on the rollback») with the purposes in a zone of the second boundary of the ADR channel.
If any of the established pending orders hasn’t been opened within a trading day, then they need to be cancelled. The next day, it is recommended to put new positions taking into account parameters of closing of a day candle.
Reminder: we don’t put pending orders for the breakdown and we don’t enter the market at all if the current price is too close to the calculated borders of the ADR channel! We don’t buy near the top boundary and we don’t sell near the bottom boundary of the range.
Some practical tips
It is necessary to control the moments of the strong news and to correct your trading purposes taking into account the current trend (check How to Determine Average Daily Range Day Trading Futures video).
There are situations when the average daily range of 1-2 previous days strongly differs (lags behind or exceeds) a calculated value for the current period. In that case, you can hope that the market «will catch up» with an «ordinary» ADR value during several trading sessions.
Thanks to simple mathematics, the ADR indicator shows the most probable ranges and price reference points which is especially important for medium-term strategies. It can be used on any timeframe and any trade asset – it will be equally useful.
FAQ
How to set Stop Loss based on Average Daily Range?
First calculate the ADR by averaging the high-low range over 10-20 days. For conservative trades, place your stop loss at 50% of the ADR from your entry point. For moderate risk, use 75% of ADR. For aggressive trades, place it at 100-150% of ADR. Always consider market conditions—use wider stops in volatile markets and tighter ones in calm markets. This approach bases your risk management on actual market volatility rather than arbitrary price levels.
What is the difference between ADR and ATR?
ADR (Average Daily Range) measures the average high-low price range over a set period, focusing on intraday volatility without accounting for gaps between sessions. It’s ideal for setting daily profit targets. ATR (Average True Range) includes gaps (via prior closing prices) and calculates volatility across adjustable periods, offering broader market context. ATR is better for stop-loss placement and adapting strategies to changing volatility, while ADR suits intraday expectations. Both gauge volatility but differ in scope and application
How to read the Average Daily Range Indicator?
This indicator estimates price volatility by calculating the average distance between daily highs and lows over a specific period. To read it:
- Higher ADR values indicate increased volatility
- Lower values suggest consolidation phases
- Compare current ADR to historical averages to gauge relative volatility
- Use alongside other indicators for confirmation
- Adjust trading strategies based on ADR levels (wider stops during high ADR, tighter during low ADR)
ADR helps traders set realistic profit targets and stop-loss levels based on typical price movement.
How to calculate ADR in Forex?
The Average Daily Range in Forex is computed by finding the difference between each day’s high and low prices over a specific period, then averaging these values. First, subtract each day’s low from its high (High – Low = Daily Range). Next, sum all these daily ranges and divide by the number of periods. For example, with a 14-day ADR, add the daily ranges for the past 14 days and divide by 14. This helps traders gauge market volatility and set appropriate stop-loss and take-profit levels.
Forex Tester Online
Backtesting tool for refining and optimizing your ADR trading strategies
 ไทย
ไทย
 Tiếng Việt
 Polski
 Türkçe
 Nederlands
 Română
 한국어
한국어
 Svenska

