Breakout trading targets the moment price bursts out of a range. When support and resistance give way, momentum often follows. A solid breakout trading strategy uses clear rules, volume confirmation, and tight risk control. In this guide we explain what breakouts are, where they work, and how to trade entries, exits, and stops. You’ll learn proven setups, risk management, backtesting, and tools to filter false breakout signals.
What Is Breakout Trading?
Breakout trading is buying when price breaks above resistance or selling when price breaks below support. The idea is simple: when a range ends, a new move can start. A breakout trading strategy looks for that shift and rides the next leg.
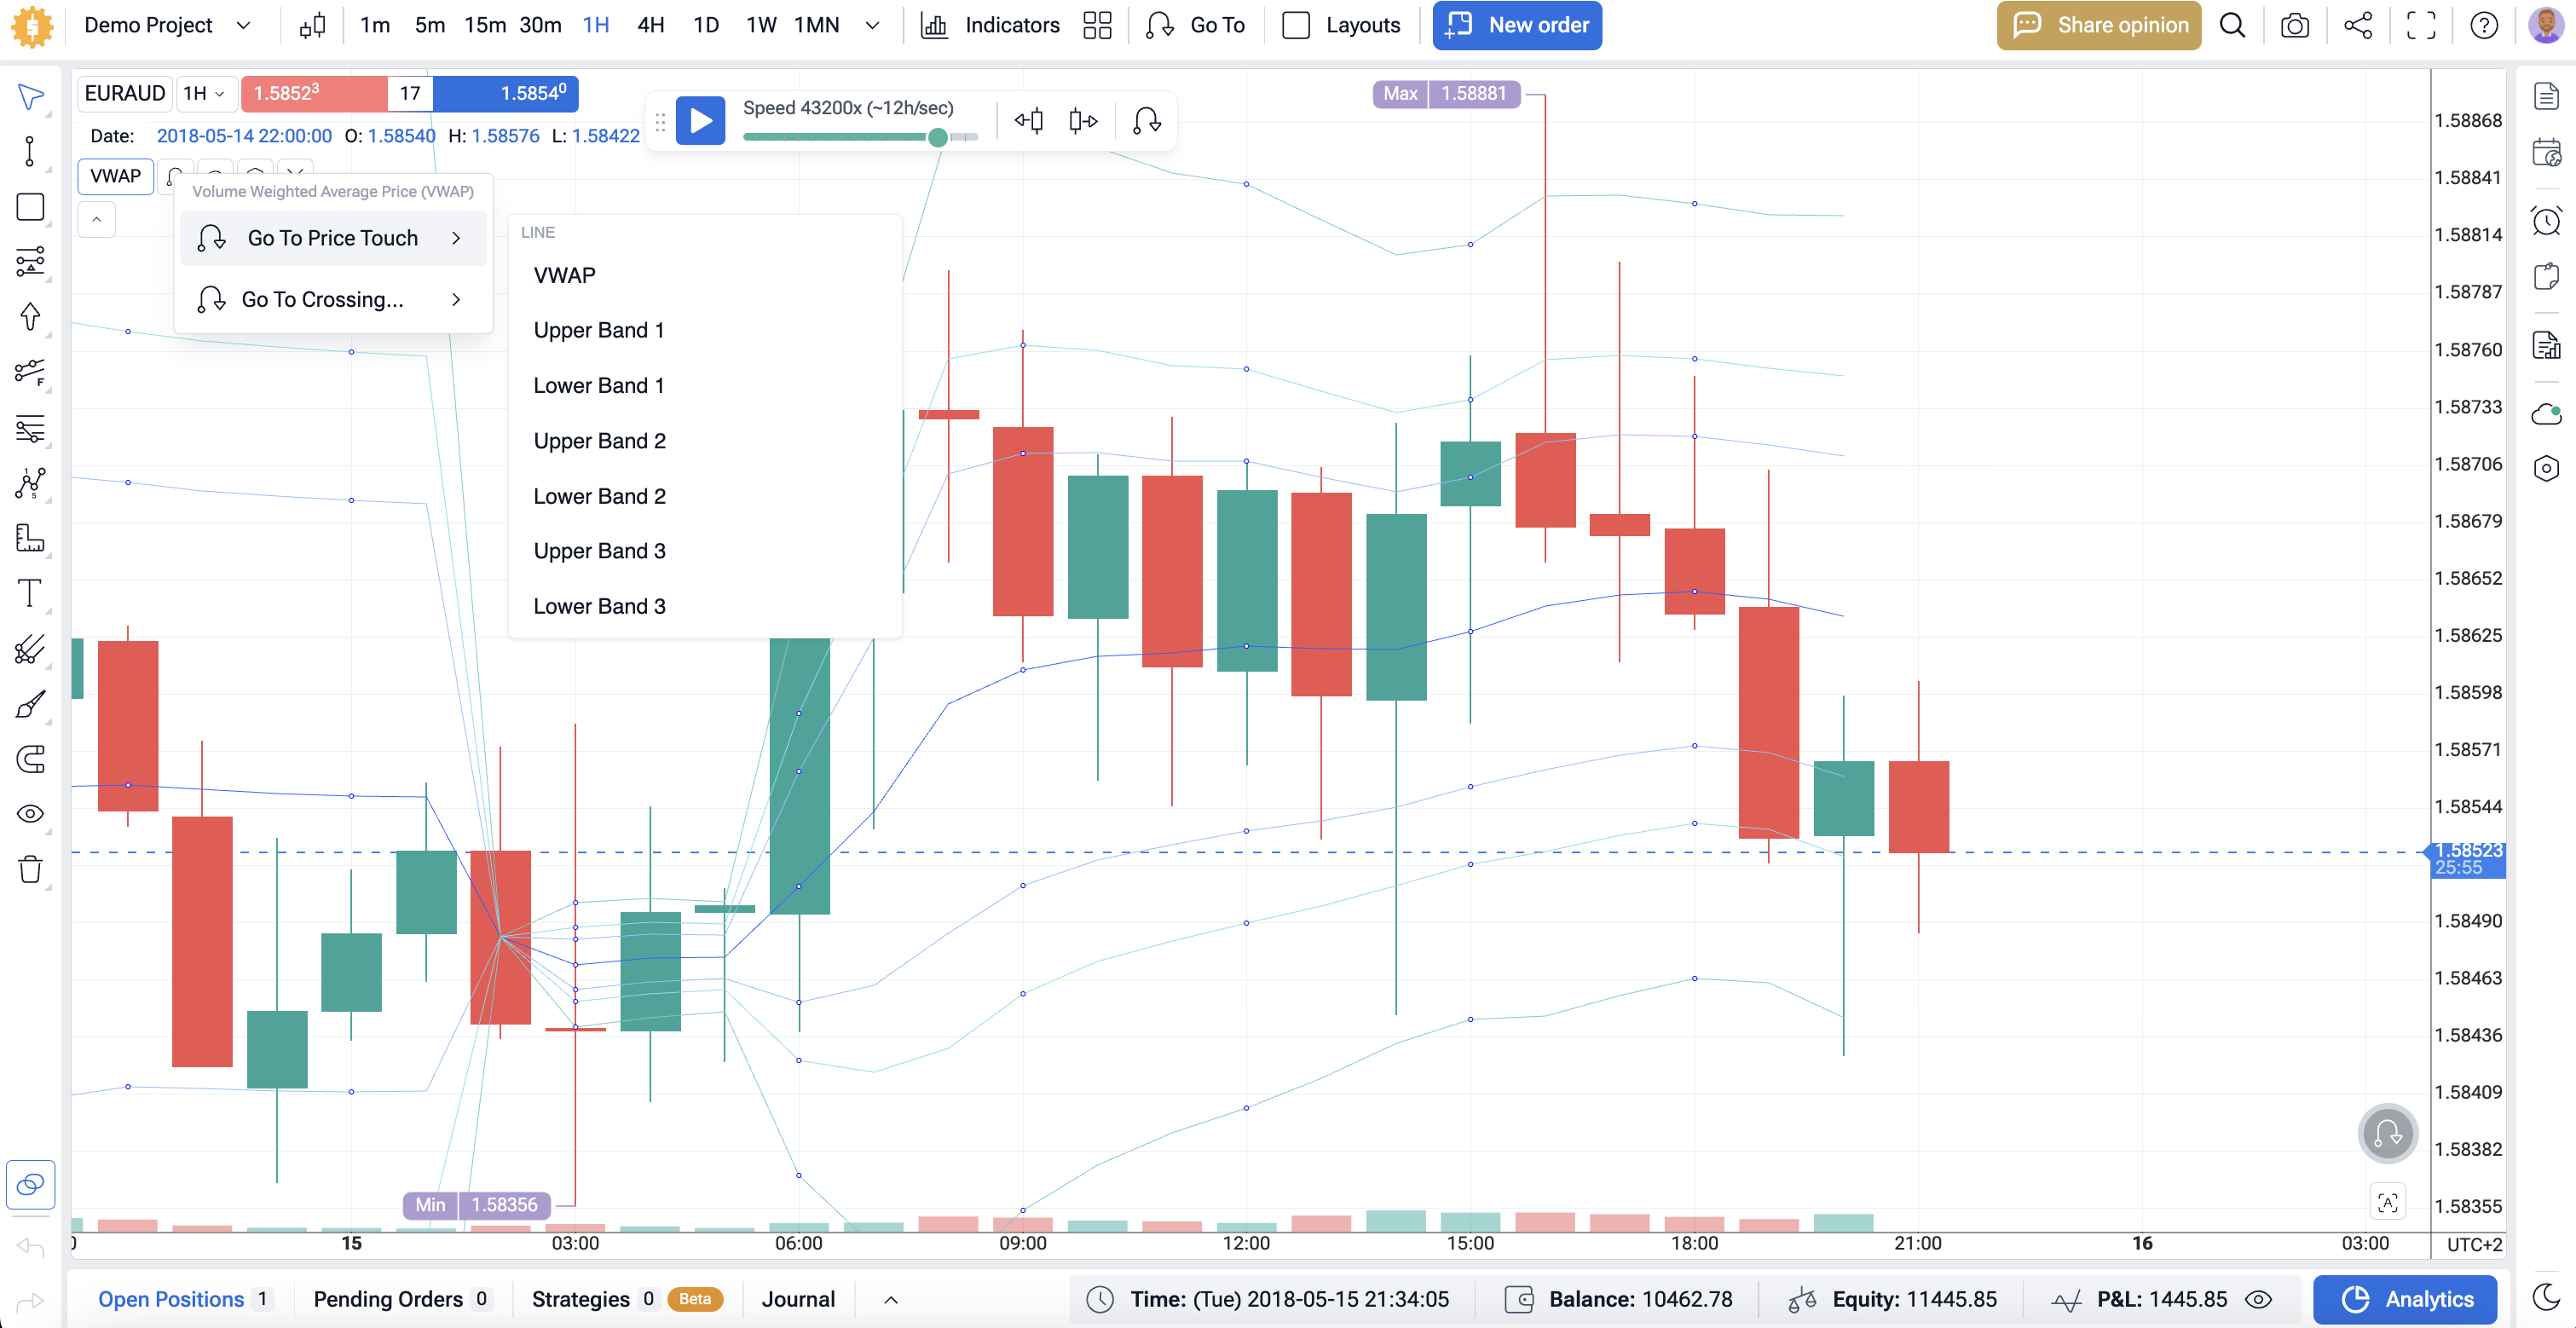
 Breakout on Forex Tester Online chart
Price breaks out of a defined box. That box can be a tight consolidation, a triangle, a flag, or a rectangle. An upside move is bullish; a downside move is bearish. False breakouts (fakeouts) happen when price pokes past the level and snaps back. We reduce that risk with volume confirmation and clean rules.
This style fits many markets. Stocks, forex, crypto, and commodities all form ranges and then move. It also works across timeframes. Day traders use 1-15 minute charts. Swing traders use 1-4 hour or daily charts.
Under the surface it’s about supply and demand. Above resistance, trapped shorts buy back and new buyers join. Below support, trapped longs exit and new sellers push. This order flow can create fast momentum. That is why breakout trading ties well with momentum trading strategies and volatility breakouts.
So, this is pretty simple. It is a good strategy to start with. And when you master and backtest it, you can move on to something more complicated, for example:
Want more details? Keep reading.
Why Can Breakouts Be Considered Reliable?
Breakouts work when supply and demand shift fast. A clean level breaks, orders flood in, and price runs. Here’s what we look for.
- Clear support and resistance. Mark the range highs and lows, trendlines, or a tight triangle. The sharper the boundary, the better the signal.
- Volume confirmation. A real move needs fuel. On the break, volume should expand versus its recent average. Rising volume confirmation cuts false breakouts.
- Volatility expansion. Before big moves, volatility often contracts (small candles, narrow ranges). The surge after a squeeze signals momentum and improves odds.
- Structure matters. Flags, rectangles, and ascending/descending triangles show pressure building. A break in the pattern’s direction often follows through.
- Timeframe alignment. A 5-minute break is stronger if the 1-hour trend points the same way. Multi-timeframe confluence reduces noise.
- Filter fakeouts. Wait for a candle close beyond the level, not just a wick. Add a retest rule: if price breaks, pulls back to the level, and holds, it’s stronger.
- Context first. Check news, session opens, and overall market trend. A breakout with the higher-timeframe bias beats one against it.
Use these checks together. They turn a simple line break into a higher-probability breakout trading strategy. Now we will tell you more details about some specific strategies.
Breakout Trading Strategies List
Breakout trading thrives on simple rules and strict risk. Below are core breakout trade setups you can test and use across stocks, forex, and crypto.
Opening Range Breakout (ORB)
To follow the ORB strategy, trade the first range of the session. Mark the 5-30-minute high/low. Go long on a close above the high with volume confirmation; short on a close below the low. Stop loss placement just inside the range. First target = 1R-2R, or the next support and resistance. Filter news spikes.
Momentum Breakout
Price rips after news or a catalyst. Enter on the first pullback that holds above the breakout level. Use RSI/MACD to confirm momentum. Tight stops below the retest wick. Quick exits. This is pure breakout momentum trading. Speed matters.
Support and Resistance Breakout
Draw key horizontal levels. Wait for a decisive close through the line and a clean retest that flips resistance to support (or support to resistance). Add volume and volatility analysis to avoid false breakout signals. Scale out into the next level.
Also read: How to find support/resistance levels correctly
Trendline Breakout
Connect higher lows (uptrend) or lower highs (downtrend). Trade the break of the line with a close and rising volume. Entry and exit points are simple: in on the break, out on a close back inside or at the next structure. ATR helps set distance for stops.

Volatility Breakout (Squeeze)
Use a squeeze tool (e.g., Bollinger Band width or Keltner vs Bands). Low volatility contracts, then expands. Enter on the expansion bar that closes outside the range. Place stops one ATR inside the base. Trail with an ATR or parabolic SAR to capture runs.
Breakout with Volume Confirmation
Same as your base setup, but only take trades when volume is ≥120% of its 20-bar average. This single filter improves breakout confirmation signals. If volume fades on the retest, stand down.
Breakout Gap Trading
Price gaps through a breakout pattern at the open. Enter after the first tight consolidation holds above/below the gap. Stop under the consolidation low. Target the measured move of the prior base. Watch spreads and slippage at the open.
Breakout from Consolidation
Rectangles, triangles, and flags are classic breakout patterns. Trade the close beyond the boundary plus a retest. Stop loss placement just back inside the box or pattern. Targets = pattern height projected from the break.

Fibonacci Breakout
Map a swing with Fibonacci. Breaks through 61.8% often run to the prior high/low. Enter on the candle close beyond 61.8% with volume. Stops behind the level. Take profit at 100% and 127.2% extensions.
Technical Indicators and Confirmation Tools
Keep it tight. You don’t need many tools for a solid breakout trading strategy. Use these four.
1) Volume (must-have)
Real breakouts come with volume confirmation.
Rule: trade the break only if volume is ≥ 120% of the 20-bar average.
2) Support and resistance
Mark clean levels first. Wait for a close beyond the line.
Better: a quick retest that holds (old resistance turns to support, or vice versa).
3) Trend filter (pick one)
- Moving averages: 20-EMA above 50-EMA for longs; below for shorts.
- VWAP (intraday): above VWAP favors longs; below favors shorts.
4) ATR (risk tool)
Set stop loss placement at 1-1.5 × ATR beyond the breakout or retest.
Set targets at 1-2R or trail by 1 × ATR.
Simple checklist
Level set → candle closes through it → volume confirmation → trend filter agrees → ATR stop set.
That’s it. Clean, repeatable, and built for managing risk in breakout trading.

Backtest it on Forex Tester Online before launching this strategy live. This will save you a lot of money.
Entry, Exit, and Risk Management in Breakout Trading
Breakout trading starts with clear entry and exit points and strict risk management in trading. Keep the rules simple and repeatable.
Entry: when to take the trade
Trade only clean support and resistance breaks. Wait for a candle close beyond the level, not just a wick. Add volume confirmation (for example, ≥120% of the 20-bar average). Two common entries:
- Breakout close: enter at the bar close through the level. Fast, but more slippage.
- Retest entry: after the break, wait for price to dip back to the level. If it holds, enter. Tighter risk and fewer false breakout signals.
Use a trend filter. Longs when the 20-EMA is above the 50-EMA (or above VWAP intraday). Shorts when the opposite holds. If the filter disagrees, skip.
Stop loss placement
Place stops where the setup is proven wrong, not where it “feels” right.
- Structure stop: just beyond the breakout level after a retest (old resistance becomes support; old support becomes resistance).
- ATR stop: 1-1.5 × ATR beyond the level or swing. This adapts to volatility.
Do not set the stop inside the range you just broke. That gets hit by noise.
Targets and exits
Pick targets before you click buy.
- Measured move: use the height of the range/pattern and project it beyond the breakout.
- R-multiple: aim for at least 1.5R-2R on first take-profit.
- Trail: after partial profit, trail a stop by 1 × ATR or under/over higher lows/higher highs.
If volume fades and price stalls near the level, take some off. If a false breakout forms (fast close back inside the range), exit and reassess.
Position sizing and risk control
Risk a fixed fraction of equity (for example, 0.5-1% per trade). Size = account risk ÷ stop distance. Reduce size in thin markets or before news. Log slippage; wide spreads can erase the edge.
Three practical trade plans
1) Breakout close plan (momentum)
- Entry: close above resistance with volume confirmation.
- Stop loss placement: 1.5 × ATR below the level.
- Exit: 50% at 1.5R, trail the rest by 1 × ATR.
2) Retest plan (conservative)
- Entry: price breaks, pulls back, holds the level, prints a small bullish/bearish candle.
- Stop loss placement: a few ticks beyond the retest low/high or 1 × ATR.
- Exit: first target = range height; then trail under/over swing structure.
3) News momentum breakout (fast tape)
- Entry: first clean close through the level after the spike, only with heavy volume.
- Stop loss placement: ATR-based, never inside the candle that triggered the break.
- Exit: scale quickly (1-1.5R), then trail tight; these moves fade fast.
Filters to avoid weak breaks
Trade in the direction of the higher-timeframe trend. Skip breaks into nearby higher-timeframe levels. Avoid breaks on low volume or during illiquid hours. If ATR is exploding and candles are erratic, stand down or cut size.
Backtest Breakouts in Forex Tester Online
Breakout trading rewards rules and repetition. Forex Tester Online backtesting platform lets you practice entries, exits, and risk management in trading on real historical data – with no capital at risk. We are traders ourselves, and we designed it for us, and for you.
Why use FTO for breakout trading?
✅ 20+ years of tick-level data (forex, crypto, stocks, indices)
✅ Floating spreads, commissions, and slippage simulation
✅ Tick-by-tick playback for clean support and resistance tests
✅ Easy drawing tools for levels, trendlines, and ranges
✅ Pending orders for stop entries above/below the level
✅ Built-in stats: win rate, R-multiple, drawdown, equity curve
✅ Mystery Mode to hide symbol/timeframe and kill bias
✅ “Jump To” any date/session; integrated news marks
✅ Export trades to CSV for volume and volatility analysis
✅ Ready-to-use scenarios to simulate outstanding market events
Learn more about Forex Tester Online here
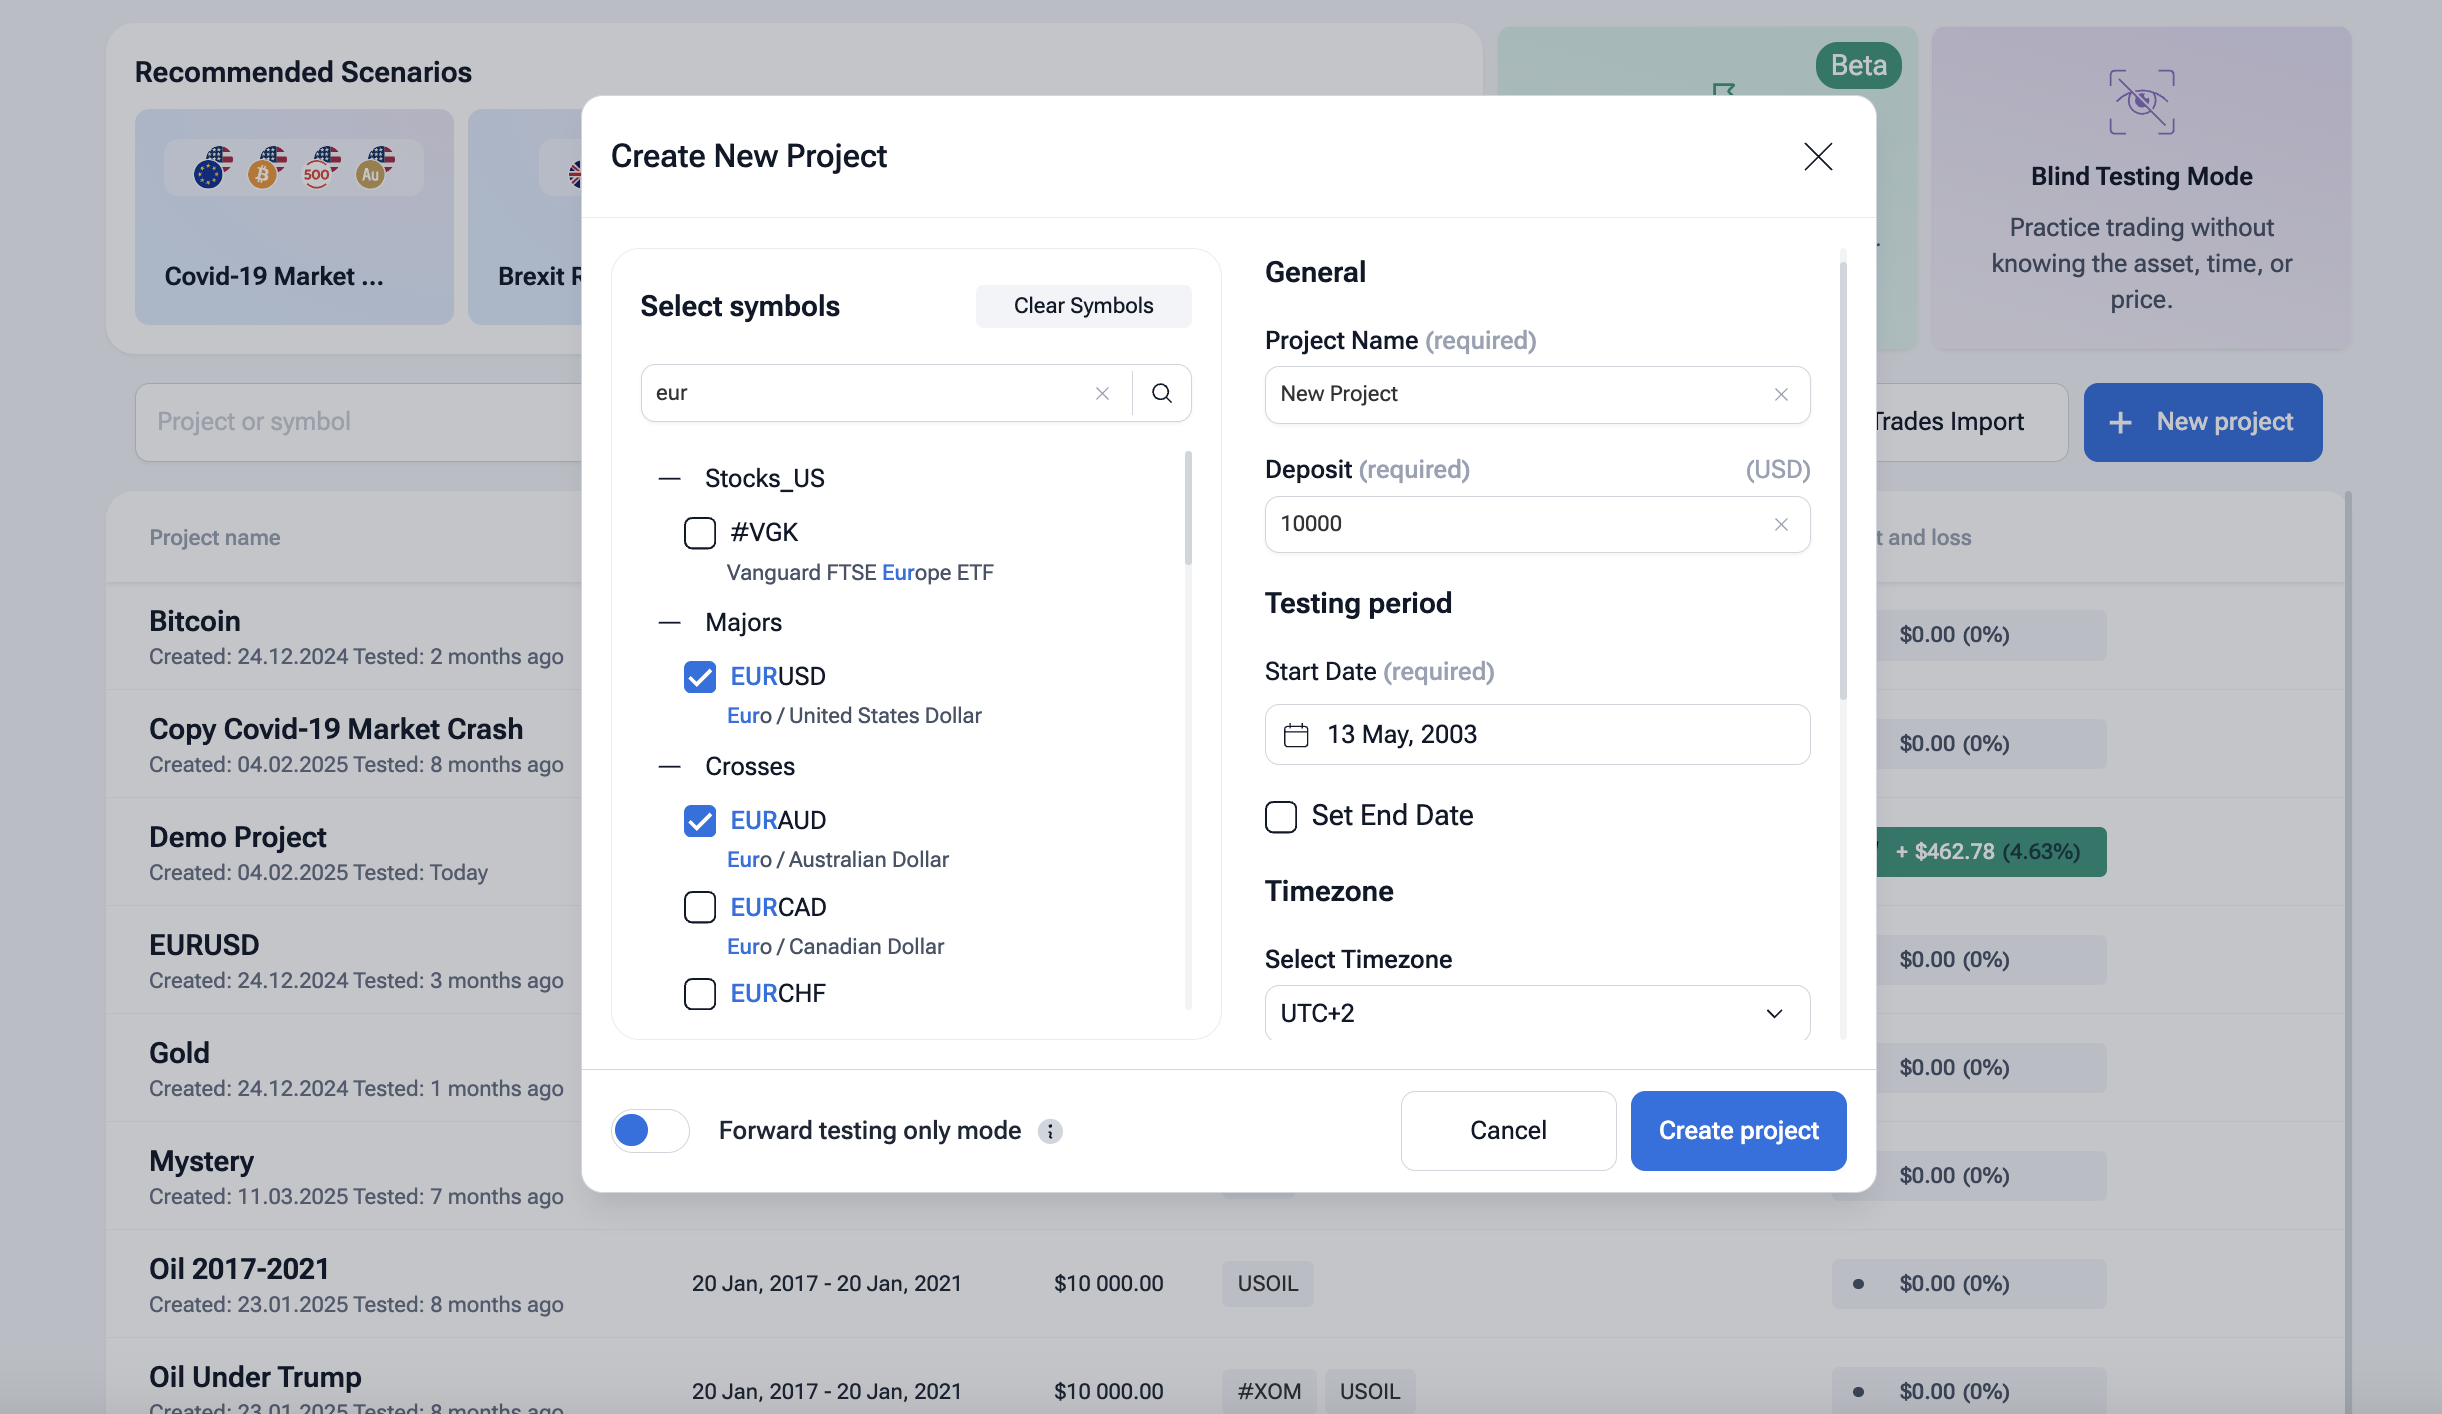
Mini-Guide: Backtesting a Breakout Trading Strategy via FTO
Step 1 – Get access
Go to the FTO site, click Get Started, pick a plan, create your account, and sign in.
Step 2 – Create a project
Click + New Project. Name it “Breakout Test”.
Select symbols (e.g., EURUSD, NAS100, BTCUSD).
Choose start/end dates (aim for 5-10+ years).
Set virtual deposit, spread, commission, and slippage.

Press Play to load charts.
Step 3 – Set up your chart
Add key tools: Volume, ATR(14), 20/50 EMA (optional filter), and VWAP for intraday tests.
Draw support and resistance lines, mark consolidation ranges, and save the layout as a template.
Step 4 – Define your rules (write them in a note on the chart)
- Entry: candle close beyond the level with volume confirmation (≥120% of 20-bar avg), or use a retest entry.
- Stop loss: structure stop a few ticks beyond the level, or 1-1.5 × ATR.
- Targets: measured move (range height), or 1.5R-2R first take-profit, then trail by 1 × ATR.
Keep rules fixed during a run. No mid-test tweaks.
Step 5 – Replay and place trades
Press Play and control speed with the slider.
Place stop orders just outside the range, or click New Order at the confirmation bar close.

Use Jump To to move across sessions (e.g., London or New York open).
Tag each trade (breakout close / retest / news momentum).
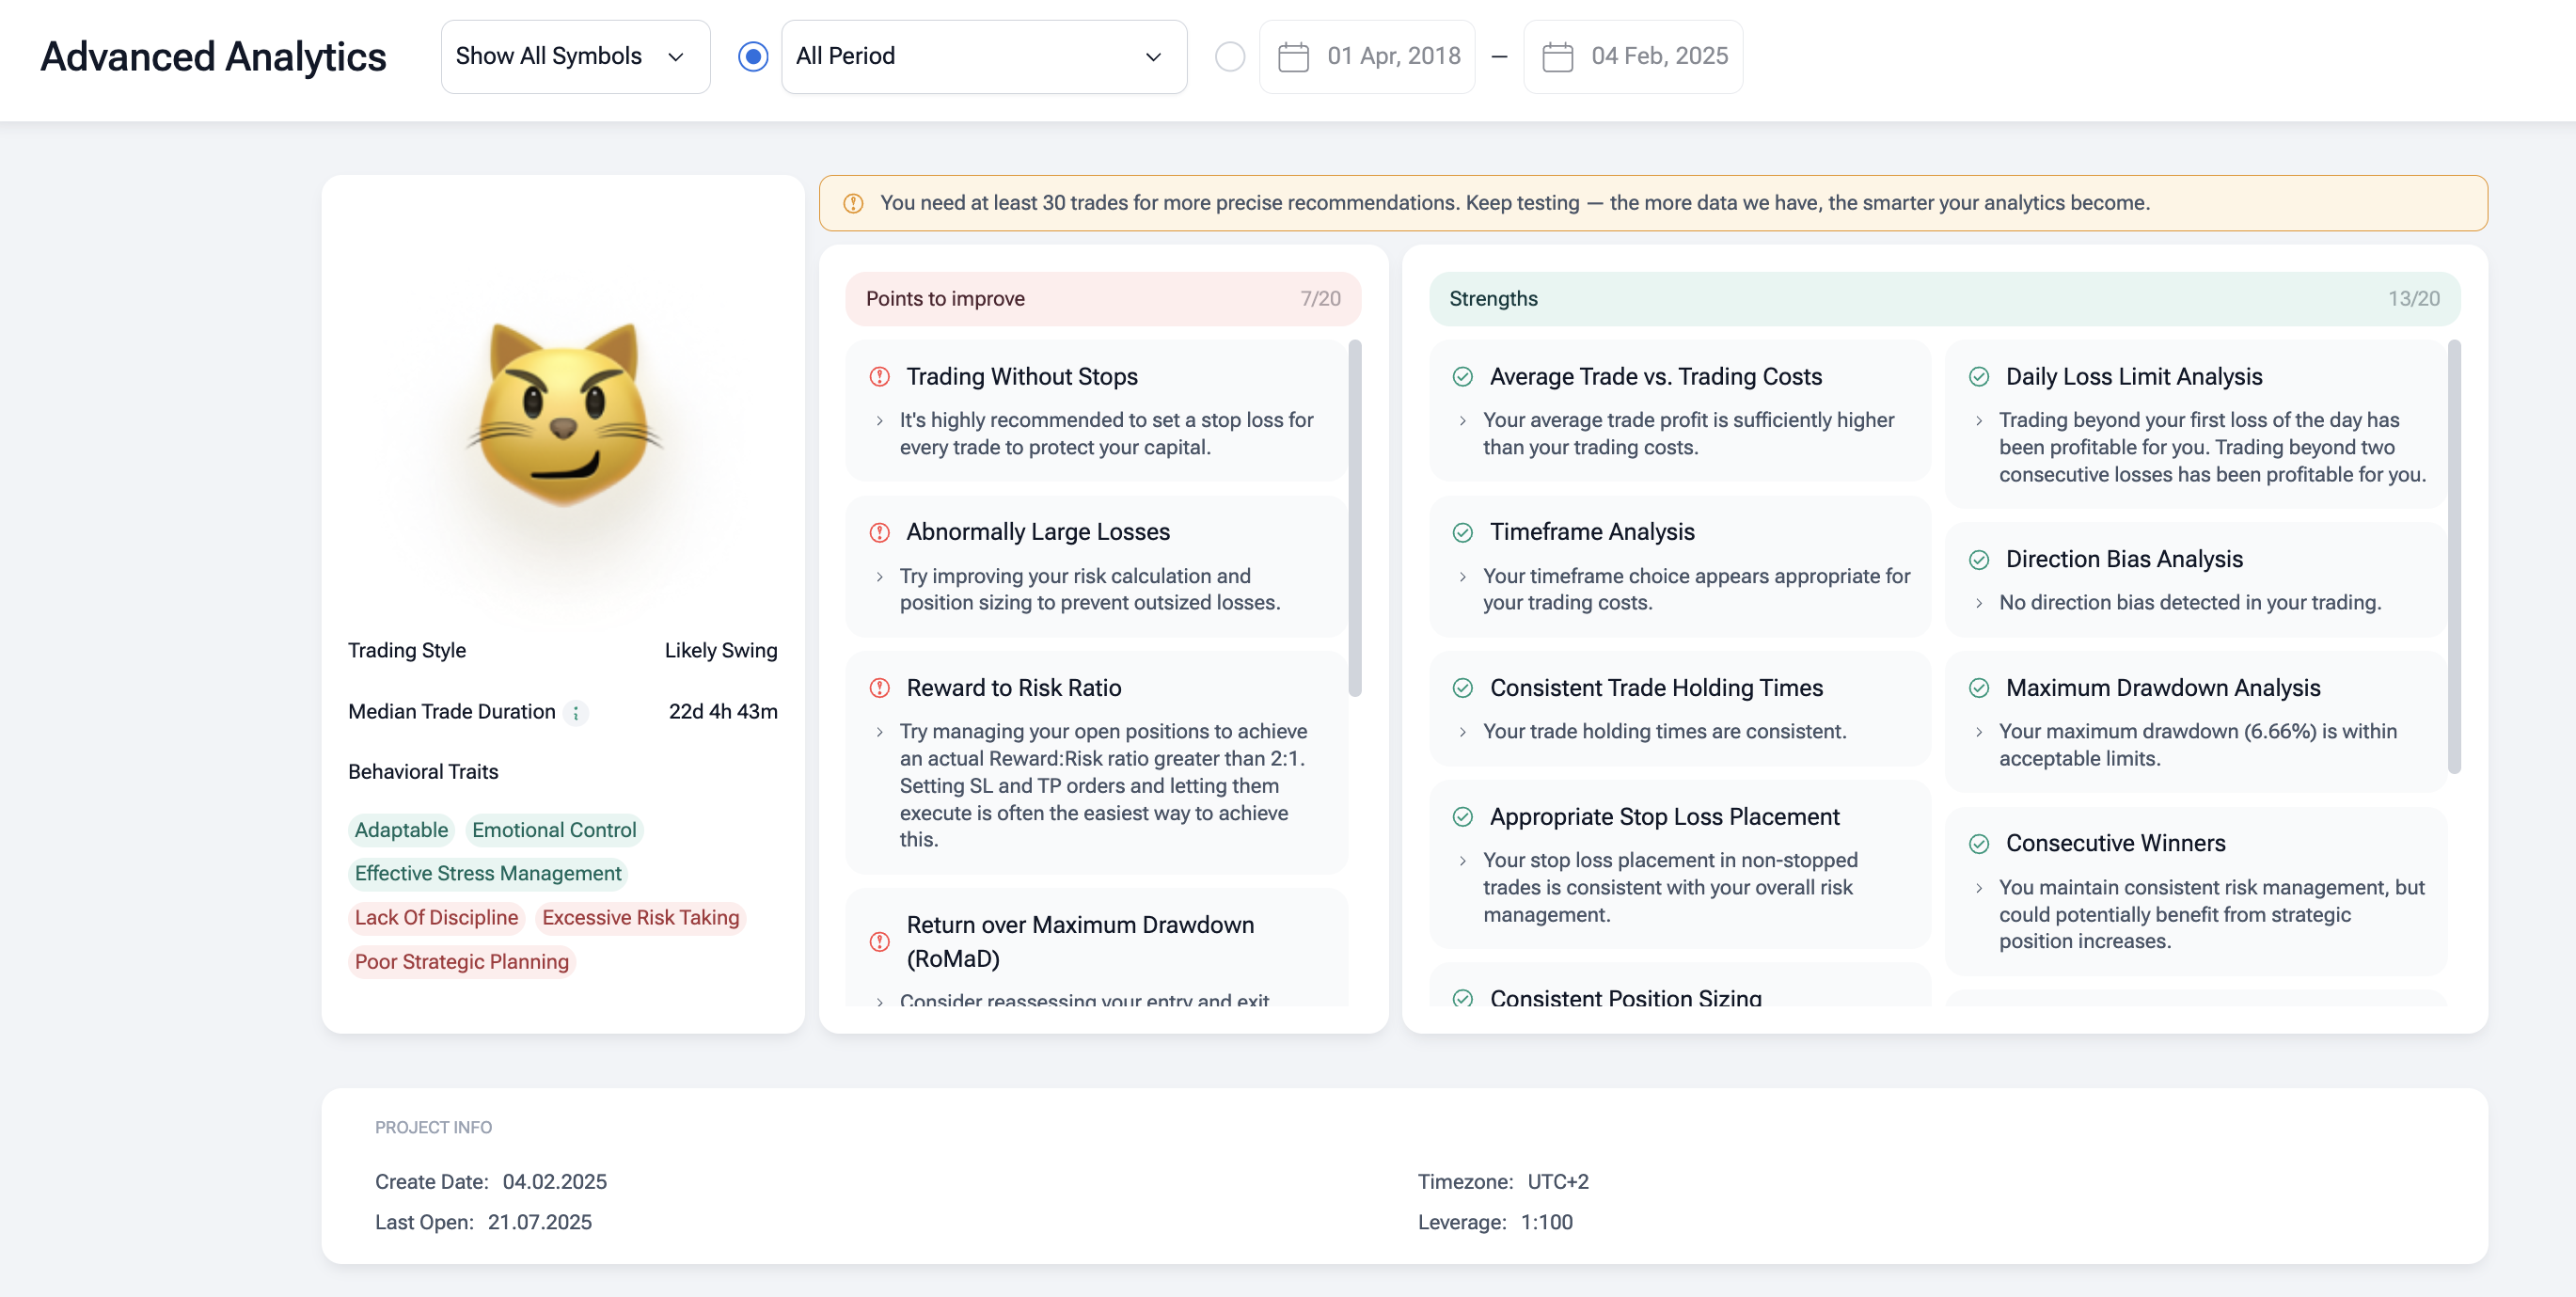
Step 6 – Review analytics
Open Analytics. Note win rate, average R, max drawdown, time-in-trade, and slippage.

Export to CSV. Compare results with vs without volume confirmation.
Step 7 – Iterate and validate
Change one input at a time: range size filter, ATR stop, volume threshold, retest rule.
Run walk-forward (different years).
Keep settings that hold up across symbols and regimes.
Save it and use it on every new test.
Avoiding False Breakouts
False breakout signals are common. Keep it tight:
- Wait for confirmation. Trade the candle close beyond support and resistance, not the first tick.
- Check volume confirmation. Breakouts without rising volume often fail.
- Use a retest. Enter on a clean retest of the level that holds.
- Filter with ATR. Skip tiny moves in low volatility; avoid chasing huge spikes.
- Mind the news. High-impact releases create fake moves.
- Risk small. Tight stops and fixed risk per trade keep risk management in trading intact.
Conclusion
Breakout is easy enough for beginners. You don’t even need technical analysis skills to master it. The strategy works when you read price, wait for clean breakout confirmation signals, and respect risk management in trading.
Use this breakout trading guide to plan clear entry and exit points, define stop loss placement, and confirm each move with volume confirmation and basic volume and volatility analysis. Stick to obvious support and resistance, trade only valid breakout pattern setups, and avoid common breakout failure reasons like thin volume or news spikes. Backtest every strategy on FTO before you go live. And good luck!
Disclaimer
Trading involves risk. The indicators in this article are for educational purposes only and are not financial advice. Past performance does not guarantee future results. Always test strategies before using real money.
FAQ
How reliable is a breakout trading strategy in different markets?
Reliability rises when breakouts occur at clear support and resistance with strong volume confirmation. Stocks, forex, and crypto all work, but context matters. Quiet sessions and random spikes create false breakout signals – filter with ATR and wait for a candle to close.
What are the best entry and exit points for breakouts?
Enter on a confirmed close beyond the level or on a successful retest. First exit near the next structure level; trail the rest. Define stop loss placement just back inside the range or 1-2 ATR from entry to control risk.
Which technical indicators for breakouts help reduce fakeouts?
We recommend to keep it simple: volume, VWAP or a moving average for trend bias, RSI/MACD for momentum. Use ATR to judge volatility breakout quality. Combine two confirmations at most to avoid signal clutter.
What causes most breakout failure reasons?
Thin volume, breakouts against the higher-timeframe trend, major news, and levels that were not real supply/demand. Price pattern recognition helps – trade breaks from well-defined ranges, triangles, or flags, not random lines.
Can I use momentum trading strategies with breakouts?
Yes. Breakout momentum trading targets fast follow-through after the level breaks. Look for rising volume, expanding range, and a quick push away from the level. Scale out into strength and trail stops as volatility expands.
How should I handle risk management in trading for breakouts?
Risk a fixed fraction per trade, predefine stop loss placement, and honor it. If volume fades or the retest fails, exit. Journal each trade with volume and volatility analysis to refine rules over time.
Forex Tester Online
Backtest your breakout trading strategy using FTO
 ไทย
ไทย
 Tiếng Việt
 Polski
 Türkçe
 Nederlands
 Română
 한국어
한국어
 Svenska


