Summarize at:
The suggested variant under the strange name “BullDozer” was actively advertised on one of the online resources as a medium-term “Grail” for the major currency pairs, so we decided to check it out.
BullDozer strategy description
It is assumed that we trade highly liquid currency pairs with a stable trend, at least at a distance of several weeks.
We will need:
- Moving averages for assessing the trend: red EMA (21; close) and blue EMA (70; close).
- Awesome Oscillator with standard parameters — to specify the entry point.
TF for analysis and support of open trades is H1 (you can take H4 for more active pairs), Stop Loss is at 30-50 points from the opening price, Take Profit is recommended to be at least 200 points, but usually trailing is used, and the deal is closed by Stop Loss or according to usual money management.
You can use Graphic Tools in FT/FTO to control the entry point.
So, to open a deal:
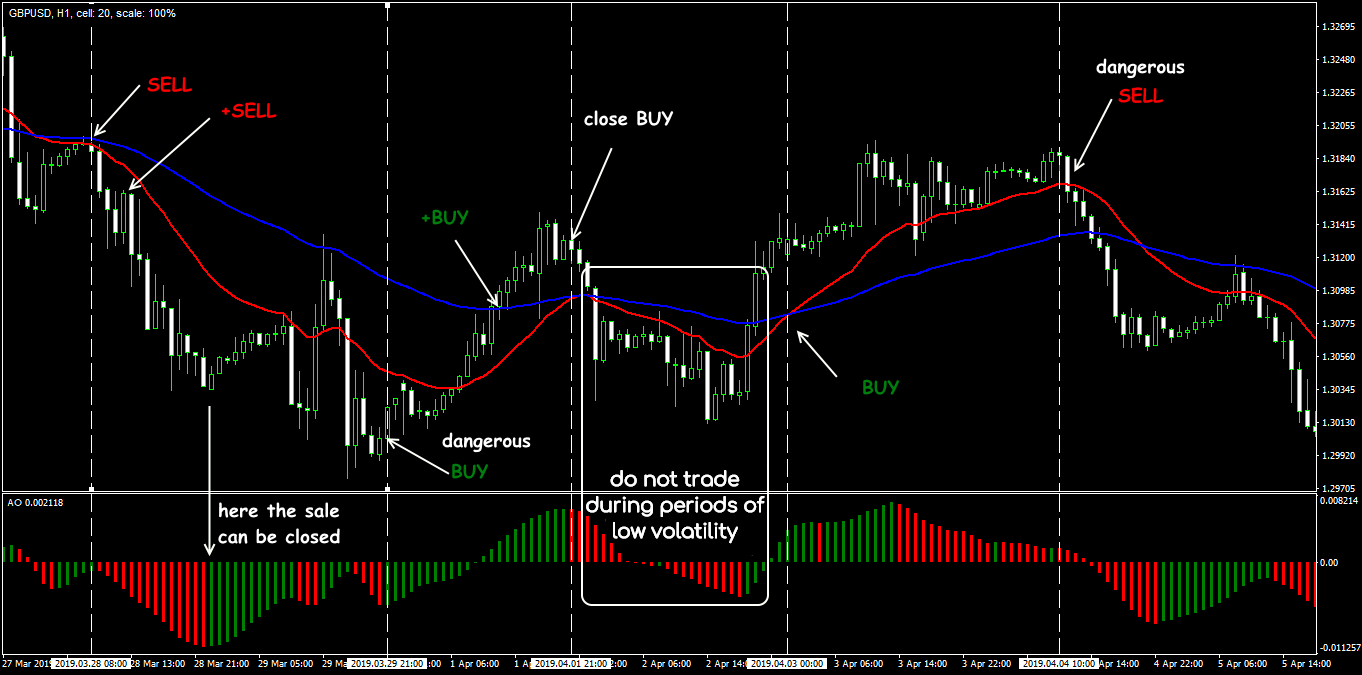
- BUY: the price closes above the EMA (70), EMA (21) is above the EMA (70); the AO histogram is green with an upward trend.
- SELL: the Close price is below EMA (70), EMA (21) is below EMA (70); AO is red and declining.
Entry is performed on the next bar after all conditions are met.
Exit or reverse — by Stop Loss or when the AO histogram crosses the zero line. On a strong trend, you can close part of the volume if the price goes 50-70 points in profit.
Please note that it was possible to open trades before the fast average crosses the slow one, provided that the histogram is already of the corresponding color.
It means that the short-term trend has already reversed, but the long-term trend has not yet had time to react. That is, the condition of the mutual crossing of movings for entry is not necessary, or rather, uncritical: the main thing is that the fast average turns in the right direction.
In the diagram, such points are shown as “dangerous entry” — these transactions are riskier, but part of the profitable trend is not lost. However, even though such points are clearly visible in history, they may turn out to be a false signal in real life.
For an automatic test, we tighten the conditions and take only a part of the profit (after the intersection point) for more reliability.
Creating a strategy file in Easy Forex Builder
Create a EFB template with public access so that you can make variants of the strategy with different parameters on its basis.
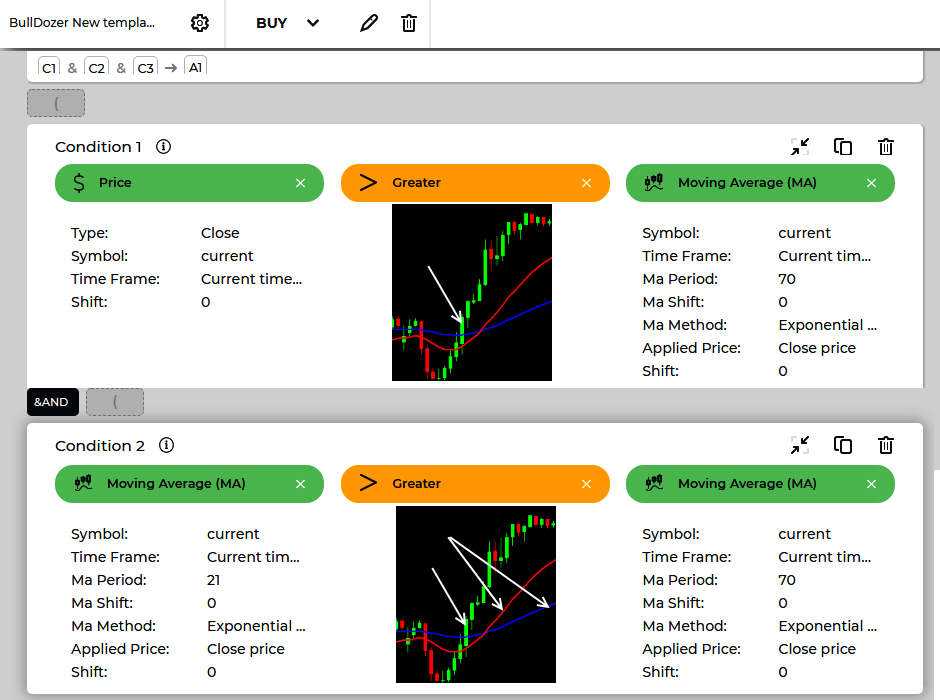
Scheme for buying:
- Closing price is above EMA (21).
- Location of the fast average above the slow one.
Approximately as shown in the diagrams:
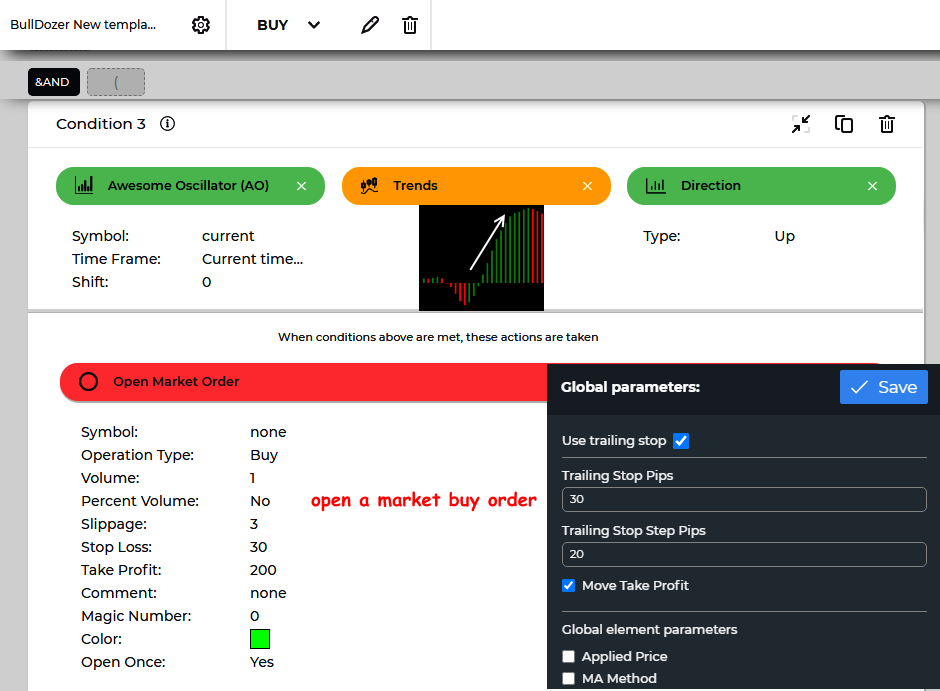
We check the third condition — the trend is on the Awesome Oscillator histogram.
If all conditions are met, we will open a Buy order.
Using the reverse rule method, describe the conditions for a SELL order as it’s shown in the diagram:
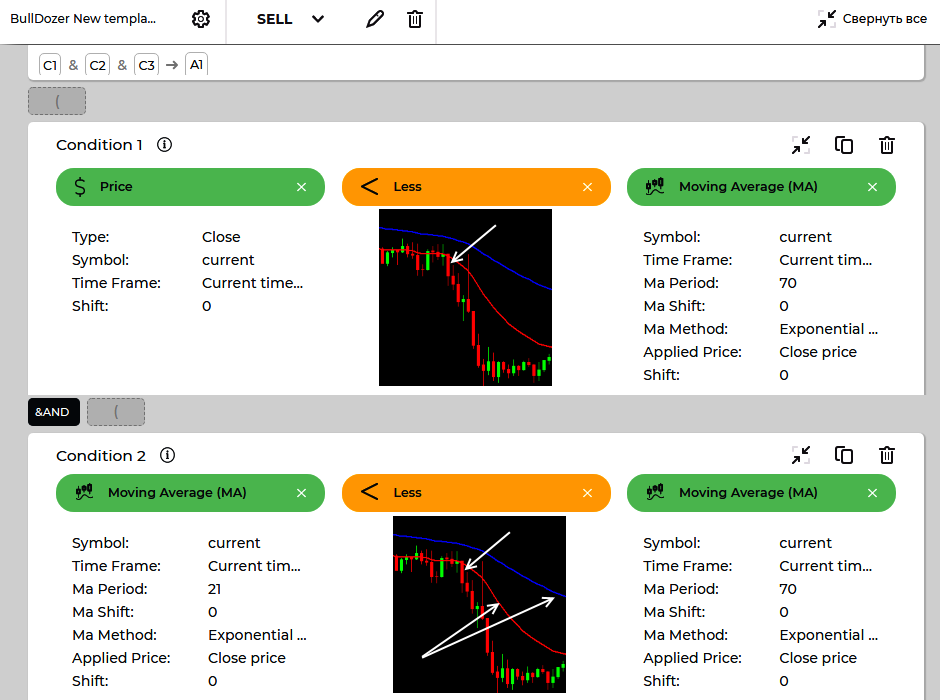
We check the trend on the histogram and open a Sell order:
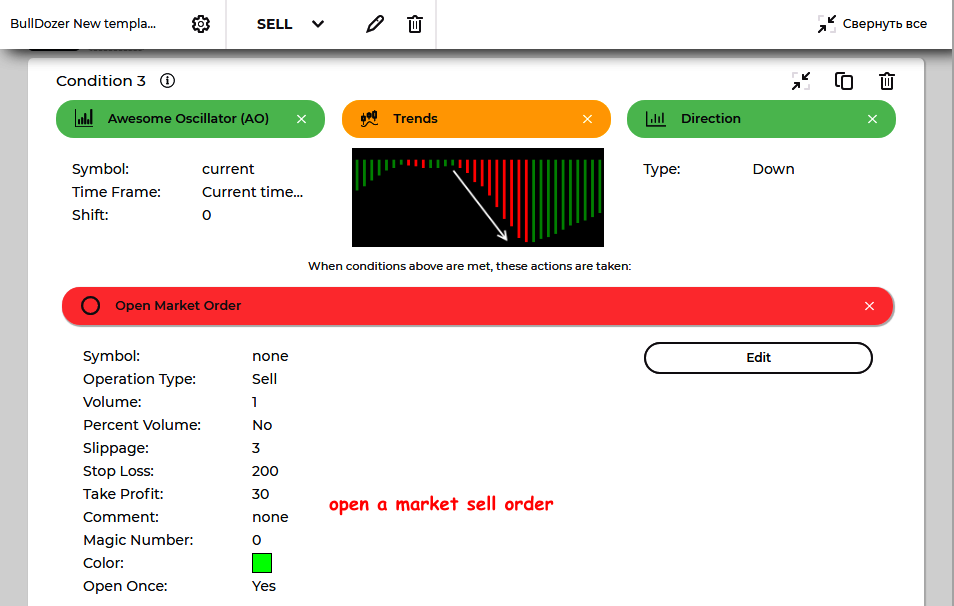
Use fixed Take Profit / Stop Loss, and a trailing of 30 points with a step of 20 points. Enter with a standard lot. Do not use Martingale and other risky tactics.
Don’t forget to save the project.
A quick strategy test in EFB
Conduct a quick test directly in the EFB environment on the offered currency pairs. Let’s select three months from the beginning of the current year and compare the results.
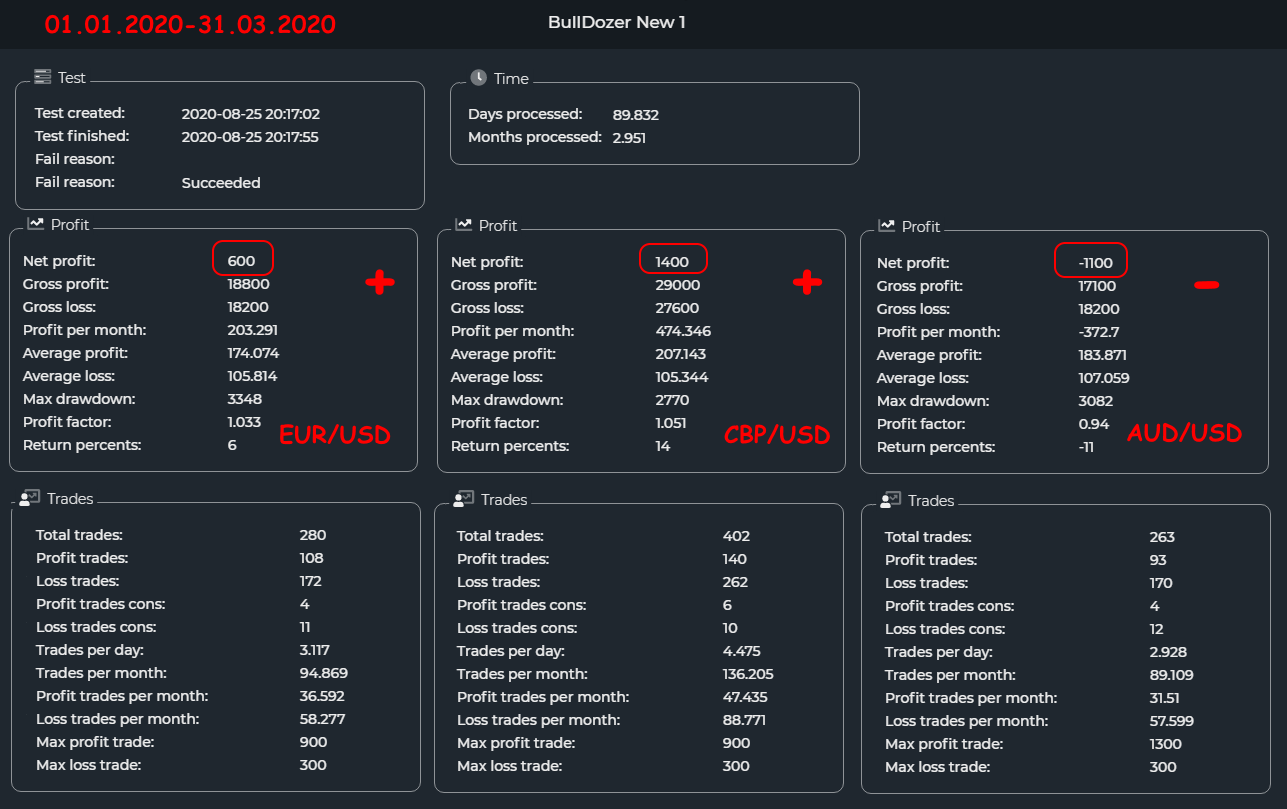
It’s nice that the two major pairs (EUR/USD and GBP/USD) are profitable, and with a very loyal drawdown, but still, the income is below expectations, the profit factor is weak. The Australian finishes in an uncritical minus. Let’s look further.
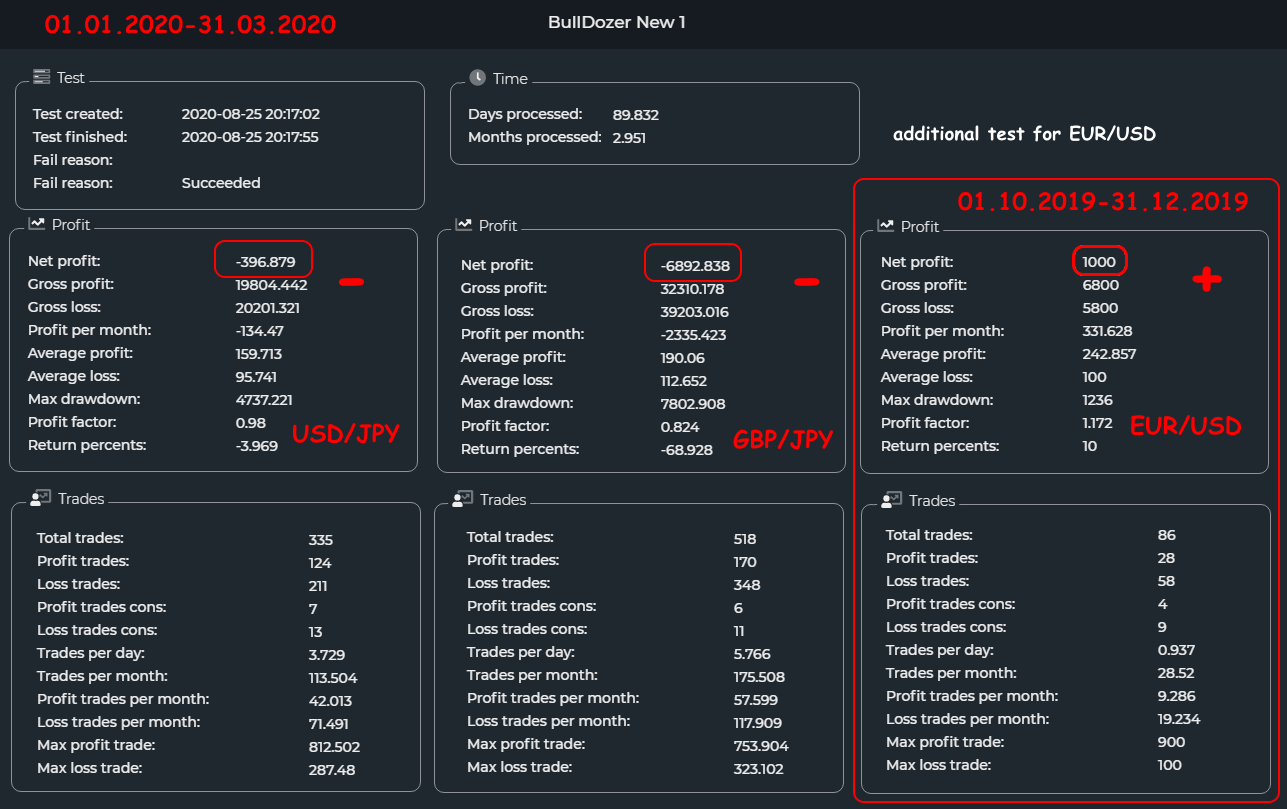
Yen pairs are at a loss, but the author did not recommend them for trading.
Just in case, we check another three months for EUR/USD — there is still a profit, even if it’s a small one.
Before proceeding to the strategy test based on long price history, let’s try to change the logic a little.
Let’s assume that the EMA lines’ relative position is more important than the close above the long-term trend line. Let’s switch the first and second conditions: first, we check the location of MAs and then wait for the corresponding price close.
We create a version of the strategy with new conditions and rerun quick tests.
What is the result?
An excellent profit was obtained for the main pairs, especially considering that part of the possible profit is lost due to late entry (see above). The AUD/USD pair still doesn’t bring any joy.
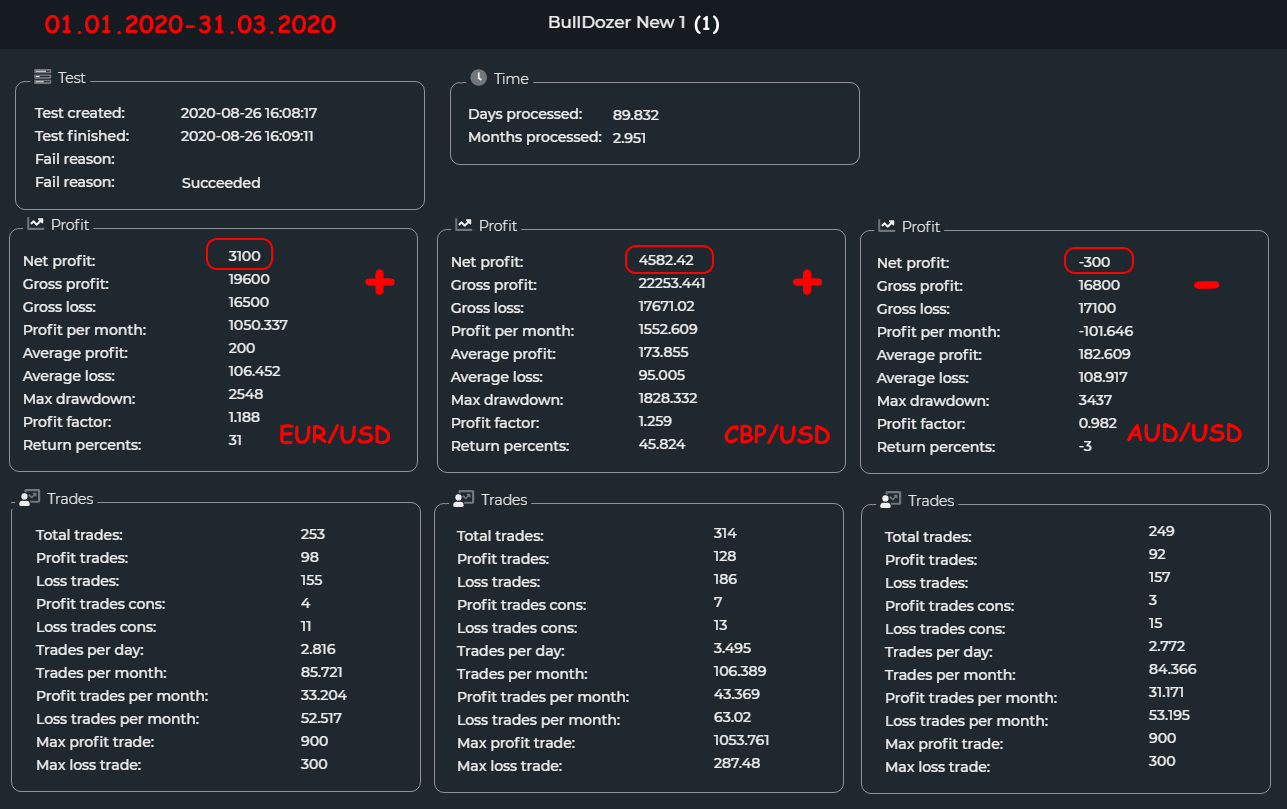
The results for yen pairs remained practically unchanged — we do not recommend using them in this strategy.
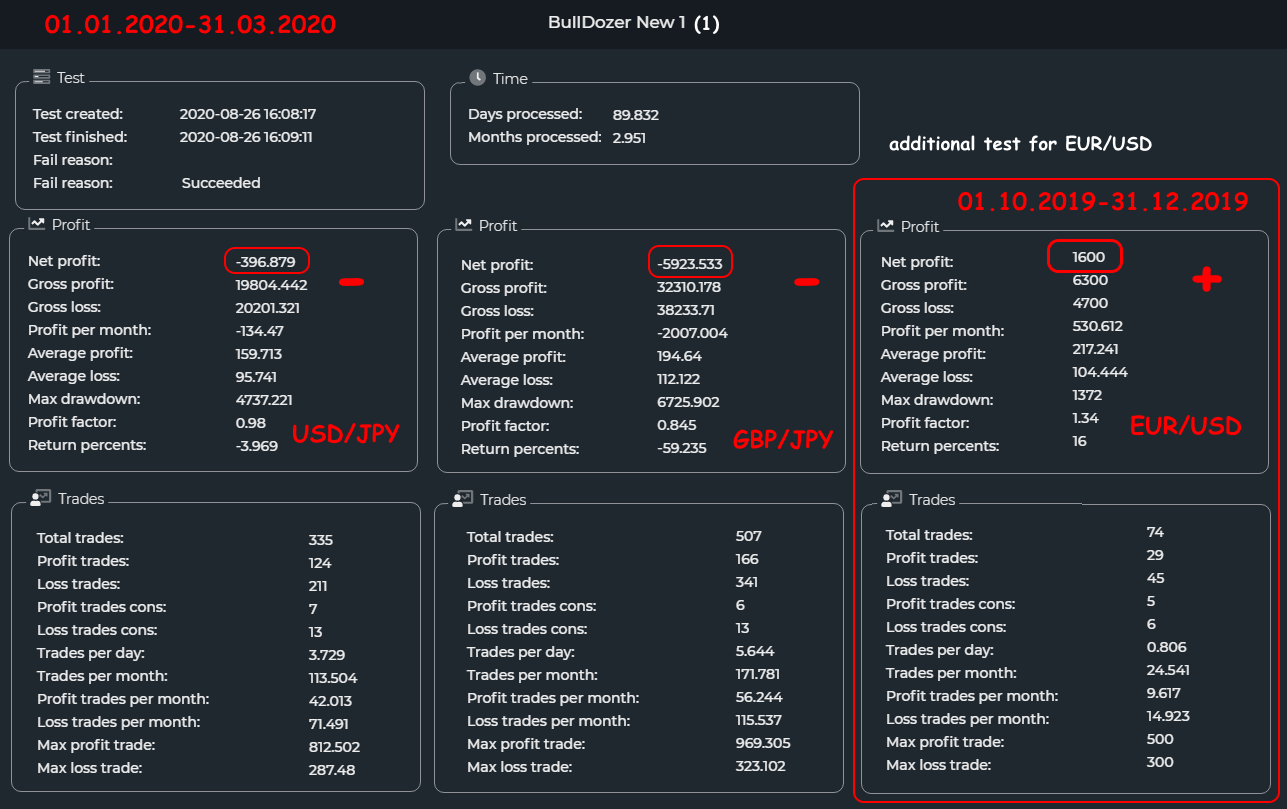
We get very promising results on the main pairs, which means that the method as a whole does work, although the statistics can hardly be trusted.
We export the latest version of the strategy to a *.dll file for Forex Tester Online and move on.
General test conditions in Forex Tester Online
We carry out an automatic test in the FTO environment on the EUR/USD and GBP/USD currency pairs; timeframe is H1; initial deposit is $100.000, leverage is 1:100, minimum transaction volume is 1 lot, the test period is 3.5 years.
The swap size is selected for the FXCM broker.
See the screenshot below for project and asset parameters:
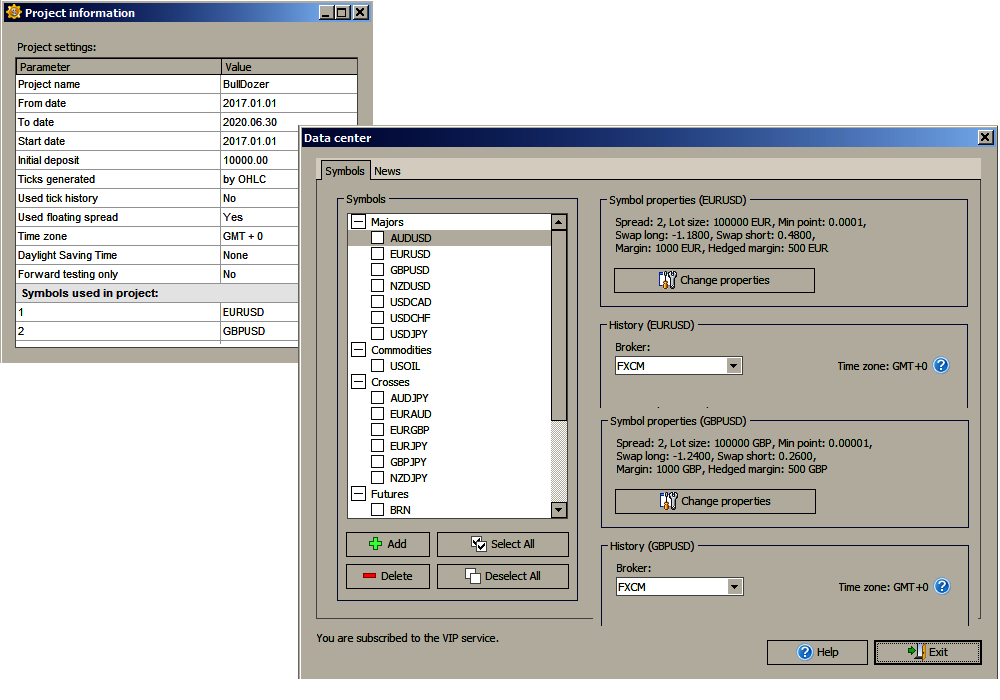
The trading signal search range (the “Bars to skip” parameter) is initially set at 50 (in bars), the trailing parameters are taken from the EFB settings. The maximum load on the deposit is no more than 3 lots.
It is assumed that there is no withdrawal of funds or replenishment of the deposit during the test period. All deals are opened and fixed automatically. Only test statistics are used for analysis.
Let’s take a closer look.
Test #1
Checking EUR/USD under the default conditions:
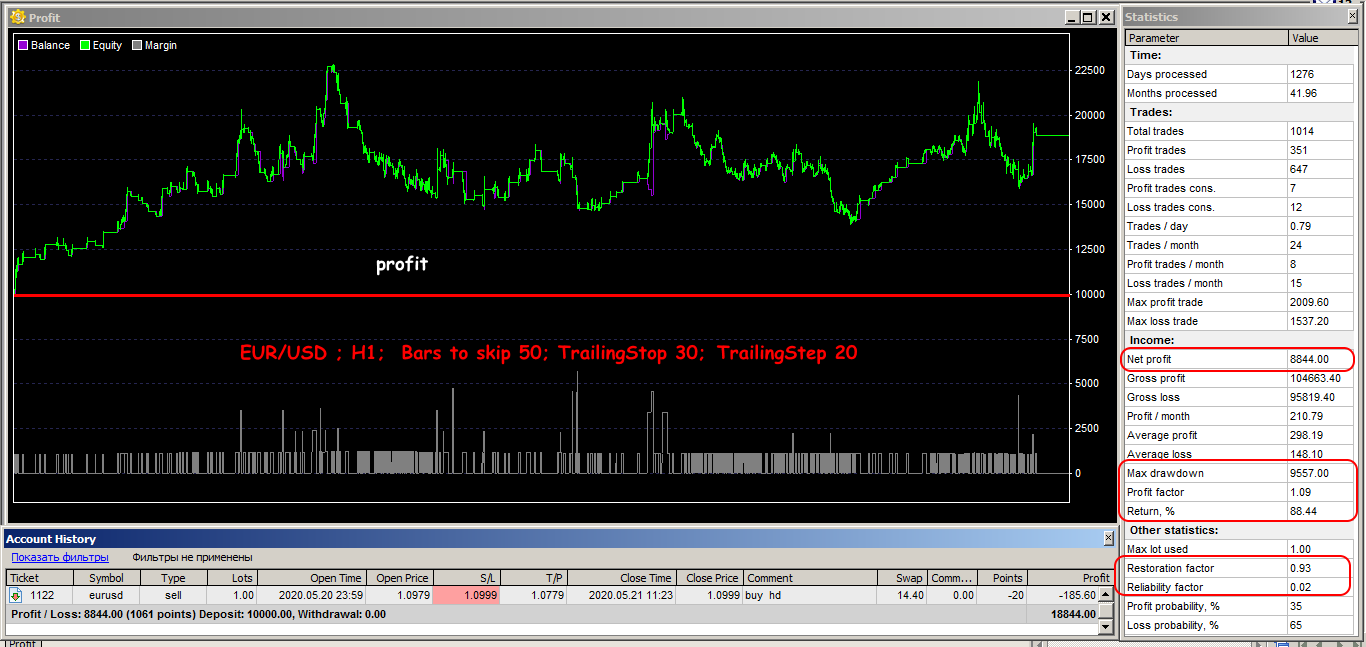
What is the result? The deposit is in profit the entire period of the test, the maximum drawdown seems too high, but it is all in the positive zone. The dynamics look unstable, but a large margin of profit was accumulated during the first test period, due to which the balance does not fall below the initial level at all.
There are 2 times more losing trades than profitable ones, which indicates a low accuracy of an entry, and if it wasn’t for Stop Loss, the result would have been disastrous. The statistics seem weak, but it’s normal for medium-term strategies, at least in terms of the profit factor.
We remind you: the Stop Loss / Take Profit parameters must be adjusted in the EFB template, after which a new *.dll file for Forex Tester must be generated.
In this case, attempts to decrease Stop Loss and/or increase the trailing step lead to a significant loss of profit. The most profitable option is selected for analysis.
The overall rating is fine.
Test #2
Checking GBP/USD under the standard conditions:
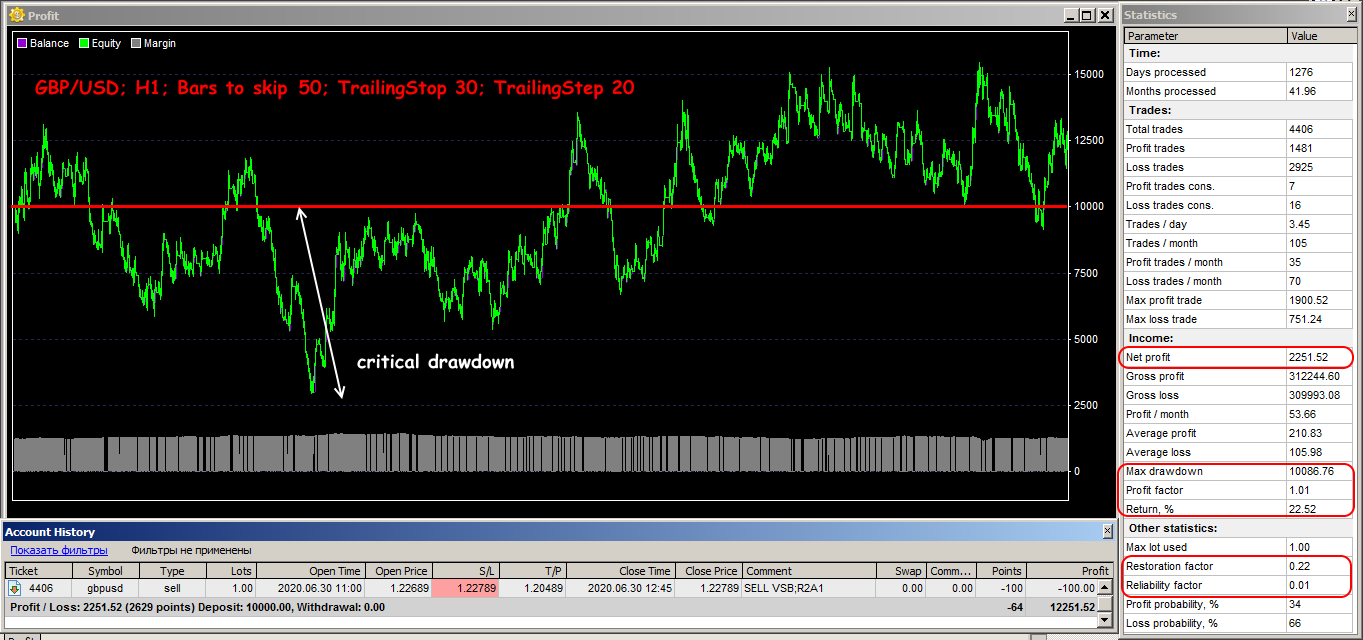
What is the result? The fact that the test closed with a small profit in the end does not compensate for the negative from the overall picture: everything looks very bad compared to the previous test.
The maximum drawdown of more than $10.000 means that if it wasn’t for the relatively small profit before the period of critical losses, the deposit would have been completely lost.
An incredible number of deals (more than 4400) submits that Take Profit / Stop Loss and trailing parameters were chosen incorrectly: due to the high volatility of the GBP/USD pair, most deals, being barely opened, are quickly closed either by Stop Loss or with a minimum profit. The statistics are very weak, especially the recovery factor.
A strategy with such parameters is not recommended for working on a real deposit.
Test #3
Nevertheless, the author’s recommendations suggest the use of the strategy on the GBP/USD pair. Let’s try one more test, but on a larger timeframe and with the “Bars to skip” parameter of 20:
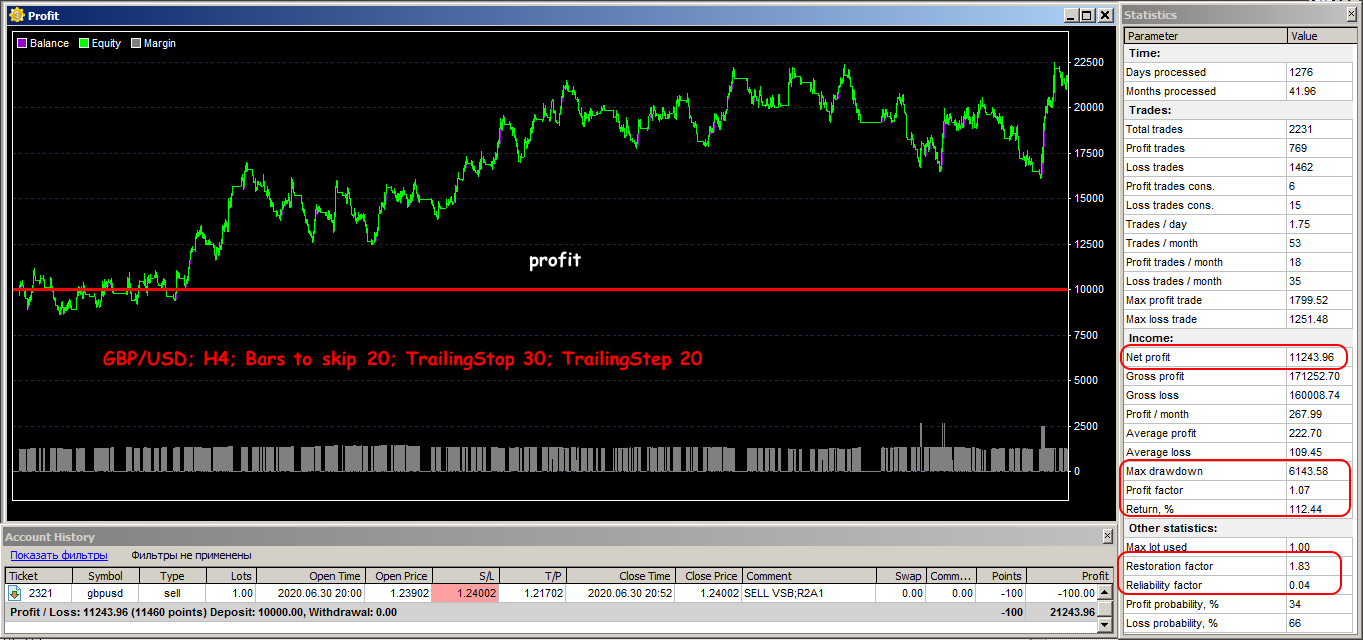
What is the result? All drawdowns are in the profit zone, and the balance is restored relatively quickly. The total profit is more than 110%; there are two times less transactions, although the ratio of the number of unprofitable and profitable ones remains the same. The maximum drawdown is in the profit zone. Statistics indicators are almost average.
Even if we consider that the price history tests can be trusted by about 70%, the result can be regarded as excellent.
A few practical notes
The tests have shown that the BullDozer method is quite viable, but it is far from being “super profitable”. There are several negative points.
Complete with EMA (21) (or EMA (20)), which estimates the dynamics for a month (5 days * 4 weeks), EMA (50) (55) is usually used — such a bundle gives more than 75% of correct signals. In this strategy, parameter 70 for the slow moving average is clearly overestimated. The necessary condition for the price to close behind the EMA line (70) leads to the omission of profitable entry points.
Using the Awesome Oscillator’s histogram to filter signals is ineffective — it lags and poorly estimates the strength of a trend. As a result, we get a lot of losing orders during periods of low volatility.
By the way, according to Awesome Oscillator, the location of the histogram relative to the central line (above/below) is usually also taken into account, but this technique does not analyze this fact.
The strategy “sees” a strong trend well, but it doesn’t work out most of the speculative price movements. Flat periods are almost not controlled — orders are opened according to the usual pattern even on weak movements. The strategy does not react correctly to frequent changes in the color of the histogram.
The BullDozer can be used for manual medium-term trading with a mandatory Stop Loss. In particular, you can try a dynamic Stop along the EMA line (21). The timeframe is not lower than H1.
Too volatile currency pairs or assets with an unstable trend are contraindicated for this technique. When creating a script for automatic trading, an additional trend control mechanism is needed to prevent opening deals during a flat period.
Try It Yourself
As you can see, backtesting is quite simple activity in case if you have the right backtesting tools.
The testing of this strategy was arranged in Forex Tester with the historical data that comes along with the program.
To check this (or any other) strategy’s performance you can use Forex Tester Online.
 Backtest BullDozer on Forex Tester Online
 ไทย
ไทย
 Tiếng Việt
 Polski
 Türkçe
 Nederlands
 Română
 한국어
한국어
 Svenska


