At any moment, there are two types of the stock gamblers in the market: «bulls» are trying to raise the price, «bears» are trying to reduce it as much as possible.
Depending on which of the parties is stronger, the day (or other period) is closed at a higher and lower price. A displacement of the seller/buyer balance is one of the first signals that allows to predict the most probable change of the trend.
Analysis of the market power balance has always been carried out, since the very appearance of the market itself. In Alexander Elder’s popular book The New Trading for a Living…, there was a first description of the functioning of the technical tools that the modern traders know as the BullsPower and BearsPower indicators.
So let’s begin.
Logic and purpose
The purpose of the proposed indicators is to assess the market chances, that is, how much more active participants have shifted balance to their side. The indicators value for a period shows what strength and at what moments dominated the market.
The extreme points that occur within a period, reflect how active the struggle was. The result of analysis may indicate a possible change in the trend vector.
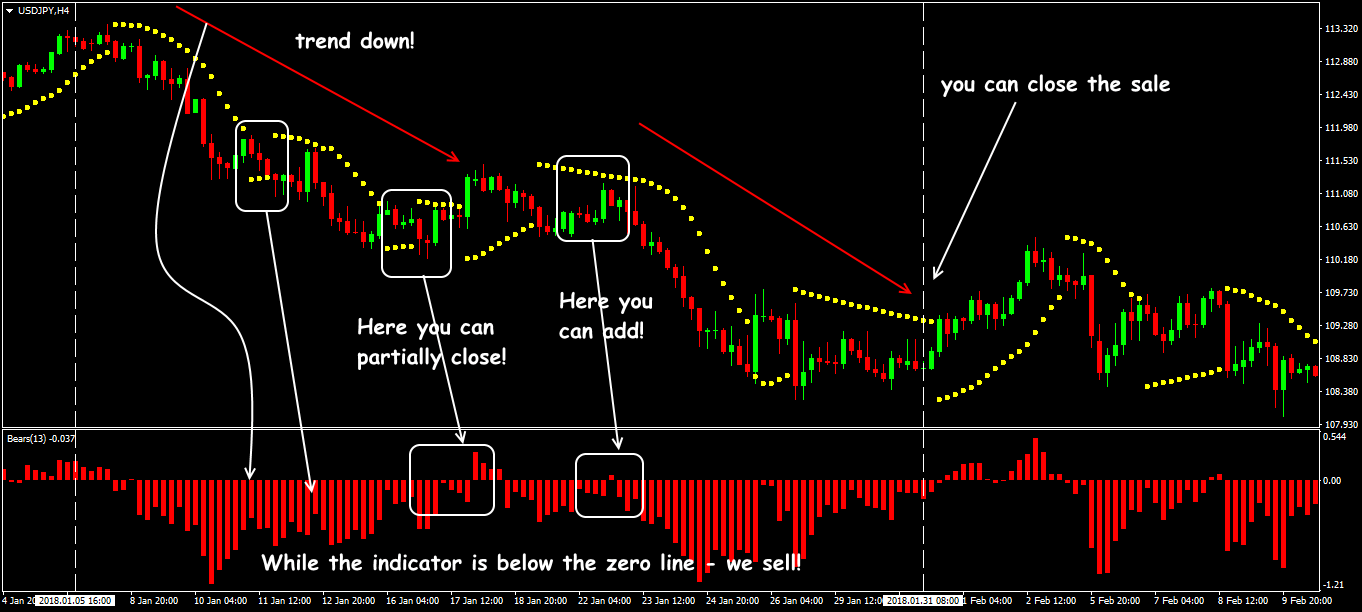
If the final price is becoming higher – buyers are currently stronger, and how much stronger than the «average level» they are – it can be checked with the help of the BullsPower value. If the price is decreasing − then sellers are more active, and the analysis is carried out with the BearsPower indicator. The BullsPower indicator is used to hold the BUY positions in the rising market, and the BearsPower indicator is used for the SELL positions in the descending market.
Calculation procedure
The indicators’ value is calculated on the basis of an exponential moving average, the value of which is considered a «fair» price at any time and acts as a dynamic market balance among the players.
To calculate the value of the BullsPower:
BULL = PriceHigh − EMA (n),
where:
PriceHigh is the maximum price of the current bar;
EMA (n) is the moving average for a period.
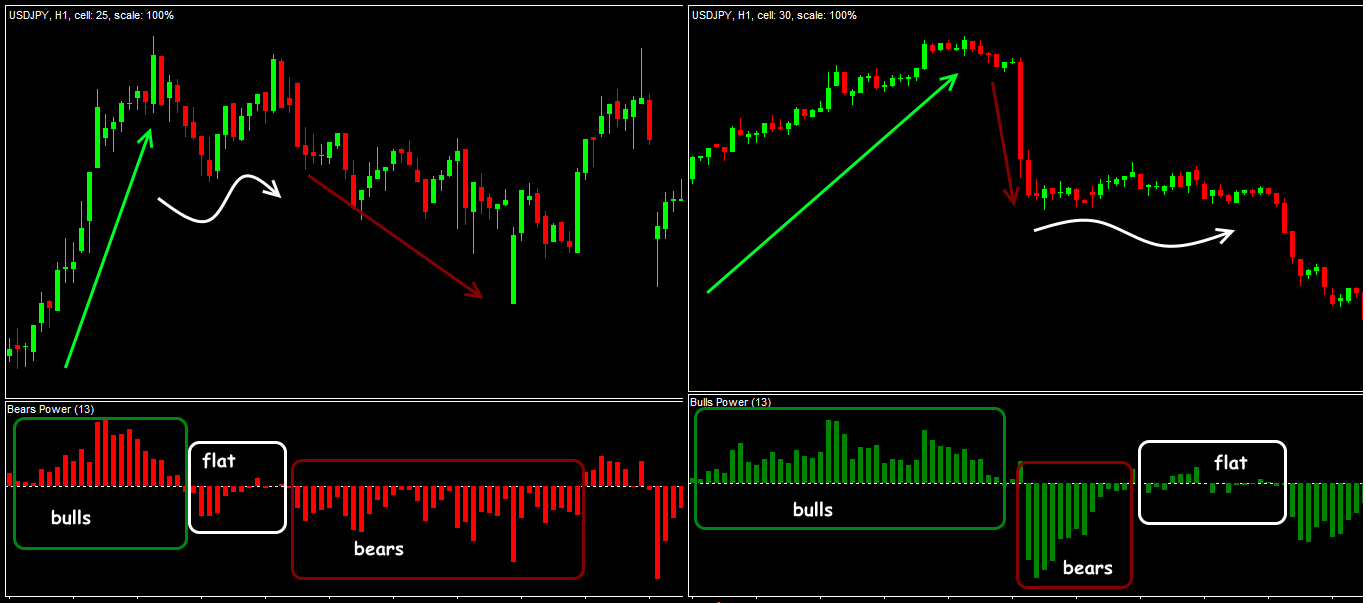
If the trend is upward, then PriceHigh will be larger than the EMA (n) value: the total value of the bulls’ strength is positive. The indicator is located above the zero line.
If the trend is bearish, the final value is negative. Then the indicator is below the balance line. The local maximum for a period is a moment when buyers were the strongest.
To calculate the value of BearsPower:
BEAR = PriceLow – EMA (n),
where:
PriceLow is the minimum price of the current bar;
EMA(n) is the moving average for a period.
If the trend is downward, then PriceLow will be smaller than the EMA (n) value: the total value of the bears’ strength is negative. The indicator is located below the zero line.
If the trend is upward, the final value is positive. Then the indicator is above the balance line. The local minimum for a period is a point at which sellers were the strongest (check bears bulls power).
Reminder: in these tools, an exponential method of the average prices calculation is chosen by default, so that the most «fresh» quotations exert maximum influence on the final result.
Parameters and control
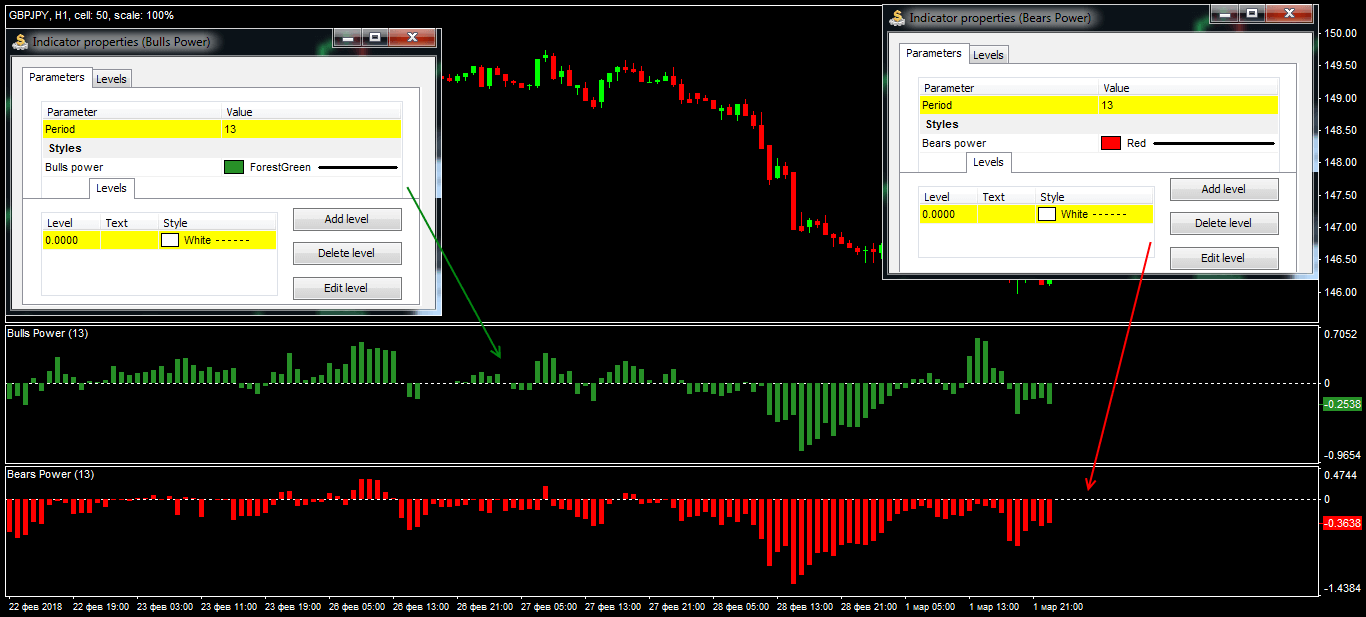
Both indicators are included in the standard set of all popular trading platforms and represent a single-color histogram with a dynamic zero line. There is only one parameter − the number of bars to calculate.
For the BullsPower indicator, traditional color is green (or blue). The longer the bar is, the stronger the bulls are, that is, you can conclude that there is a steady interest in purchases.
For the BearsPower indicator, traditional color is red. The longer the bar is, the stronger the bears are, that is, we can conclude that there is more interest in sales.
It seems that Maestro Edler hasn’t told anyone about the main secret, because a question of the practical usefulness of the BullsPower and BearsPower indicators is still in doubt.
However, it encourages modern traders to develop new tools that use the author’s main idea. But the logic of these tools is quite simple − let’s look at it in detail.
Trade signals of the indicator
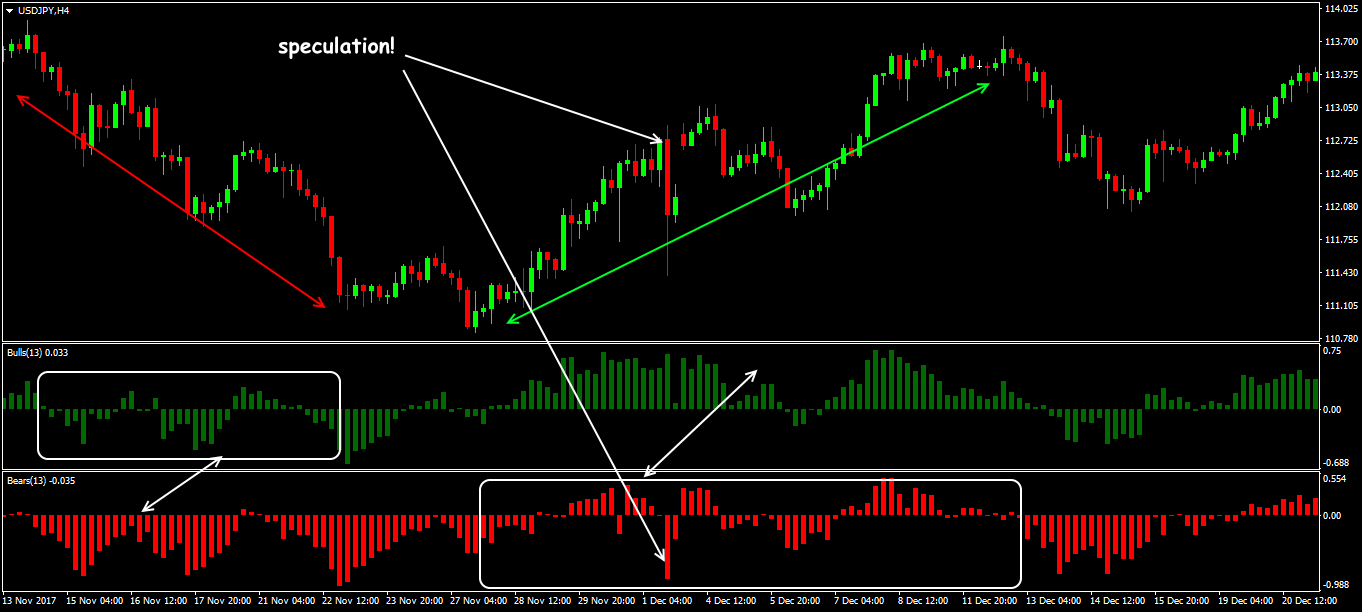
First of all, we pay attention to a position of the histogram in relation to the zero line: higher/lower. We will reason in accordance with a classical theory of the market. If the market is dominated by bulls, then the Ask price increases (Ask price of the current tick is fixed when it is bigger than the Ask price of the previous tick).
It means that:
- Either there is a customer who has already bought this asset at a previous (lower) market price, and is waiting for its further growth (holding an open BUY deal or increasing the volume of purchases);
- or there is a seller who has decided to cancel his SELL deal because he has changed his mind about selling at the current price.
Each such event promotes an upward movement.
If bears predominate in the market, the Bid price will decrease (Bid of the current tick is fixed being lower than the previous Bid price).
It means that:
- either there is a seller who has sold the asset at a previous (higher) market price, and is waiting for its further reduction (holding a SELL deal or adding the volume for sale);
- or there is a buyer who, for some reason, has decided to cancel his BUY deal because he is not yet ready to buy at the current low price.
Any of these situations leads to the increased interest in sale.
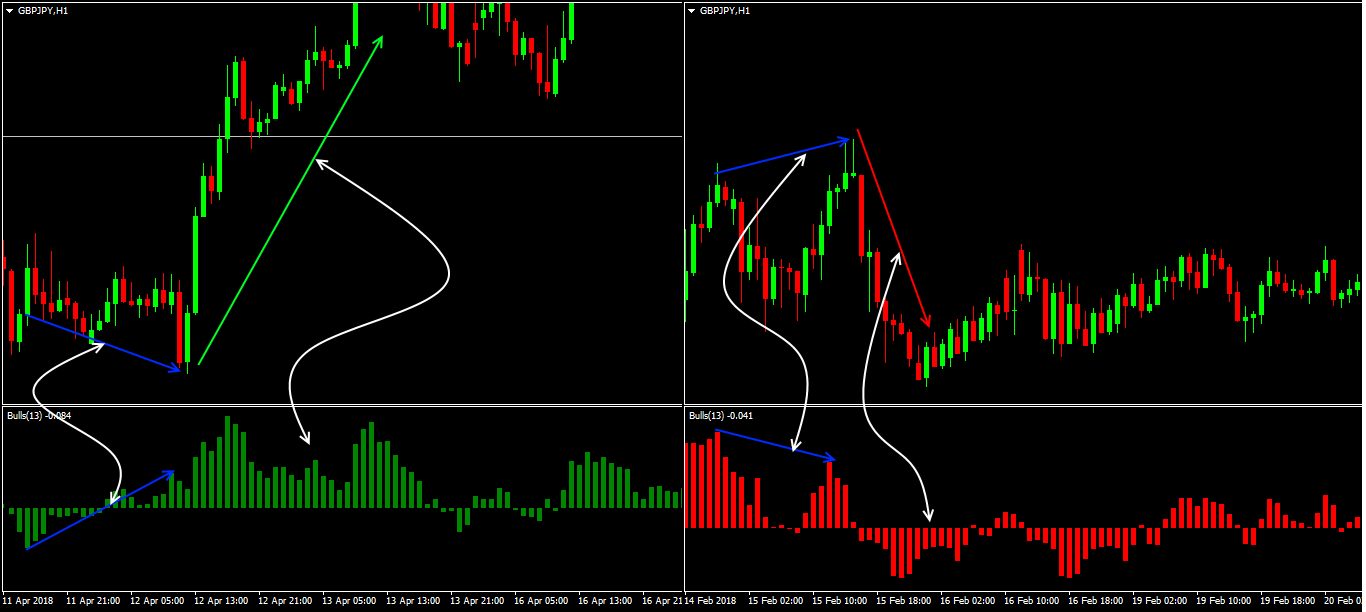
Traditionally for oscillators, the strongest signal for a reversal is divergence of the histogram with the price dynamics. This situation indicates that the price for the current trend moves only by inertia and the probability of a reversal is high.
Application in the trade strategies
Delay is a drawback of all modern oscillators, and BullsPower/BearsPower fully suffers from this problem. What this means is that without the recourse to other technical means, it will be difficult to expect positive results.
Therefore, the use of these indicators makes sense only in conjunction with any trend indicator in order to minimize the negative effect. For example, it can be a set of simple moving averages, but a more powerful effect will be provided by the Parabolic SAR.
What can we suggest to the enthusiasts of the Alexander Elder’s technical developments?
Bulls vs Bears indicator
This attempt to use BullsPower and BearsPower is worthy of paying attention to. This is a fairly effective tool for entering in direction of the current trend.
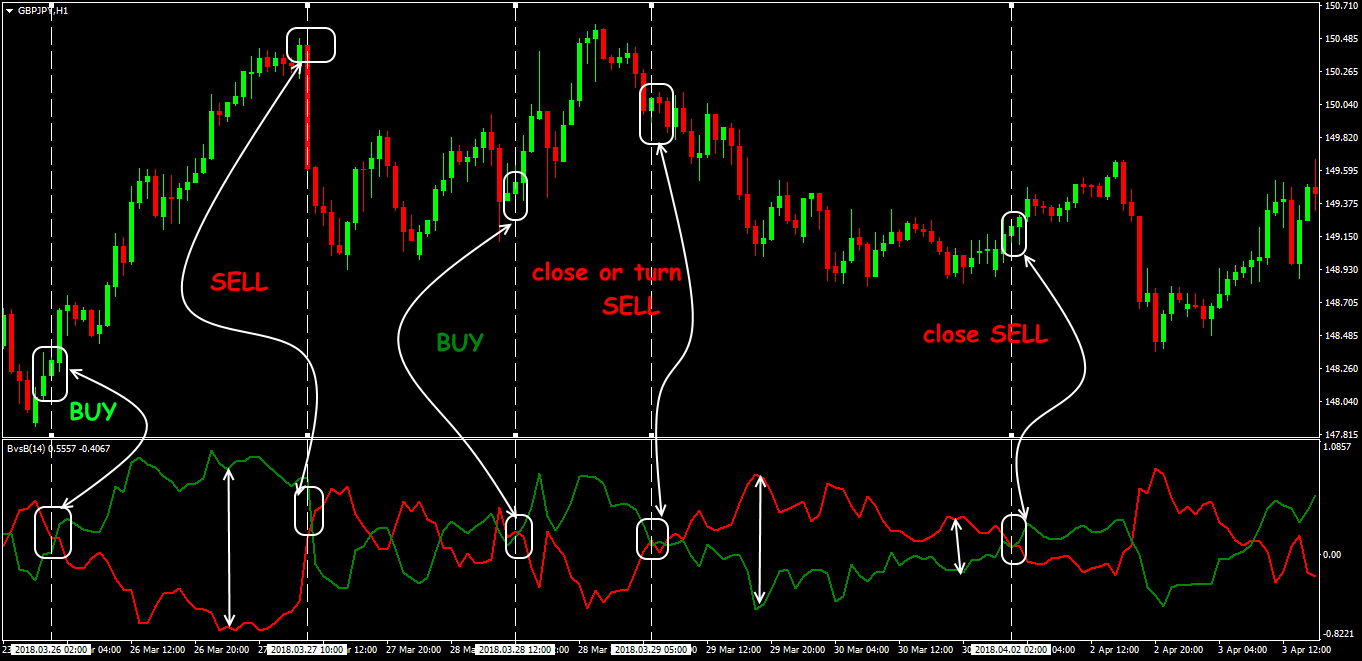
Bull vs Bears combines both Elder’s indicators − as a result we get a «two-in-one» signal. The combined indicator is an oscillator of two lines − the green one shows the strength of bulls, the red one indicates the strength of bears. We enter the market after the signal lines cross.
Signal for purchase: the green line of buyers (BullsPower) crosses the red line of sellers (BearsPower) from the bottom up.
Signal for sale: similarly − from the bottom up – the red line should cross the green one.
The stronger the Bulls vs Bears lines diverge after crossing, the stronger the movement on a trend. If the lines begin to approach, the current direction weakens and it is worth to fix the deal at least partially.
The fact that the indicator’s lines converge does not mean that the new direction is being seriously intensified and that it is possible to open a reverse transaction.
After the intersection point, the amplitude of the lines may remain weak − the market will go into a flat. Signals of the Bulls vs Bears indicator can be used in the integrated trading system as an additional signal for opening/closing positions.
Several practical remarks
The result?
As the independent analysis tools, BullsPower and BearsPower are used extremely rarely. The strength of the market participants is estimated by these indicators very roughly. The data obtained can be useful only in the abstract market analysis − to assess the continuation of the current trend.
In addition, the calculation of these oscillators does not take into account the market volume indicator, therefore, one should not count on the signals’ objectivity. Theoretically, using the dynamics of these tools, you increase your chance to open/close a deal at the optimal moment.
As for the positive points, we note a simple calculation and the visual simplicity of the chart, which allows you to understand the signals unambiguously. Indicators are tolerant to any assets (currencies, stock and commodity markets) and are perfectly combined with any technical analysis tools.
Combined variants (for example, Bulls-Bears-Balance) can be more effective: such tools assess the bulls/bears relation and show which player is stronger at the moment. It’s up to you to decide how beneficial this all is.
Try It Yourself
After all the sides of the indicator were revealed, it is right the time for you to try either it will become your tool #1 for trading.
In order to try the indicator performance alone or in the combination with other ones, you can use Forex Tester with the historical data that comes along with the program.
Simply get Forex Tester Online (click the button below). In addition, you will receive 23 years of free historical data (easily downloadable straight from the software).
Was this article useful for you? It is important for us to know your opinion – share your comments down below!
 Try Forex Tester Online
 ไทย
ไทย
 Tiếng Việt
 Polski
 Türkçe
 Nederlands
 Română
 한국어
한국어
 Svenska
