Summarize at:
Natural logic of the market behaviour suggests that most of the trading time, price is in relative peace in a zone of some balanced levels. Extreme transactions caused by the pressure of particularly active buyers/sellers, take the market out of balance just temporarily.
But the larger the distance between the price and the base trend, the greater the number of players who close positions, fixing the profit or loss, and thereby returning the price to the economically justified values.
The name of the indicator’s author did not remain in history, but for the first time, such an idea was used by the exchange players trading with the moving averages − it helped to filter false signals.
When the volatile Forex market emerged, the Envelopes indicator began to be used for both Reversal trading and trend transactions.
Let’s get to the point.
What is the Envelope Indicator and How Does It Work?
The Envelopes indicator offers one more option for trading in a trend channel on the rollback or breakdown of the boundaries. The tool is based on the idea of moving averages, and builds a dynamic range on the price chart. Within this range, the price (as expected) should fluctuate most of the market time.
In some versions of the indicator, the central moving average is also shown, from which a parallel channel is constructed. Its boundaries are shifted from the center by an equal distance, depending on the deviation coefficient.
The upper and lower lines are used as dynamic support/resistance levels.
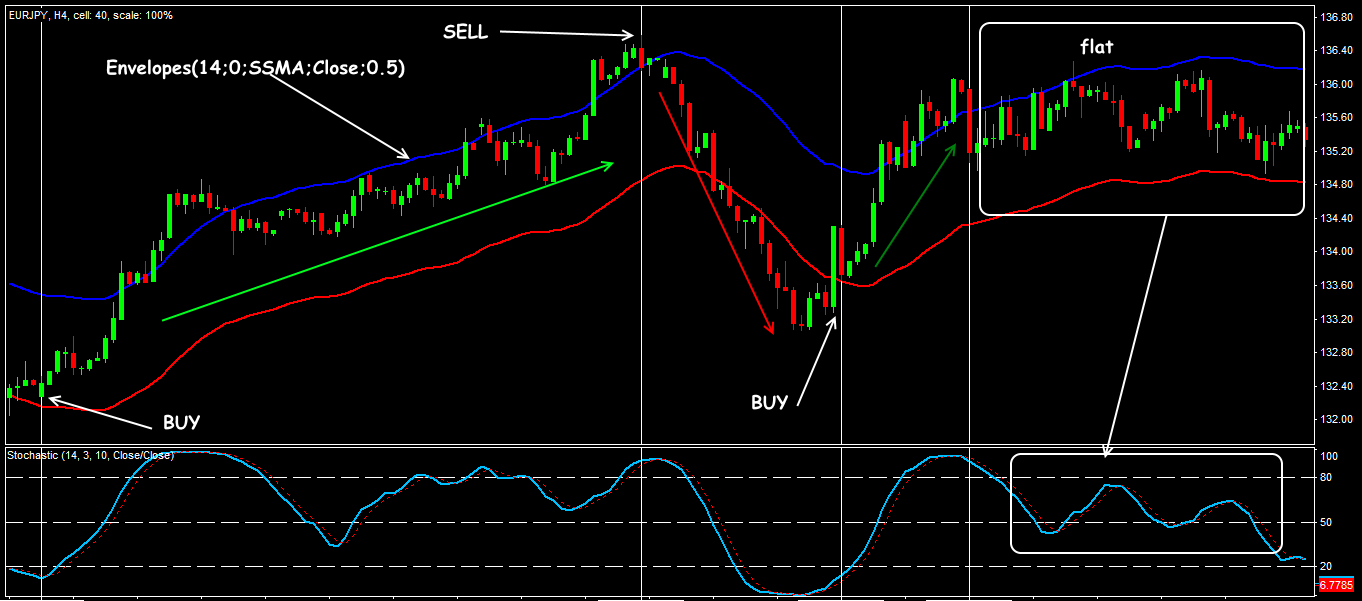
Trading signals of the Envelopes indicator
The trader’s task is to determine a fair (average) value of the asset at any time, and to wait for a deviation from this value in order to enter a transaction on the expectation that the price will return to this value.
A confident breakdown of the range boundaries is possible only on a strong, fundamentally justified price movement − in this case, the transaction opens in the direction of the momentum.
A famous example of such a strategy is trading based on the Way Turtle Methods … by Richard Dennis.
Ready to test the Envelope indicator strategy?
To check this (or any other) strategy’s performance you can try Forex Tester Online (FTO) for Free.
Check how to use FTO simulator in our step-by-step guide or watch this video:
Envelope Indicator Formula: Calculating
The Envelopes channel is formed by three dynamic lines based on the moving average (of any type). The line located at the top of the envelope is shifted upward relative to the baseline by a fixed deviation value:
![Envelope indicator explained [tested settings included] 1 env0000eng](https://forextester.com/blog/app/uploads/env0000eng.png) The line located at the bottom of the channel is shifted downward by the same distance:
The line located at the bottom of the channel is shifted downward by the same distance:
![Envelope indicator explained [tested settings included] 2 env0001eng](https://forextester.com/blog/app/uploads/env0001eng.png) where
where
- MA − base moving average (the central line, as a rule, is not displayed);
- PriceClose − closing price;
- N − number of bars;
- K/1000 − deviation from the average value or the envelope ratio (%).
The width of the MA envelope depends on the size of deviation (check ENV). The envelope ratio is adjusted depending on the average volatility of the trading asset, so that 80-90% of the bars are inside the constructed channel. Then the indicator will show the equilibrium state of the price as accurately as possible.
Envelope indicator settings
The standard version of the Envelopes indicator is included in the basic set of all popular trading platforms.
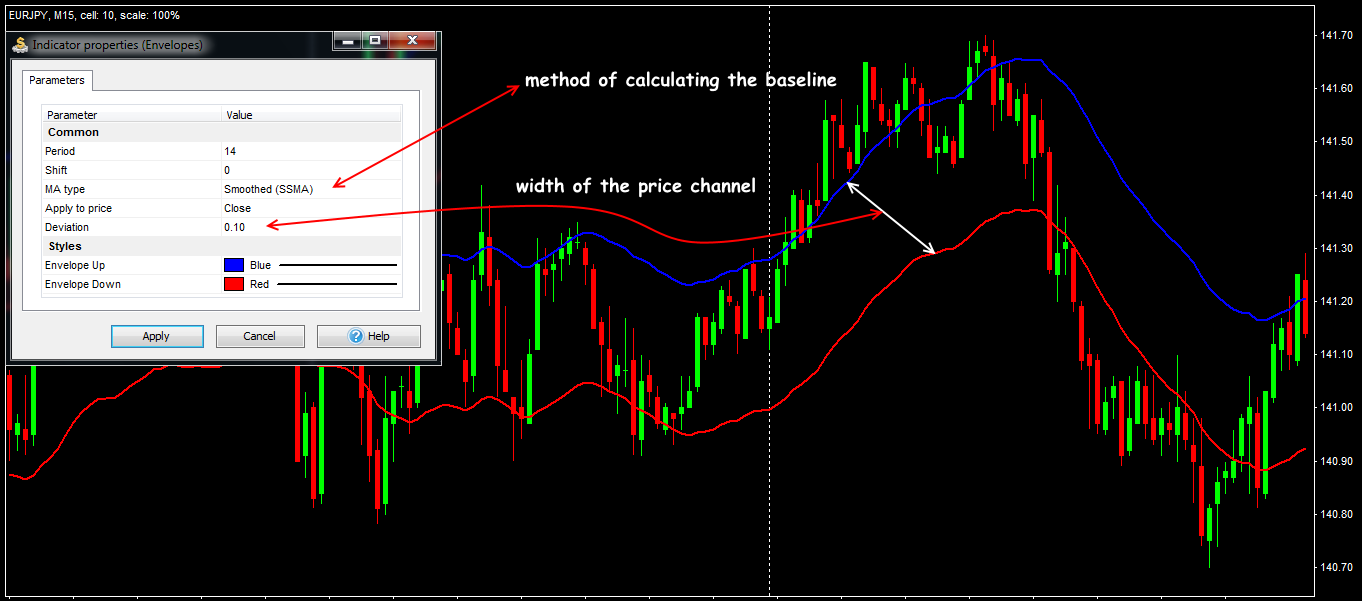
Standard version of the Envelopes indicator
Description of the parameters can be different, but the number of bars (Period), method of calculation (MA type) of moving average, Deviation, and the offset from the current price are considered the main ones. As a rule, the closing price is chosen (Applied Price).
Reducing the period of the average will make Envelopes more «active». Increase of the period is effective only on the timeframes bigger than H1, since it slows the dynamics of indicator significantly.
The shorter the analysis period is, the smaller the main parameter should be, in order to keep the required percentage of the bars falling into the channel zone.
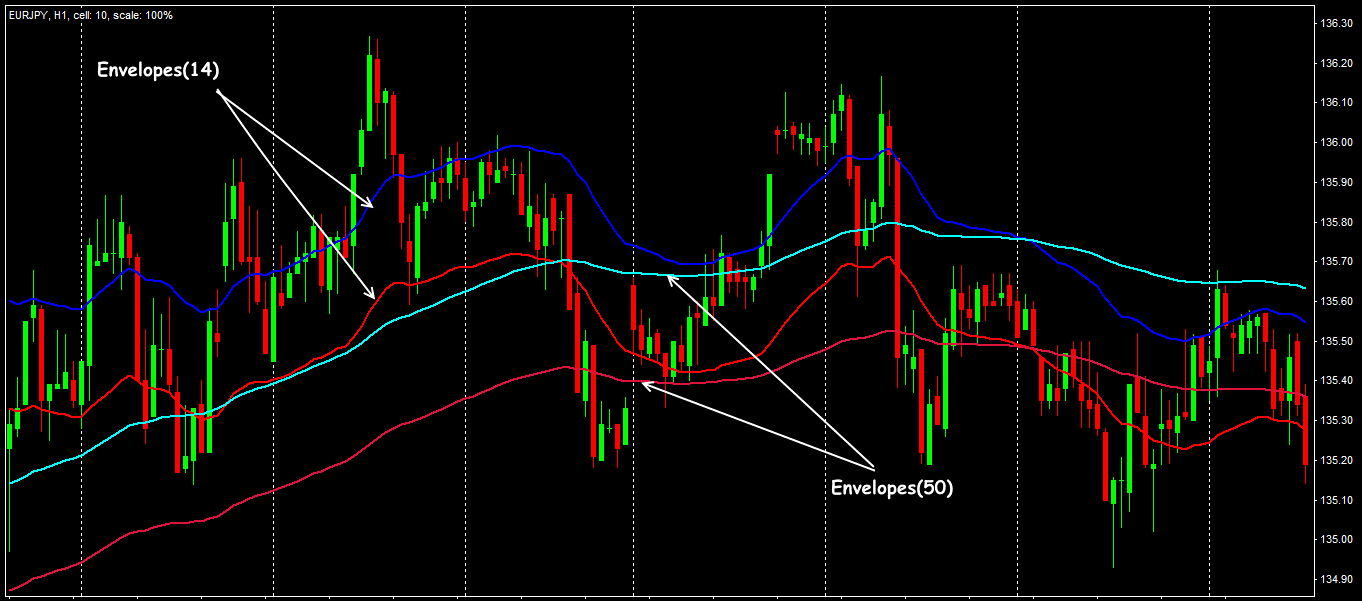
Long and short period in the Envelopes
It is the last parameter of the indicator that shows how far from the average price the boundaries of your channel will be situated: the higher the value (percentage) of deviation, the wider the envelope will be.
For each financial asset, the value should be selected separately, by testing on the real data. It is recommended to choose between 0.05% -2%, otherwise the channel becomes too «global» and estimates the volatility incorrectly.
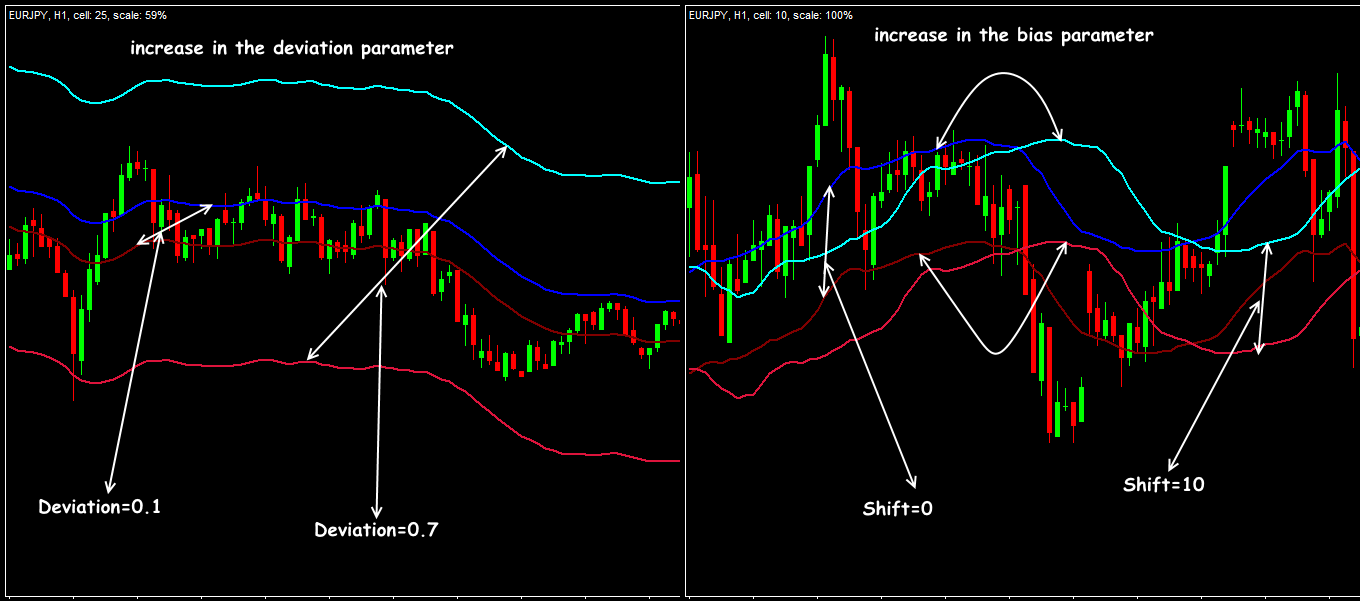
A deviation and shift in Envelopes
In a too active market, it is recommended to apply an offset that is a multiple of the ATR indicator’s values with the same averaging period − it helps to get in the trend more precisely; in the flat market, the Envelopes indicator with zero deviation is recommended.
When adjusting the parameters, you should take into account volatility of the asset, working timeframe, and characteristics of the personal trading tactics − it affects your confidence in the trading signals of the indicator.
Let’s look at it in detail.
Trading Signals: How to Buy and Sell with the Envelopes Indicator
The indicator is easy to understand, it provides not so many signals, and all of them are standard.
Trading inside the channel
It is considered the best method. If we assume that the Envelopes indicator determines a range of the regular price fluctuations, then behavior in the border zone determines the basic trading signals: a rollback from the upper zone (resistance line) is a signal for sale, while a rollback from the lower zone (support line) is a signal for purchase.
You should open a deal not at the moment of the line contact, but only after a reverse breakdown and return to the channel – in order to exclude false signals.
Among the first supporters of the countertrend trading based on the idea of Envelopes, Chester Keltner should be mentioned. His proprietary indicator uses the value of a typical price instead of the closing price, and builds a dynamic channel with a variable width value.
Trading for the breakdown of the borders
During the calculation, the Envelopes lines are «too average» and do not respond to the changes in volatility. That’s why such signals are considered reliable only if the trend change is confirmed by an additional indicator.
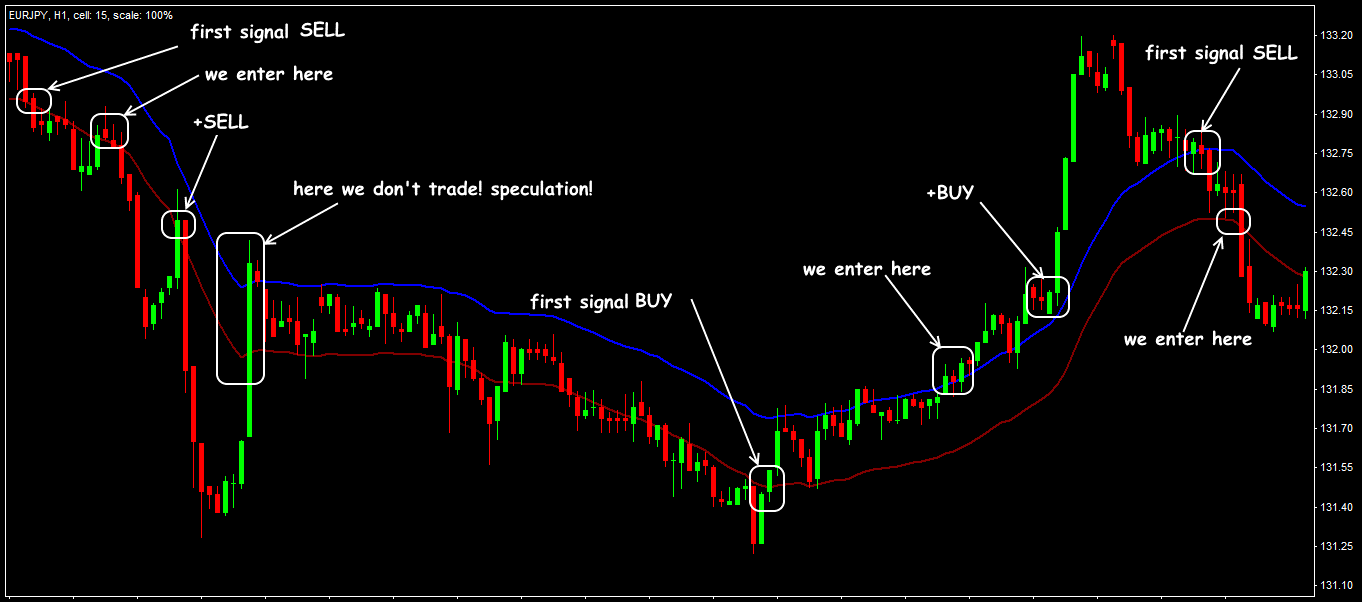
Signals for the breakdown of the Envelopes borders
Envelopes as a price filter
The indicator is used to confirm entry points in the complex trading systems (for example, in case of the breakdown of an additional moving average in the channel area), and to identify a general direction of the movement.
A transition of the market into a flat condition can be noticed by a horizontal position of the Envelopes borders: as the inclination of the channel increases, we can talk about emergence of a new trend − the greater the angle of inclination, the stronger the trend.
The result?
Using Envelopes puts a trader in front of a traditional problem of the moving averages: either to skip part of the trend movement, or to deal with a number of incorrect entry points.
The first tactic is used mainly for medium-term and long-term trading on a trend, the second method is applied for transactions within a day. In any case, this indicator assesses the market only qualitatively. All its signals require additional confirmation to open a transaction.
Envelopes Trading Strategies: MACD & HMA Combinations
Since Envelopes is a technical tool of the trend channel, it will be logical to combine it with oscillators or with a faster moving average. We suggest two popular variants.
The Envelopes + MACD system
The tactic is simple − we combine the signals given by the indicators and open a deal when there is coincidence. In addition, it becomes possible to practice the divergences on MACD more accurately.
If a max of the closed bar exceeds the upper boundary of the Envelopes indicator and MACD generates a min at the same time – we open a BUY order, trying to catch the market during a rollback. For a SELL order, we do the opposite.
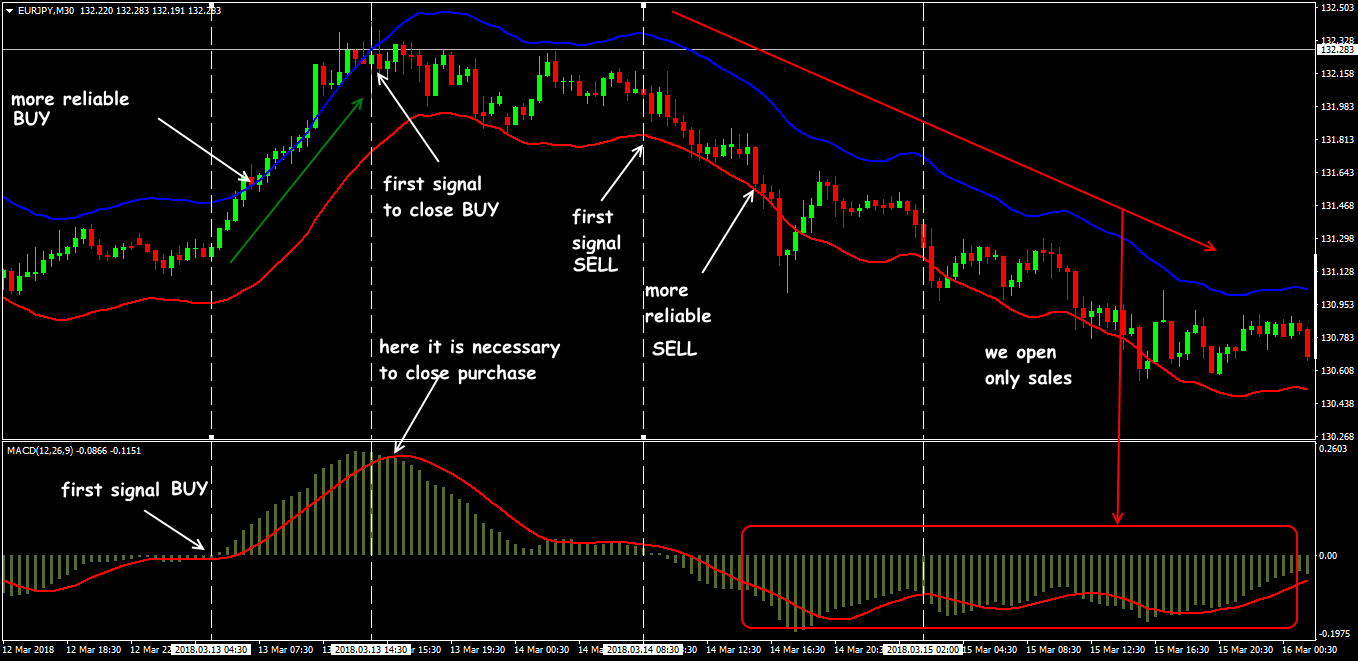
Scheme of the trading signals of the Envelopes + MACD strategy
The Envelopes + HMA scalping strategy
Three Envelopes indicators are required with a period of 40, Close prices, and MA Simple method, but with the different deviation values: 0.5%; 0.3%; 0.2%. The HMA_Color indicator (7; Close; 0; 3) is used as a signal line. We trade the medium volatile currency pairs on the M30 timeframe.
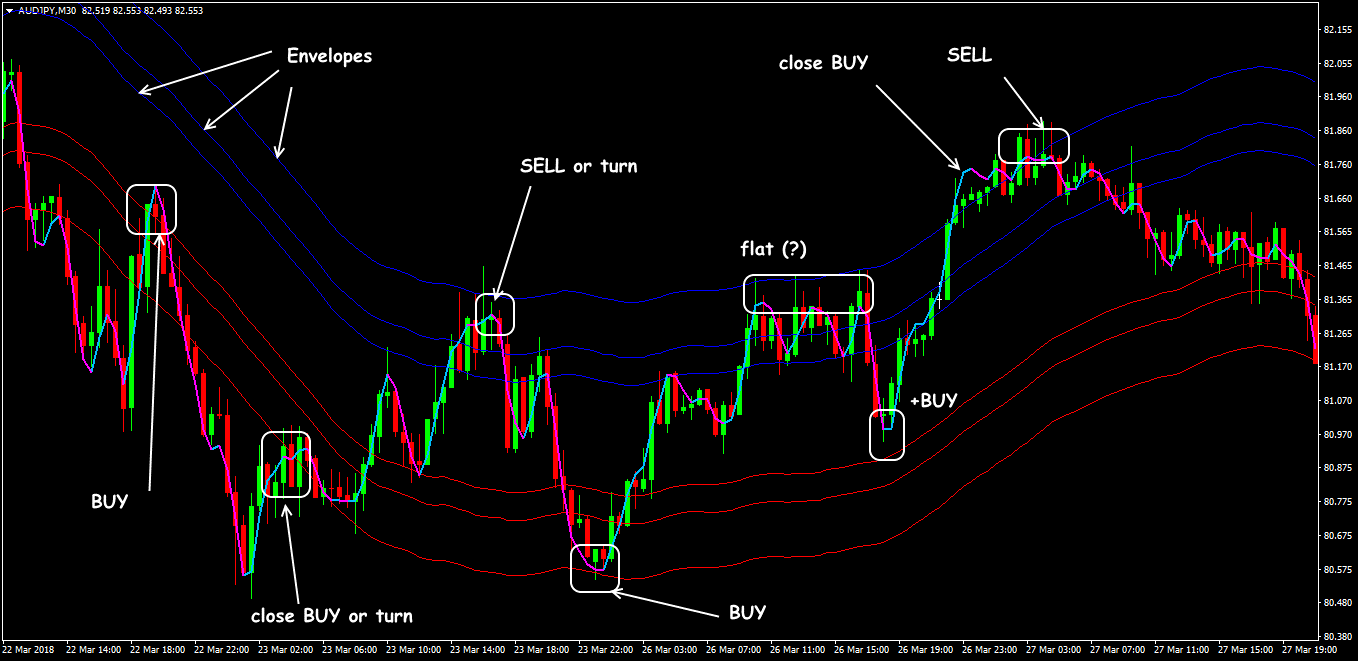
Scheme of trading signals of the Envelopes + HMA strategy
The tactic for entering the market − at intersection of any of the Envelopes lines; bottom (bottom up) – for Buy, top (top to bottom) − for Sale. The entrance is after closing the key candle, exit is on a confident reversal. It is highly recommended to use a trailing stop.
Tips for Success
The Envelopes indicator is not very profitable as a usual moving average (it is still a price channel!), but nevertheless, it is useful at the initial stage of the trend formation. In general, this is a good option for using an overbought/oversold state to search for entry/exit points at the price corrections. But it is not recommended to use its signals in the speculative market.
What this means is that this tool can be used to identify moments of the global reversals in the medium-term trading, but you shouldn’t forget about its main drawback − the lag. It is the problem that is usually solved by careful adjustment of the Envelopes parameters.
The Envelope indicator is the most effective in the pulse systems and in the return-to-average strategies: its lines are not redrawn, the signals do not allow a double interpretation, which actually provides this indicator with the «right to life».
After all the sides of the indicator were revealed, it is right the time for you to try either it will become your tool #1 for trading.
FAQ
What is the Envelope theory of trading?
The Envelope theory of trading involves using bands drawn above and below a moving average to analyze price trends and volatility. These bands help identify potential buy and sell signals. When the price touches the lower band, it may indicate oversold conditions and a buy opportunity, while touching the upper band suggests overbought conditions and a sell signal. The strategy is often combined with other indicators for better accuracy.
How do you read an envelope indicator?
To read an Envelope indicator, observe the price’s interaction with the upper and lower bands. When the price touches the upper band, it may be overbought, suggesting a potential sell signal. Conversely, touching the lower band indicates oversold conditions, signaling a potential buy. Breakouts above or below the bands can indicate strong trends. Use these signals in conjunction with other indicators for confirmation.
What is the Moving Average Filter Envelope?
The Moving Average Filter Envelope is a technical indicator that consists of a central moving average (simple or exponential) with two bands placed above and below it at a fixed percentage distance. These envelopes act as dynamic support and resistance levels, helping traders identify overbought or oversold conditions. The filter smooths price data to reduce noise, while the envelopes provide visual cues for potential trend reversals or continuation signals.
 Try Forex Tester Online
 ไทย
ไทย
 Tiếng Việt
 Polski
 Türkçe
 Nederlands
 Română
 한국어
한국어
 Svenska

