Summarize at:
How to spot real currency moves before the market catches on — and why retail traders are often late to the party
Author: Paul Sanders, Financial Source, specially for Forex Tester Online.
In early morning London trade, you’re watching the pound quietly drift sideways. There’s no data on the docket. No scheduled speeches. Just a typical pre-market calm. But then, a single news flash hits the wire: “BoE’s Bailey says MPC prepared to cut more if jobs data weakens.”
You blink. Nothing major, right?
But within minutes, the market starts shifting. The pound loses ground — not just against the dollar, but across the board. GBP/CHF, GBP/NZD, GBP/CAD all start sliding. You check your chart, but it’s already moved. Did you miss something?
This is where professional traders have an advantage. Because while you were deciding whether Bailey’s words mattered, they were already acting — armed with live interest rate expectations, sensitivity models, and volatility maps that told them, almost instantly, what the market was thinking. They weren’t reacting to headlines. They were responding to repricing.
In this article, we’re going to unpack the three key secrets institutional traders use when navigating interest rate shifts. And we’ll show you how tools like the Interest Rate Probability Tracker can help you spot real opportunities before the move is over.
Disclaimer: “The views and strategies discussed below represent the author’s opinion based on market analysis. This content is for educational purposes and does not constitute financial advice.”
Secret #1: Interest Rate Expectations Create Predictable Trading Opportunities — Every Month
One of the most overlooked sources of edge in FX trading is hiding in plain sight: the central bank meeting calendar.
Every month, major central banks like the Fed, ECB, and Bank of England meet to decide on interest rates. And before each meeting, the market forms a view about what that central bank will do. These expectations are expressed in the Overnight Index Swap (OIS) market, and the Interest Rate Probability Tracker translates that data into something every trader can read: a real-time, evolving probability of hikes, cuts, or holds.
But here’s the catch: the market doesn’t always agree.
Imagine it’s 10 minutes before a central bank decision, and the tracker is still showing a 55% chance of a hike. That means almost half the market is expecting something else. In other words, no matter what happens, someone’s going to be caught offside — and that means volatility.
Institutional traders know this. They use the tracker to flag mispriced or indecisive expectations, especially in the final hours or minutes before a rate decision. The wider the uncertainty, the greater the opportunity — because the resulting repricing tends to be fast and aggressive.
And this isn’t just a one-off strategy. These scenarios repeat every month across multiple central banks. With the tracker, you can scroll through upcoming meetings and see — at a glance — where the biggest gaps between market pricing and central bank action might lie.
That’s what makes this tool so powerful. It doesn’t just help you respond to market moves. It helps you anticipate them — before the volatility hits.
Secret #2: The Market Can Lie — But Interest Rate Expectations Reveal the Truth
We’ve all been there. A central banker makes a statement, or a big data release hits the wires. The market spikes in one direction. But is it real?
Is this the start of a sustained move — or just noise?
This is where institutional traders lean on the OIS market as a truth detector. And when combined with an Interest Rate Probability Tracker, it becomes a powerful confirmation engine.
Confirmation Signal #1: Did the Market Actually Reprice?
Let’s go back to the example of Bank of England Governor Andrew Bailey. He suggests that the central bank could ease policy faster if labor market conditions weaken.
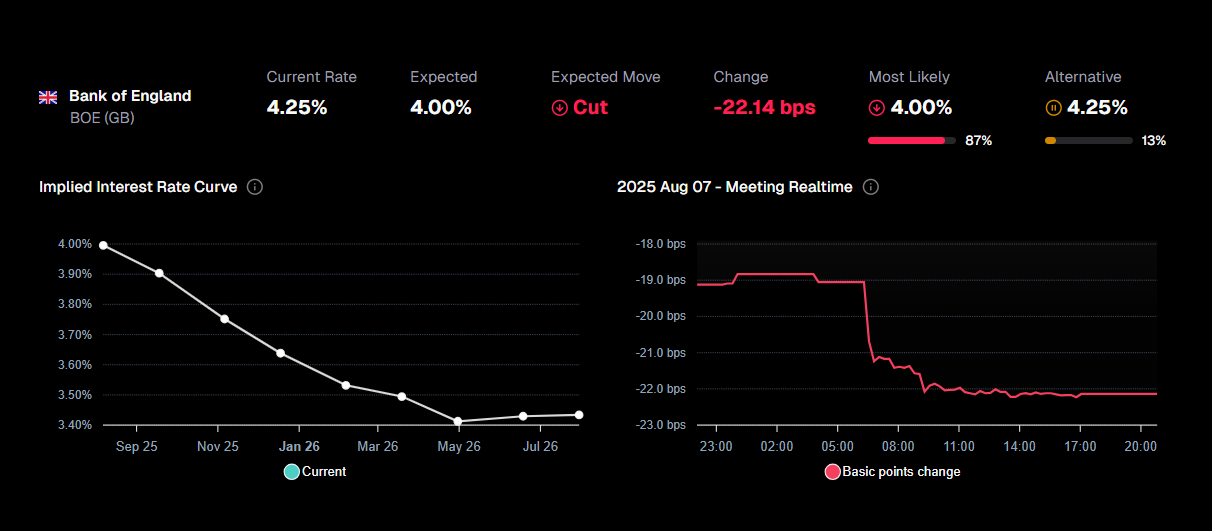
At first glance, it’s just another comment. But institutional traders immediately check the tracker — and it shows that the market increased the expected basis point cut from -19bps to -22bps through the rest of the NY session.
That’s not speculation. That’s real money adjusting to a new reality.
And that’s the first use of the tracker: confirmation. You’re not reacting blindly to a headline. You’re confirming whether that headline moved actual rate expectations. If the OIS market repriced, it’s a signal the market took the comment seriously — and the trade bias is likely valid.
But what happens after the move? You missed the initial drop. Now the market is pulling back.
Confirmation Signal #2: Is This Pullback a Trap — or a Setup?
Pullbacks happen. Traders take profit. Markets digest new information. But should you treat a pullback as a chance to trade in the original direction — or as a sign that momentum is fading?
This is where the tracker shines again.
If, after the initial drop in GBP/USD or GBP/CHF, the interest rate tracker continues to show elevated expectations for easing — the bias remains intact. The pullback is a setup. Not a reversal.
This gives traders the confidence to re-enter on retracements, knowing that the broader macro narrative hasn’t changed. The tracker becomes a real-time confirmation that market pricing still supports the original directional thesis.
In the Bailey case, this is exactly what happened. Even as price pulled back intraday, the rate cut expectations held steady. And so GBP continued to weaken throughout the session across multiple pairs.
That’s the second layer of edge: not just reacting to the move — but having confidence to join the trend on pullbacks, based on continued confirmation from rate expectations.
Secret #3: Not All Pairs Are Created Equal — Smart Traders Match Weakness With Strength
Once you’ve confirmed a shift in expectations, the next question is: where do I express the trade?
This is where many retail traders falter. They default to their favorite pair — EUR/USD, GBP/USD, USD/JPY — regardless of context.
Institutional traders know better. They want to pair the currency under pressure with the one showing the most resilience.
How to do that like a pro
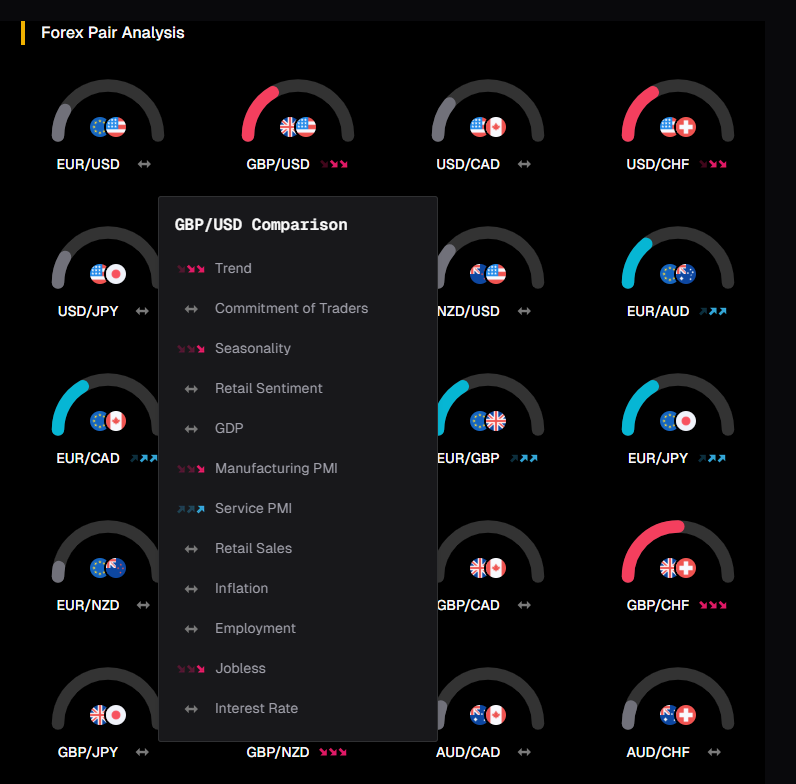
Professional desks use strength overlays — proprietary rankings that combine macro trends, rate cycles, sentiment flows, and recent data performance to score each currency. The idea is simple: match the weakest currency with the strongest.
In the GBP case, the ranking revealed:
- GBP: weakening (due to dovish repricing)
- CHF: strong
- USD: strong (data still hot, Fed on hold)
- NZD: slightly strong
- AUD: neutral
This immediately narrows focus to:
- GBP/CHF
- GBP/USD
- GBP/NZD
No guessing. No bias. Just structured, data-backed positioning.
Each of those pairs followed through with clean downside trends that aligned perfectly with the rate story. And because the rate repricing was sustained, traders could add on pullbacks with confidence.
Final Word: You Can’t Control the News — But You Can Control How You Respond
The market is a living organism, constantly adjusting to new information. But it doesn’t adjust randomly. It adjusts through expectations — specifically, how expectations about central banks evolve.
If you’re relying on delayed headlines, you’re already behind. But if you’re watching how the OIS market reprices after a comment or data print, you’re seeing the true reaction unfold.
And when that repricing is clear, sustained, and supported by fundamental pair alignment — you’re no longer chasing.
You’re trading with purpose. With structure. With an edge.
So the next time a central banker speaks, don’t just ask what they said.
Ask: Did the market believe them?
And let the tracker show you the answer.
 Get Macro Tools + Forex Tester
 ไทย
ไทย
 Tiếng Việt
 Polski
 Türkçe
 Nederlands
 Română
 한국어
한국어
 Svenska


