Summarize at:
In the global trading system of Trade Chaos Williams, Gator Oscillator plays the role of an additional filter of the “sleep” and “hunt” periods for the Alligator, so it is usually used in conjunction with its “big brother”.
Because of the unconventional interpretation, this oscillator can cause misunderstanding among beginners, but the benefit from its application becomes more obvious with some trading experience.
So let’s begin.
Logic and purpose
According to the author the main goal of the indicator is to simplify the overall strategy’s performance and make its signals more understandable. Gator Oscillator indicator is considered a complement to the Alligator indicator, as a rule is used together with it and it shows the degree of the convergence/divergence of its three moving averages.
As a result, the histogram shows clearly the trend/flat periods and duplicates the moments of the Alligator’s input during the “wakeful” period. The minimum amplitude of the Gator means the weak activity of the main indicator.
Calculation procedure
Gator Oscillator represents two interconnected histograms above/below a zero line. The formula is similar to the “classical” MACD oscillator, but with some difference:
- there are no signal lines;
- settings of three moving averages of the Alligator are added.
Calculation is carried out as follows:
Histogramm(1)=Abs(SMMA(MedianPrice,13,8) – SMMA(MedianPrice,8,5))
Histogramm(2)=(-1)*Abs(SMMA(MedianPrice,8,5) – SMMA(MedianPrice,5,3))
SMMA(i)=(Sum(1) – SMMA(i-1)) + MedianPrice(i)/n
where:
- SMMA(i) − the value of the smoothed moving average of the current bar (not including the first);
- Sum(1) − is the total amount of MedianPrice per N periods, starting from the previous bar;
- SMMA(i-1) − smoothed value of the moving average of the previous bar;
- SMMA(MedianPrice,13,8), SMMA(MedianPrice,8,5) and SMMA(MedianPrice,5,3) − moving average indicators Alligator;
- N − number of calculation periods;
- MedianPrice(1) −is the average (median) price of the current bar or MedianPrice=(HighPrice+LowPrice)/2.
The upper histogram is the absolute difference between blue and red lines of the Alligator; the lower histogram represents the difference between the values of the red and green lines.
The «-1» factor is required to display the second histogram in a negative value range.
Bar of the histogram are painted in traditional colors, depending on the dynamics:
- red bar − current value is lower than the previous one;
- green bar − current value is higher than the previous one.
Parameters and control
The indicator is located in an additional window under a price chart and consists of the two histograms which are separated by a zero line.
One histogram is in a positive zone, another − in negative (see also Awesome Oscillator).
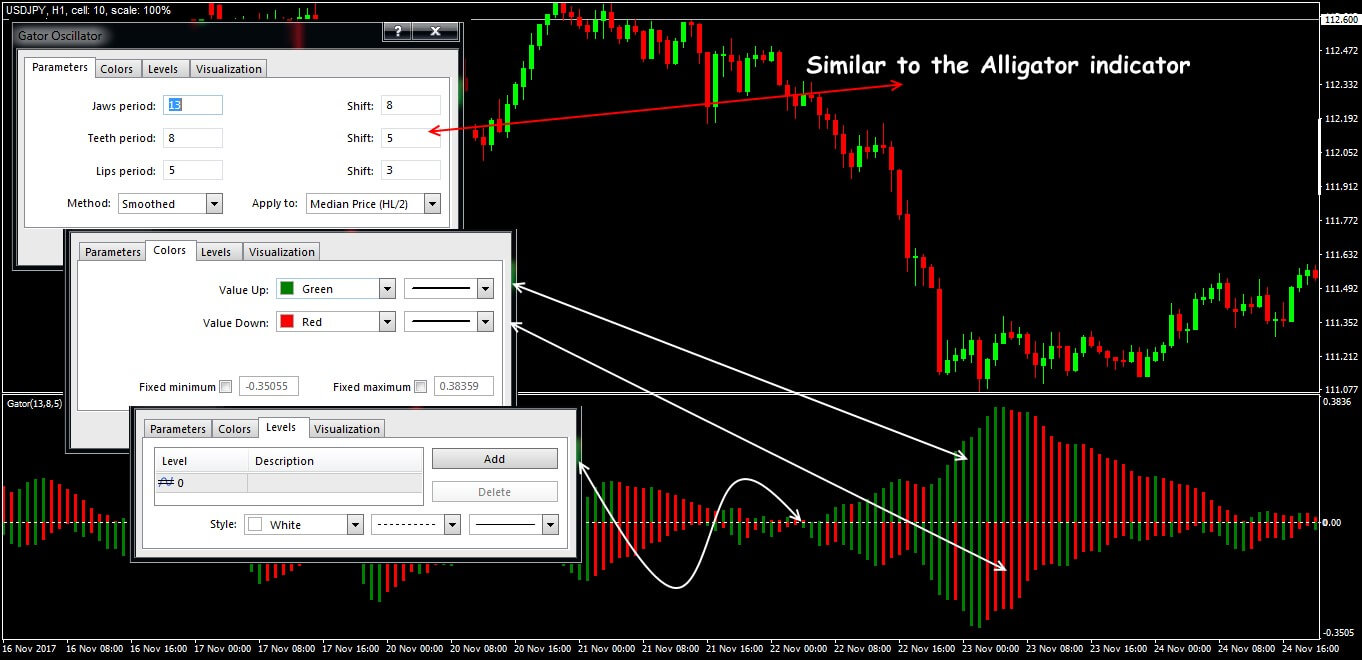
Standard version of the indicator Gator Oscillator
The settings correspond to the parameters of the Alligator’s moving averages, so there is no sense to change them. From personal practice: it is better to change the standard color scheme to some other color pair: the standard color scheme can disorient trader, since in this case the green histogram does not mean an uptrend, just like the red histogram doesn’t mean the downtrend.
The main difference between Gator Oscillator and conventional oscillators is that the color of the histogram shows only the activity of the market and is in no way connected with the direction of the trend. During operation, the histogram changes color depending on the difference in values between the current and previous values.
Why this happens and how it can be used in practice –
Let’s look at it in detail.
Trade signals of the indicator
Emergence of the max/min on histograms means presence of a strong trend at the market. Max of the upper histogram matches the period of the greatest discrepancy of the “Jaws” and “Lips” lines of the Alligator.
Respectively, min of the lower histogram indicates the maximum discrepancy of the “Lips” and “Teeth” lines. If the indicator oscillates near the zero level, it indicates the end of the current trend or its absence.
Standard situations for the Gator Oscillator
The result?
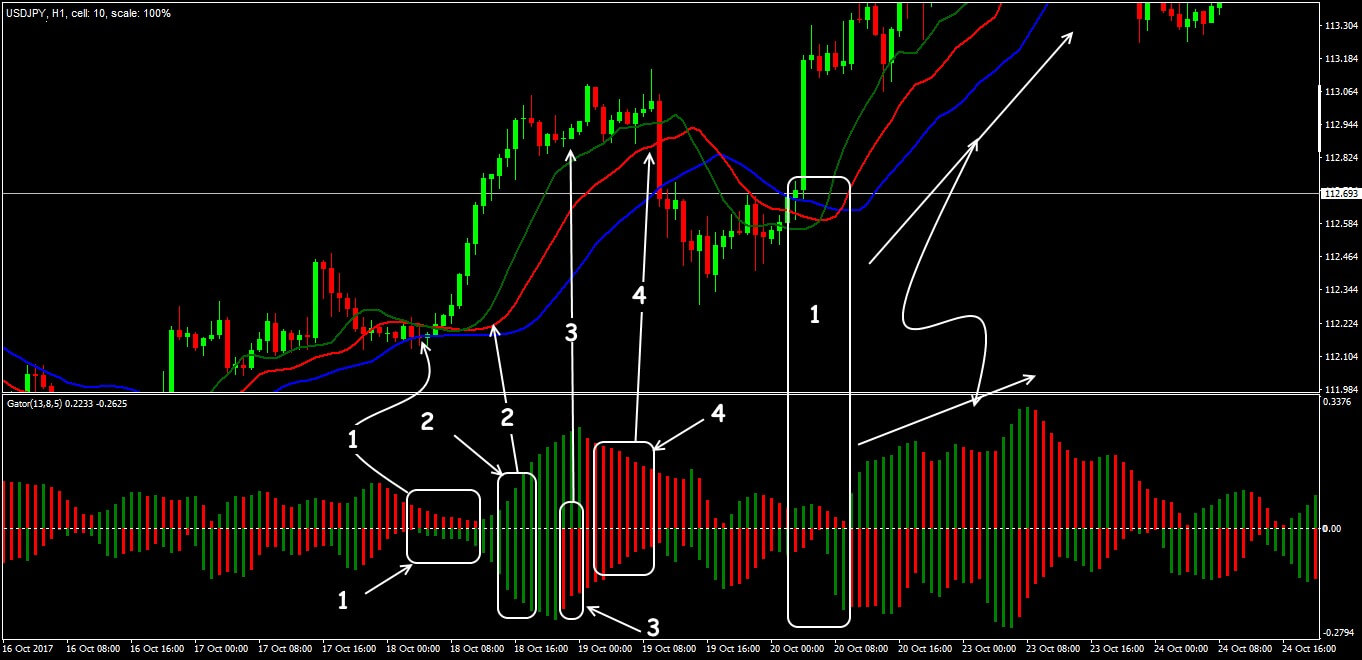
Let’s have a closer look at the basic states of the Alligator lines and the corresponding scheme at the Gator Oscillator histograms:
- Alligator “wakes up”: histograms are of different colors, the amplitude grows, there are prerequisites for a new trend.
- Alligator “eats”: both histograms are green, market trend enters active phase.
- Alligator is “saturated”: red bars appear at one side, amplitude decreases, the trend gradually slows down, and trades are closed or partially fixed.
- Alligator is “asleep”: both histograms are red, the amplitude is weak, it is better to refuse any transactions − the market is flat.
And where are the entry points?
Ideal for opening a trade is the situation where Gator Oscillator shows only green bars with a growing amplitude, which indicates the beginning or continuation of a strong trend. Of course, there is a traditional delay on the histogram, and therefore Gator Oscillator is not recommended as the main element of the trading strategy.
Application in trade strategy
Gator Oscillator was created as an auxiliary tool for trading using the Alligator indicator, so it gives practically the same signals.
In fact, this is a modification of the Alligator indicator, which turns a system of three moving averages into a normal oscillator. The trade is always opened in the direction of the balance of the main indicator’s lines (see also here).
Gator Oscillator + Alligator: basic signals
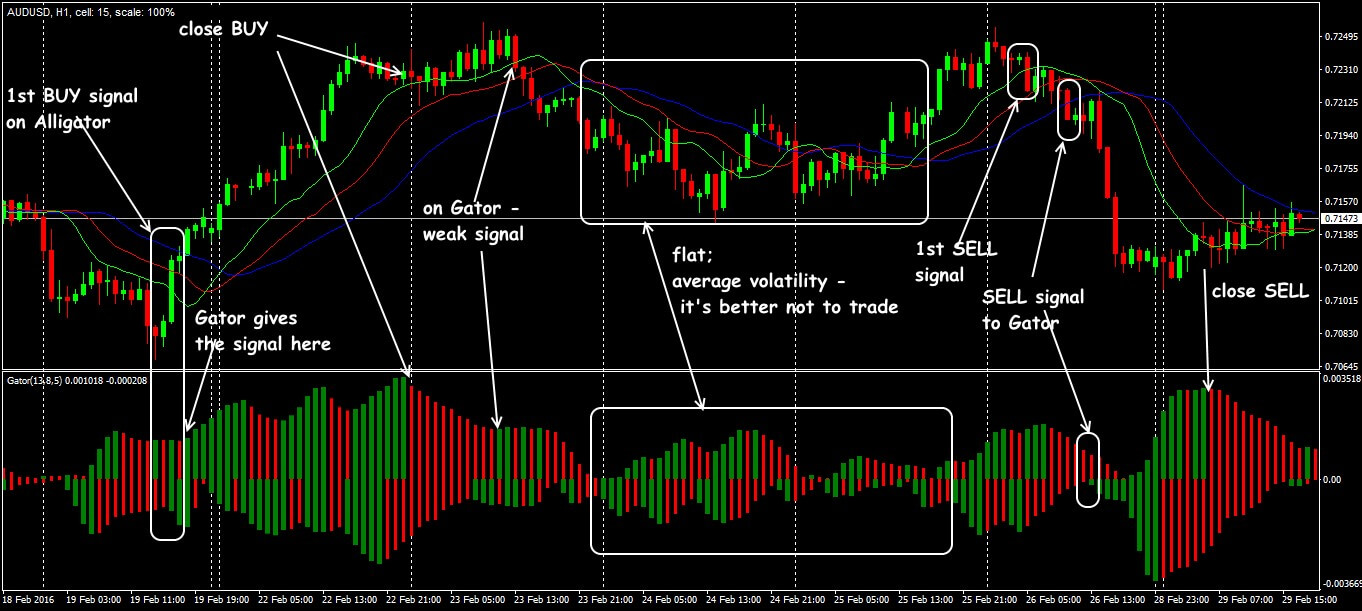
With the help of the Gator Oscillator it is convenient to determine the prospects of the balance lines cross.
A reliable signal for the trade opening is the appearance of a large green bar, which confirms the presence of a strong trend in the market. But in any case, it is recommended to give the priority to the Alligator’s signals before entering a trade.
Gator Oscillator+Alligator: double interpretation
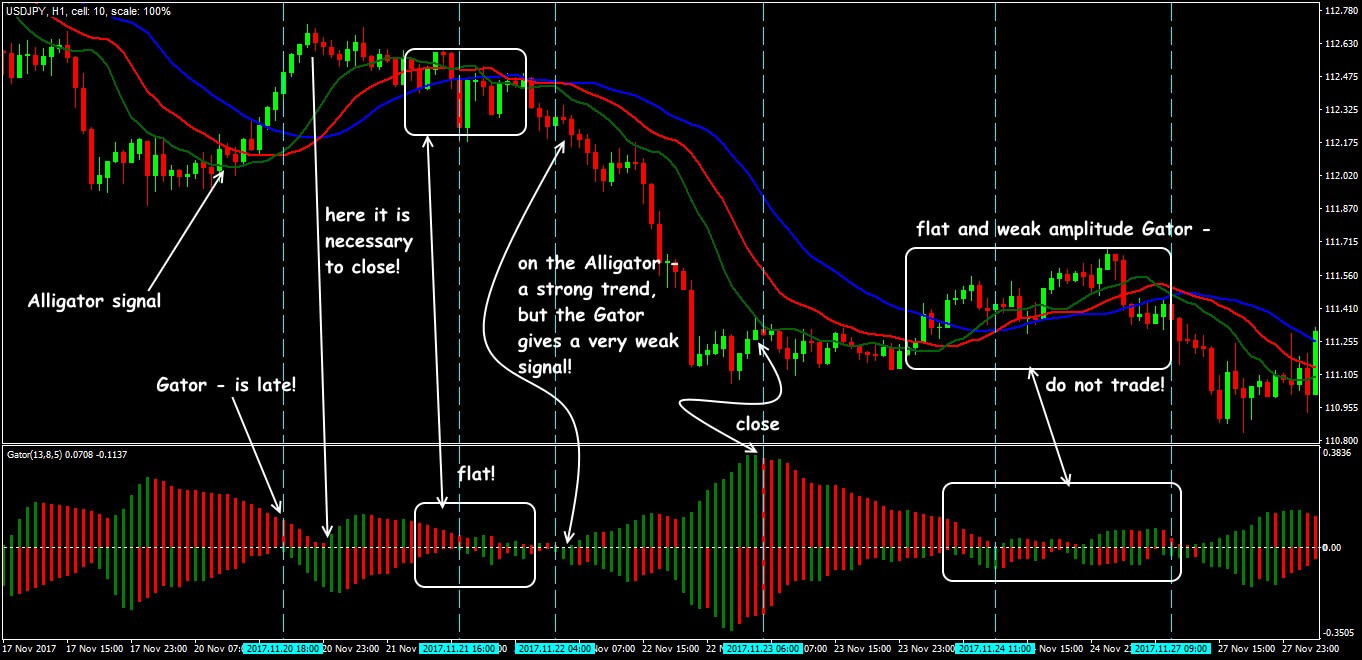
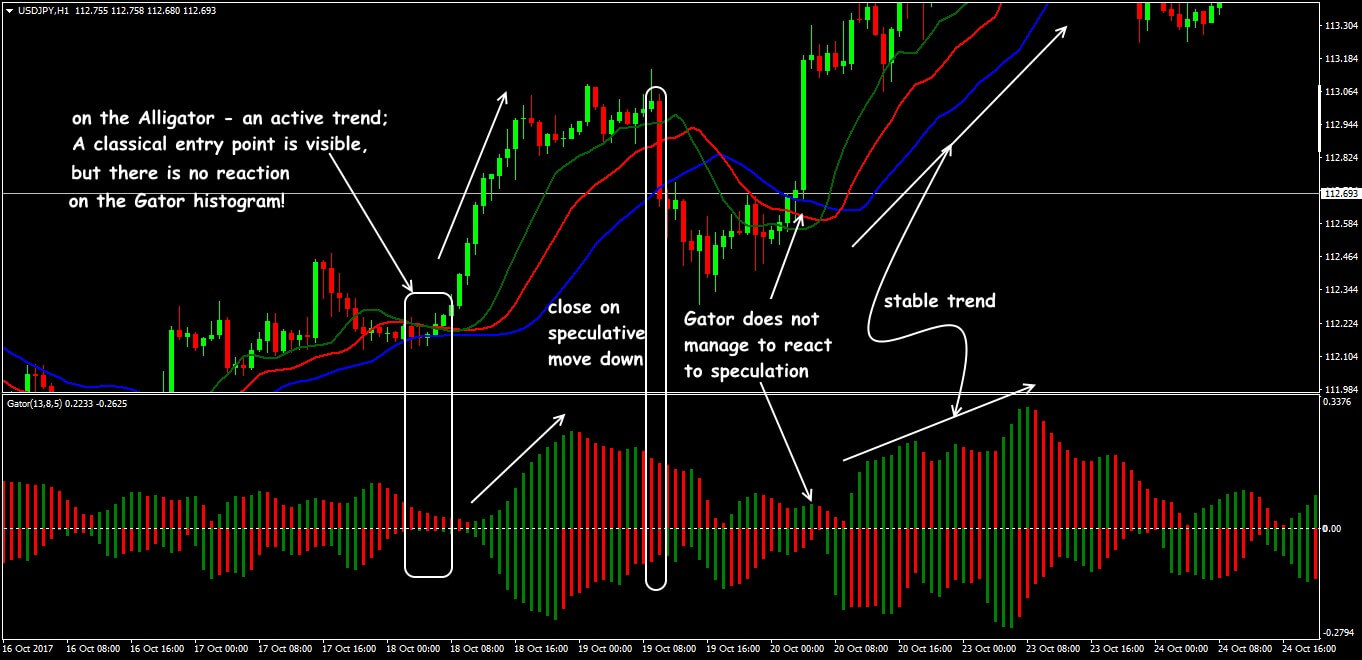
Not always both indicators work synchronously, as a rule, Gator Oscillator is late.
During the periods of an unstable trend, this is beneficial − the entry point will be more reliable. But on a strong trend, the signal appears when the half of “path” is already passed − it’s too late to open a trade. The screen above shows problem situations.
Gator Oscillator + Alligator: problematic options
In addition to the fact that Gator Oscillator does not always give clear signals when to open the trade, it can generate incorrect signals about the trade exits (red histogram on the both sides), therefore confirmation from the additional indicators is mandatory.
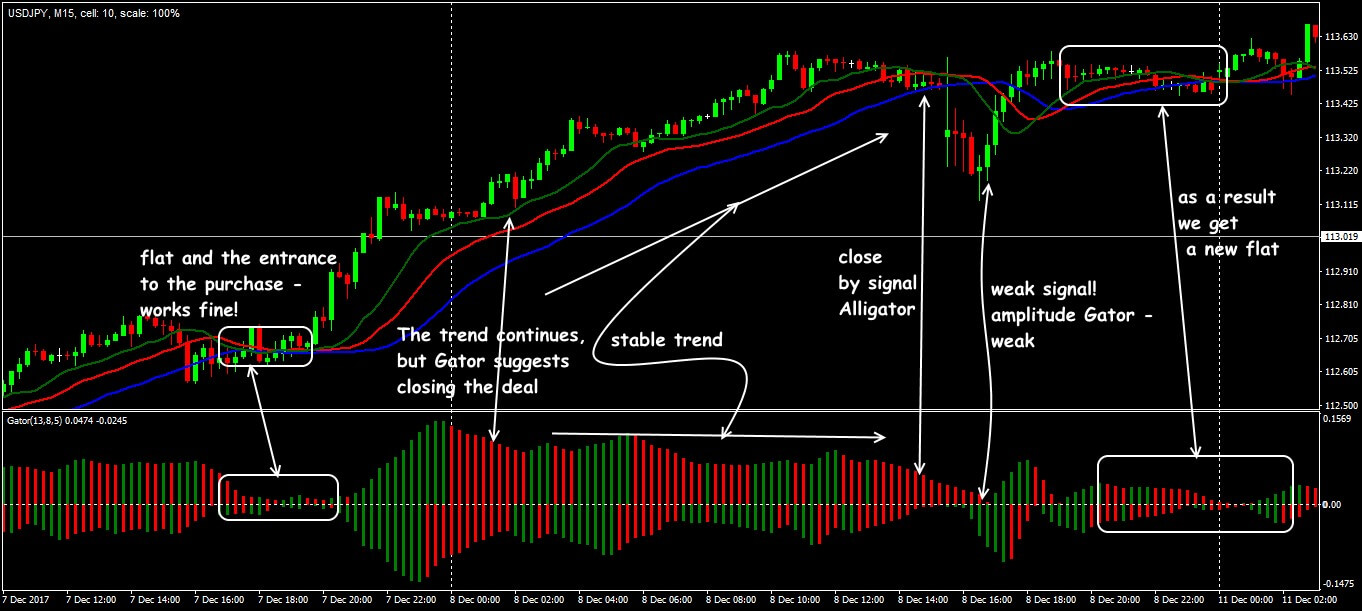
Gator Oscillator + Alligator: trend trading situations
The most reliable strong trend signals can be considered at the extreme points of the histogram (max/min) – a trader can trust them completely.
In any case, when a potential entry point on Alligator indicator appears, you need to pay attention to the amplitude of the Gator Oscillator histogram.
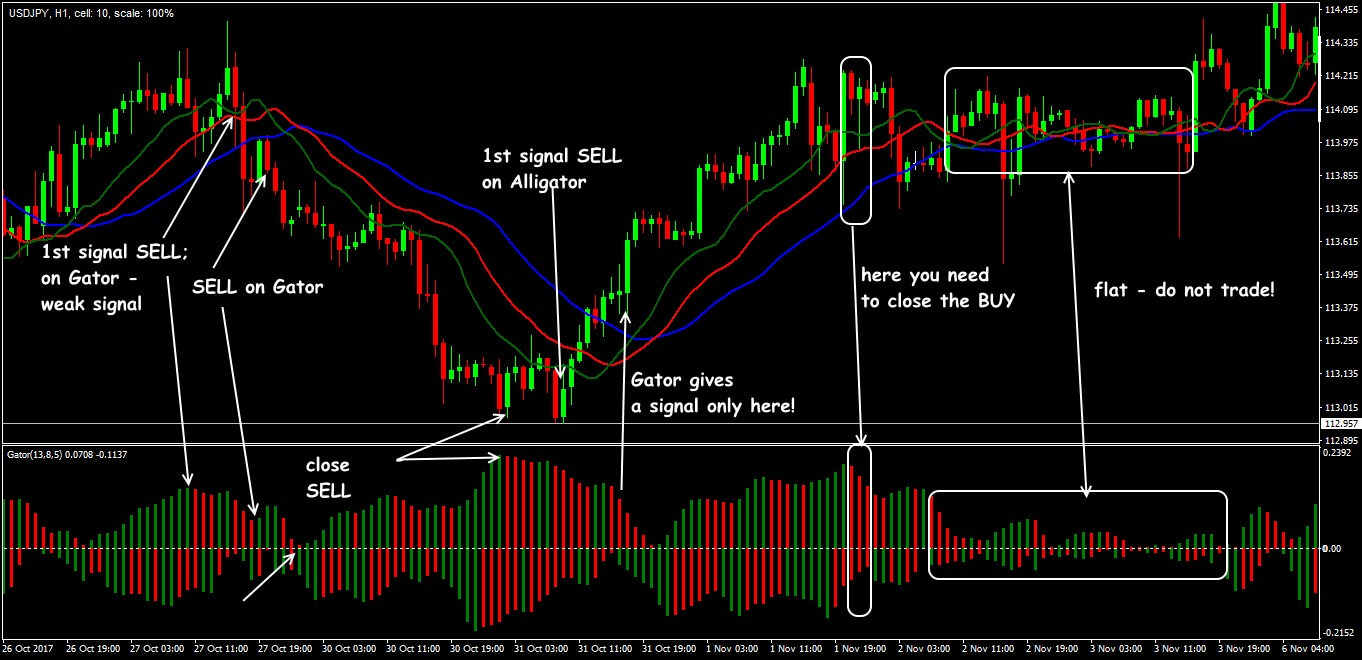
Options for the trading schemes of the Gator Oscillator + Alligator
Each trader independently decides which of the signals − on the histogram or on the moving averages − are considered stronger, but the traditional Alligator indicator still looks more confident (see here).
Several practical remarks
Not all color “signals” on the Gator Oscillator’s histogram have a reliable, and most importantly, unambiguous interpretation. During the flat periods indicator constantly changes its signals − in such conditions an inexperienced trader can perform a series of the unprofitable trades.
What this means is:
The Gator Oscillator is considered as an auxiliary tool and is not usually used on its own. It has one main task − to filter the flat periods and show the moments of the Alligator’s lines crossing.
Typically, in real strategies, this indicator is used by the active followers of Bill Williams, but necessarily it should be complimented with the other tools.
Try It Yourself
After all the sides of the indicator were revealed, it is right the time for you to try either it will become your tool #1 for trading.
In order to try the indicator performance alone or in the combination with other ones, you can use Forex Tester Online with the historical data that comes along with the program.
Simply try Forex Tester Online. In addition, you will receive 23 years of free historical data (easily downloadable straight from the software).
Share your personal experience of effective use of the indicator Gator Oscillator. Was this article was useful for you? It is important for us to know your opinion.
 Test Indicators on FTO
 ไทย
ไทย
 Tiếng Việt
 Polski
 Türkçe
 Nederlands
 Română
 한국어
한국어
 Svenska
