English
 Deutsch
 Italiano
 Français
 Português
 ไทย
ไทย
 Tiếng Việt
 Polski
 Türkçe
 Nederlands
 Română
 한국어
한국어
 Svenska
 Español
Gold moves on dollar strength, real yields, central bank buying, and headline risk, often at the same time, and a setup that prints clean signals during a quiet grind can behave completely differently once an inflation print or a banking scare hits. A backtest that only samples the calm stretch isn’t measuring the strategy. It’s measuring the sample.
This guide covers how to set up a gold backtest that actually holds up: which platform fits spot, CFD, or futures trading, how to test hypotheses fast instead of scrolling chart for hours, and how to make sure a strategy has been checked against more than one market regime before it goes live.
Step one: know what you’re trading
Before opening any backtesting tool, decide whether the plan is to trade spot XAUUSD, a CFD, or GC futures on CME. This isn’t a technicality. It determines which platform actually makes sense.
Spot and CFD gold trade close to continuously with a broker-quoted price and no expiry. CME gold futures roll on a quarterly cycle, settle at an official settlement price, and carry contract-specific tick values. Backtesting on a CFD price feed with fractional lots and no rollover mechanics, when the real plan is to trade futures, builds habits that don’t transfer. Pick the backtesting environment based on where trades will actually be placed, not the other way around.

Backtest gold the right way
Replay real historical ticks for gold with realistic order execution
Step two: pick an environment built for backtesting, not just charting
Once that’s settled, the next decision is where to test. Most traders land on one of three options, and it’s worth being honest about what each one is actually good for.
A demo account on MT4 or a broker platform allows trading forward in real time. That’s fine for practicing execution, but it’s a poor way to validate a strategy. Testing one setup a week means it takes years to build a sample size that means anything.
TradingView sits in the middle. The charting and the indicator library are genuinely excellent, and for watching gold move and marking up levels, it’s a great tool. But its backtesting is closer to an afterthought: on lower plans the history is capped at a few thousand bars, and the built-in replay wasn’t built to simulate order execution, spread, or contract mechanics the way a dedicated backtester is.
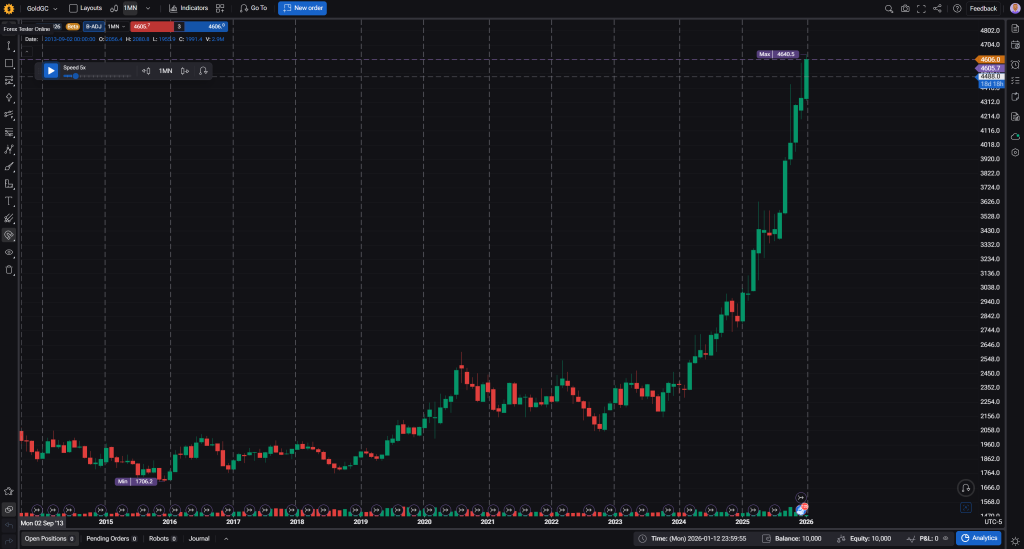
A specialized backtesting platform, like Forex Tester Online, is a different category. Think of it less as “another chart” and more as a time machine: instead of scrolling forward bar by bar hoping something interesting happens, it replays real historical ticks with realistic order execution, so a year of gold history can be tested in an afternoon instead of a year. That distinction matters more for gold than for most instruments, because gold’s character shifts across regimes, and a platform that can only show the last few thousand bars simply can’t cover enough of that history to matter.
Step three: build a system, then find out where it breaks
For an algorithmic strategy, this part is comparatively easy: code the logic, run it, and optimize either by hand or with the platform’s built-in optimizer (MT5 has one for Expert Advisors, for instance).
Manual and discretionary trading is harder, for an obvious reason: pure intuition doesn’t hold up over hundreds of trades. Rules are needed, even if there’s discretion built into how they get applied. That means testing a lot of hypotheses before risking real money or sitting a prop firm evaluation: does this setup work better in the London session or the US session? Does a wider stop actually improve the win rate on gold, or just delay the loss? Which time-of-day filters help and which just feel like they should?
The problem is that checking each of those ideas manually is slow. On a demo account it’s painfully slow. Even in a dedicated backtester, clicking through candle by candle to find the ten setups worth looking at eats an entire evening. The faster a specific hypothesis can be tested, the more hypotheses get covered before real capital is on the line.
Test hypotheses in minutes
Validate forex or futures gold setups efficiently
Skip the noise: jump straight to what matters
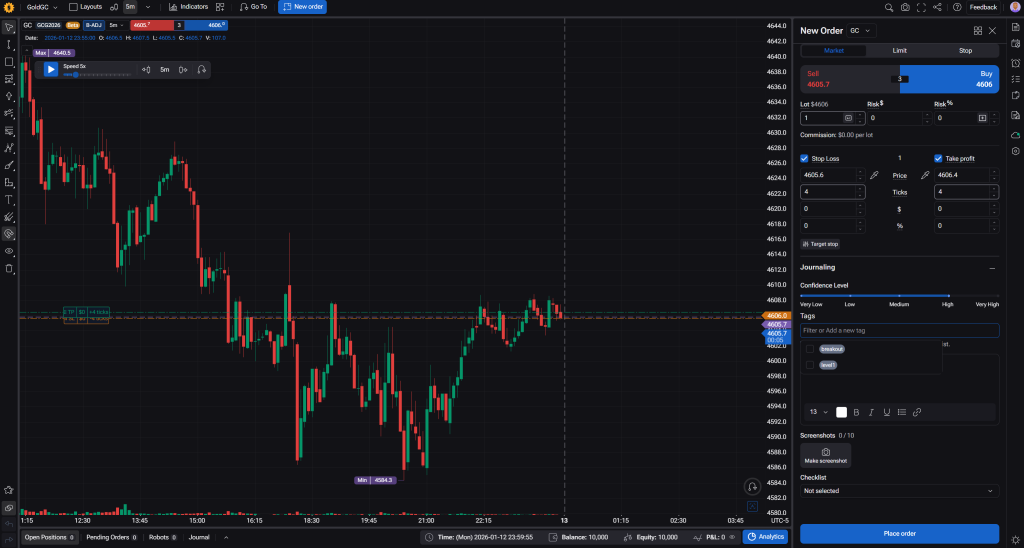
This is where a feature like FTO’s Jump To (GoTo) tool changes the math. Instead of scrolling candle by candle through hours of gold sitting flat, it jumps directly to the moment price crosses an indicator value, touches a drawn level, or hits an oscillator threshold. It can also jump straight to the open of a specific session, London for example, since gold’s most active hours often cluster there.
Nothing about the market gets skipped, only the parts that have nothing to do with the hypothesis currently being tested. That’s the difference between reviewing 50 relevant setups in an hour versus reviewing 50 hours of chart to find them.
Let the platform show what’s actually working
A backtester that only replays history leaves all the analysis to the trader. FTO’s Analytics section goes a step further and looks at trades already logged, then surfaces patterns that would otherwise take real digging to find: which sessions a setup performs best in, whether the stop distance is systematically too tight, where exits are leaving profit on the table.
That last part is worth calling out specifically for gold. It’s a volatile instrument, and bad exits erase more edge than bad entries do, more often than traders expect. It’s worth reading through how Exit Optimizer works: it takes logged gold trades and shows what the stop, target, and holding time would have looked like if they’d been set statistically rather than by feel, and now allows fixing just one of those parameters at a time when the rest of the process already works.
Test across regimes, not just the last six months
Gold in 2020 was not the same animal as gold in 2013, and it won’t behave like either of those next year. A strategy tested only against one calm stretch of price history hasn’t actually been tested. This is the part traders skip most often, usually because digging up the right historical window by hand is tedious.
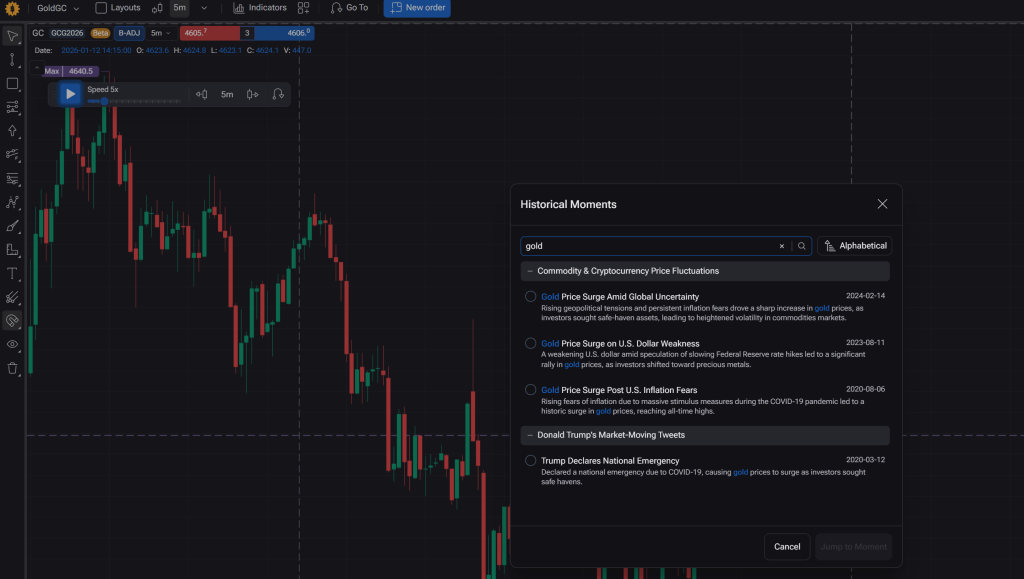
FTO’s tick data for gold goes back to 2014, so there’s enough runway to test across genuinely different conditions rather than one narrow slice. On top of that, the platform includes a library of preset historical scenarios that jump the chart directly to specific, named events: a gold price surge tied to inflation fears, a dollar-weakness rally, a geopolitical shock. Search, pick the moment, and the chart is already there.
A system that only holds up in one type of environment needs to be caught in a backtest, not three months into live trading.
Training for a prop challenge? Train inside the actual rules
A lot of gold traders end up in front of a prop firm evaluation at some point, and gold’s volatility makes daily drawdown limits the thing that actually eliminates most candidates, not the profit target. FTO’s Prop Challenge Simulation mode allows setting up a backtest with the same constraints a given firm will use, minimum trading days, max drawdown, max daily drawdown, profit target, so a system’s odds against those rules are known before paying for the evaluation.
Don’t backtest gold without volume
This is the part that gets skipped most often, and it shouldn’t be, especially on futures. Gold futures carry real, exchange-reported volume, and a strategy that ignores where size actually traded is working with half the picture. CVD, Big Trades, and Footprint show where institutional volume shows up inside a candle, not just what the candle’s OHLC implies happened. On an instrument this reactive to large flows, that’s not a nice-to-have. It’s part of reading the tape correctly.
The bottom line
Backtesting gold effectively isn’t about finding the platform with the prettiest chart. It’s about matching the backtest to the instrument that will actually be traded, covering enough history to see how it behaves across different regimes, and being able to test hypotheses fast enough to get through all of them before capital is at risk.
Getting started in FTO
The setup takes a few minutes:
- Open a project in Forex Tester Online and load XAUUSD (or GC futures, if that’s the plan) — over a decade of tick data, back to 2014, is available to pull from.
- Set spread, commission, and lot sizing to match the broker or prop firm actually being targeted, so the numbers coming out of the backtest mean something.
- Pick a date range that covers more than one regime: a calm stretch and at least one high-volatility period, using the preset historical scenarios if a specific event needs to be found quickly.
- Use Jump To to skip to the setups that match the hypothesis being tested, rather than scrolling bar by bar.
- Log every trade, then check Analytics and Exit Optimizer to see where the stop, target, or holding time actually needs adjusting.
Run through those five steps once and the difference between “a backtest” and a backtest that holds up under a real prop challenge or live account becomes obvious fast.
Disclaimer
This article is for educational purposes only and is not financial advice. Trading gold, CFDs, and futures carries risk of loss.
 Backtest Gold for Free
Backtest Gold Efficiently
Test your ideas, get the answers