Summarize at:
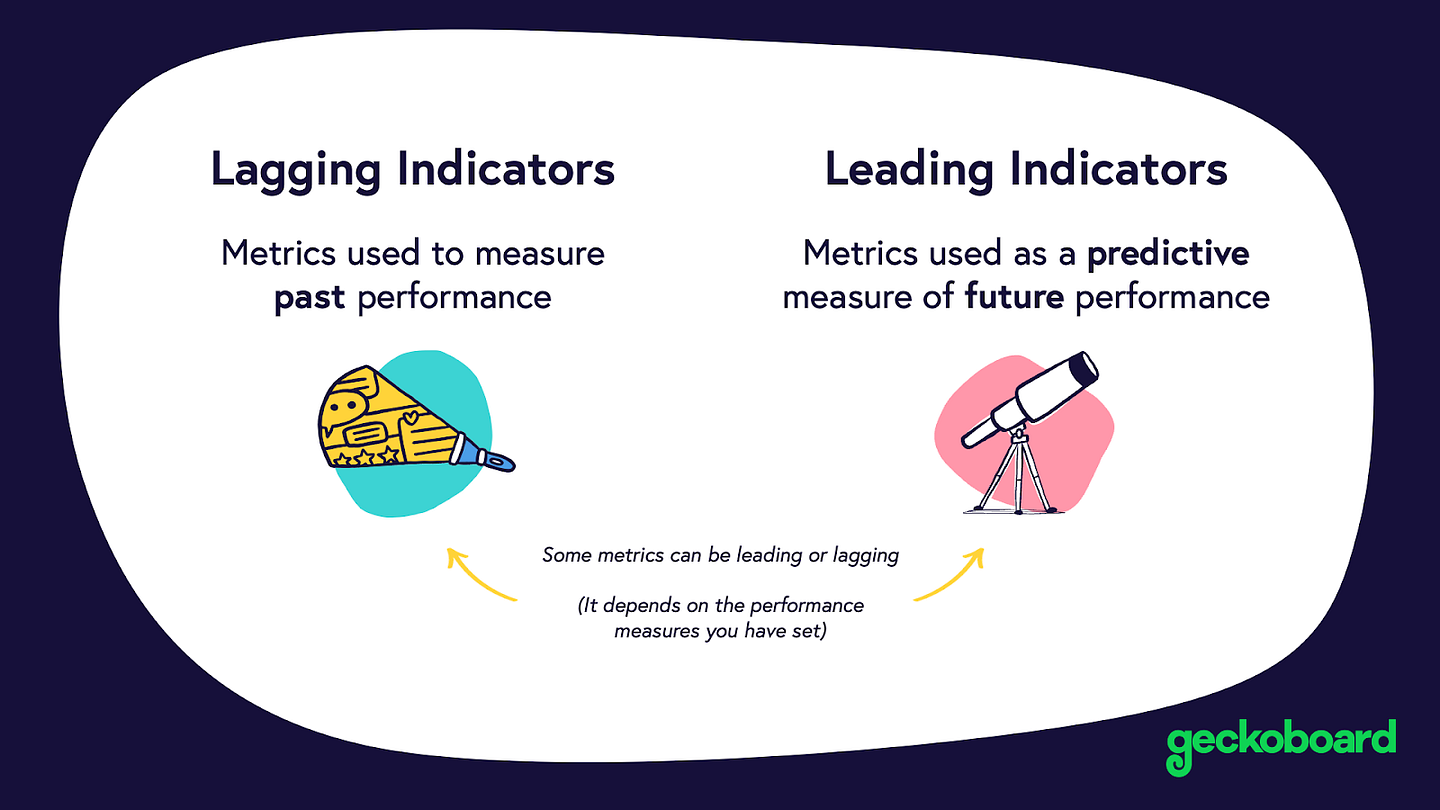
Trading indicators are core technical tools that track price movements. We use them to shape our trading strategy and spot market shifts. Leading and lagging indicators each serve a key purpose. Understanding both technical indicators is crucial for traders who want to predict moves and confirm trends.
What Is a Leading Indicator?
A leading indicator gives an early signal of possible price movements before they happen. We use them to spot shifts in momentum, trend turns, or overbought and oversold zones. Tools like RSI and the Stochastic Oscillator react to changes in market sentiment and volume. By acting ahead, leading indicators help us plan entry and exit points in our trading strategy.
What Is a Lagging Indicator?
A lagging indicator follows price action and confirms trends after they form. We use them to verify a market’s direction or strength. Common tools include moving averages, MACD, Bollinger Bands, and ADX. They smooth out noise and help us avoid false signals. By waiting for confirmation, lagging indicators guide us in validating entries and exits.
Leading VS Lagging Indicators: Examples of Practical Application
So, leading or lagging indicator? Leading indicators help us spot potential reversals early. For example, we watch RSI when it dips below 30 and then rises back above. That signals an oversold bounce before price turns up. Meanwhile, the Stochastic Oscillator can flash a bullish crossover under 20, warning us of an incoming rally.
Lagging indicators, on the other hand, confirm trends after they’re underway. Imagine price breaking above a 50-period moving average. We wait for a close above it before trusting the uptrend. We might also check MACD: when its signal line crosses above the MACD line, it validates that momentum has truly shifted higher.
In practice, we might enter a long trade when RSI turns up from oversold and price closes above the moving average. We then use MACD’s crossover and ADX rising above 25 to confirm trend strength. This keeps us from chasing false moves and ensures we join strong trends.
By blending both types, we catch early signals while avoiding traps. We seek an RSI or Stochastic alert, then use moving averages or MACD for confirmation. This layered approach improves timing, reduces whipsaws, and balances risk.
Leading Indicators for Traders List
Leading indicators give us early warnings. We use them to catch moves before they happen. Here are four top tools regarding technical indicators.
RSI (Relative Strength Index)
RSI measures recent gains versus losses. Formula:
RS = Average Gain ÷ Average Loss
RSI = 100 − (100 ÷ (1 + RS))
Signals:
- Above 70 = overbought
- Below 30 = oversold
- Bullish/bearish divergence vs price
Best practices:
- Use a 14-period default
- Watch for crossovers of 50 to gauge momentum
- Pair with trend filters to avoid fake signals
Learn more: RSI vs MACD / Market and RSI / RSI + AO / Ichimoku + RSI / RSI + 2 MAs / EMA + RSI / Bollinger Bands + RSI Stochastic
Stochastic Oscillator
Stochastic compares closing price to its range. Formula for %K:
%K = (Close − Lowest Low) ÷ (Highest High − Lowest Low) × 100
Signals:
- %K crosses %D for buy/sell
- Readings above 80/under 20
- Divergences vs price
Best practices:
- Default 14,3,3 settings
- Confirm with trend direction
- Avoid trading in extreme ranges
Learn more: 1-Minute Settings / Two Stochastics
Pivot Points
Pivot = (High + Low + Close) ÷ 3.
Support/Resistance levels derive from that.
Signals:
- Price bounces off pivots
- Breakouts signal continuation
Best practices:
- Use daily pivots for intraday trades
- Combine with volume spikes
- Watch cluster zones for strong levels
On-Balance Volume (OBV)
OBV adds volume on up days, subtracts on down days.
Signals:
- Rising OBV confirms uptrend
- Falling OBV confirms downtrend
- Divergences warn of reversals
Best practices:
- Use longer OBV trendlines
- Pair with price action
- Ignore small, choppy volume shifts
Next up: Lagging Indicators for Traders List.
Lagging Indicators for Traders List
Lagging indicators confirm price moves after they form. We use them to filter noise and time entries. Here are four key lagging tools.
Moving Averages
Moving averages smooth price over a set period.
- SMA formula: Sum of closes ÷ period
- EMA formula: Close × (smoothing ÷ (1+period)) + prior EMA × (1−(smoothing ÷ (1+period)))
Signals:
- Price crosses MA for entry/exit
- Fast MA crossing slow MA shows trend shift
Best practices:
- Use 50 & 200 periods for trend bias
- Watch MA slope, not just crossovers
Bollinger Bands
Bollinger Bands use volatility to set dynamic levels.
- Middle band: 20-period SMA
- Upper/lower: SMA ± 2 standard deviations
Signals:
- Price touching outer bands flags extremes
- “Squeeze” (narrow bands) hints at upcoming break
Best practices:
- Trade breakouts after squeeze
- Combine with momentum filters
ADX (Average Directional Index)
ADX measures trend strength, not direction.
Formula:
Smooths the difference between +DI and −DI
Signals:
- ADX > 25 signals a strong trend
- ADX < 20 means weak or no trend
Best practices:
- Confirm with +DI/−DI crosses
- Avoid trading when ADX is below 20
MACD
MACD tracks momentum via two EMAs.
- MACD line: 12-period EMA − 26-period EMA
- Signal line: 9-period EMA of MACD line
- Histogram: MACD line − signal line
Signals:
- MACD line crossing signal line gives buy/sell
- Divergence vs price warns of trend fatigue
Best practices:
- Use histogram peaks to spot momentum loss
- Trade in trend direction only
Common Mistakes to Avoid
We don’t rely on just one type of indicator.
We always check market context and volume.
We don’t chase every signal.
We avoid mixing indicators that give the same info.
We don’t ignore false breakouts or fake crossovers.
We stay patient and wait for clear confirmation.
Get Your Leading/Lagging Indicators Backtested with FTO
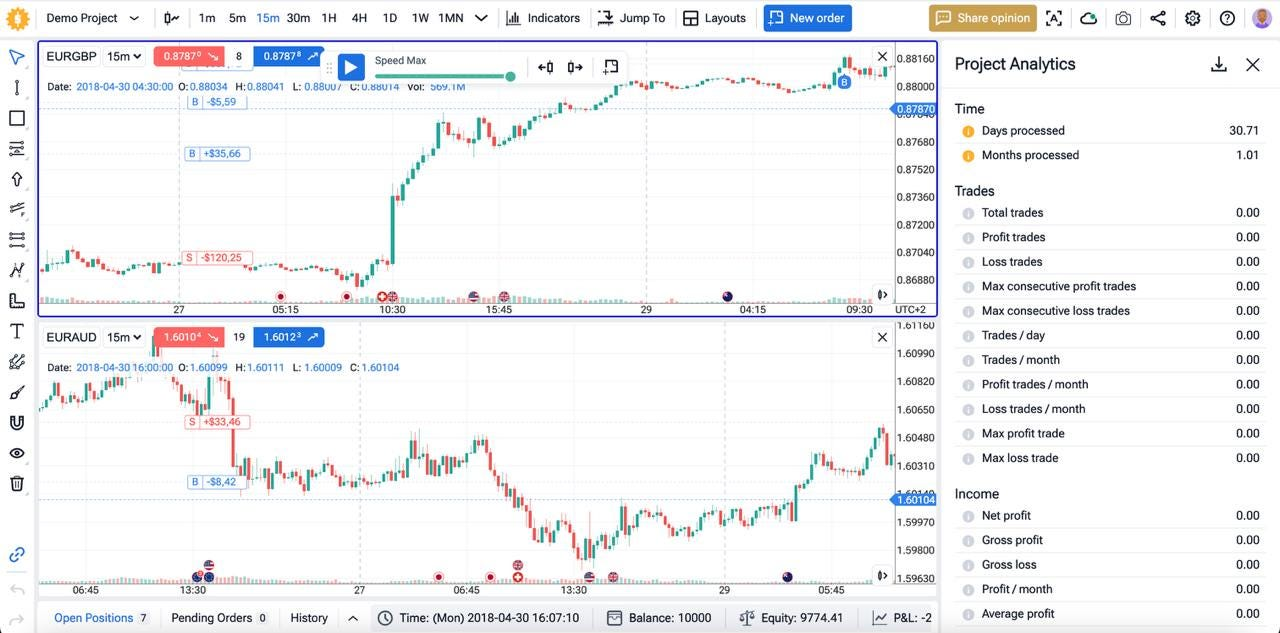
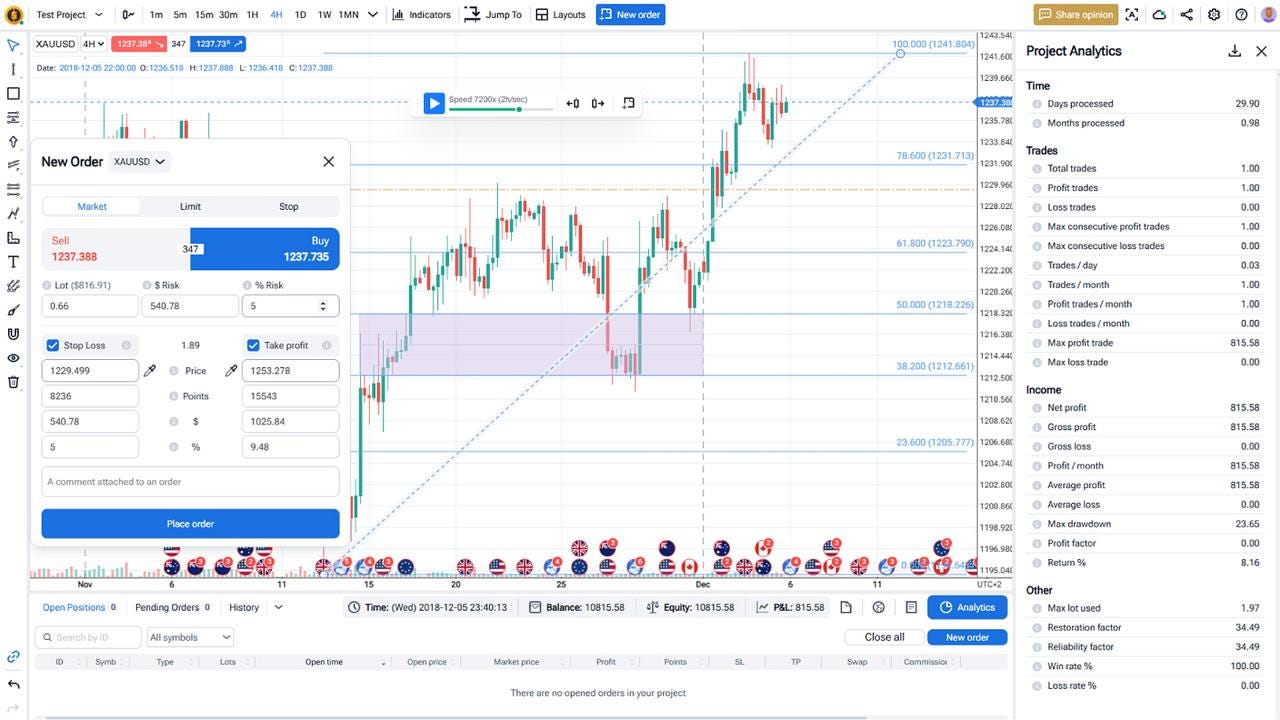
Testing indicators without data is a guess. We need proof. Forex Tester Online gives us that proof with historical market replay.
With FTO you can:
✅ Load real tick and minute data going back 21+ years
✅ Apply RSI, Stochastic, MA, MACD and more on any asset—forex, crypto, indices, stocks
✅ Simulate trades in real time to practice entries, exits, and risk rules
✅ See clear stats: win rate, drawdown, profit factor, and more
✅ Adjust indicator settings and rerun tests instantly
This turns our theories into facts. We find which leading or lagging combos work in bull, bear, and range markets. We refine parameters before trading live. Try FTO now and trade with confidence.
Conclusion
Leading and lagging indicators each have a role. Leading tools warn us of shifts before they happen. Lagging tools confirm trends and filter noise. Combining both gives clearer signals and tighter risk control. Backtesting with FTO proves what works in real markets. Use data, not guesswork. Stick to your rules, stay disciplined, and let indicators guide your strategy.
Disclaimer
The information here is for educational purposes only. Trading carries risks. Past performance does not guarantee future results. Always do your own research and manage risk before trading.
FAQ
Can I use indicators on any timeframe?
Yes. We can apply RSI, MACD, and others on ticks, seconds, minutes, hours or daily charts. Just match settings to the timeframe’s noise level.
How do I spot divergence?
We look for indicator peaks that don’t match price highs or lows. A falling RSI with rising price shows bearish divergence. A rising stochastic with falling price shows bullish divergence.
What’s the best way to combine indicators?
We pair a leading tool (RSI or stochastic) with a lagging one (MA or MACD). The first gives an early heads-up. The second confirms trend strength.
Can I trade around news with indicators?
Indicators lag in fast moves. We avoid trading right before or after big news. We wait for calm before using signals again.
What’s overfitting and how do I avoid it?
Overfitting is when settings only work on past data. We avoid it by testing over multiple years and market conditions. We stick to simple parameter ranges.
Are there free backtesting options besides FTO?
Yes. Some traders use TradingView’s free replay mode or MetaTrader’s built-in tester. However, we recommend using Forex Tester Online for the most detailed and reliable backtests.
Forex Tester Online
Backtest Leading/Lagging Indicators with FTO
 ไทย
ไทย
 Tiếng Việt
 Polski
 Türkçe
 Nederlands
 Română
 한국어
한국어
 Svenska


