English
 Deutsch
 Italiano
 Français
 Português
 ไทย
ไทย
 Tiếng Việt
 Polski
 Türkçe
 Nederlands
 Română
 한국어
한국어
 Svenska
 Español
If you’ve ever backtested futures and watched your equity curve jump overnight for no obvious reason, there’s a good chance a contract roll did it.
Rollovers were one of the things I most wanted to explain properly once CME futures arrived in Forex Tester Online. They sound like a technicality. In practice, they decide whether a multi-year futures backtest tells you the truth.
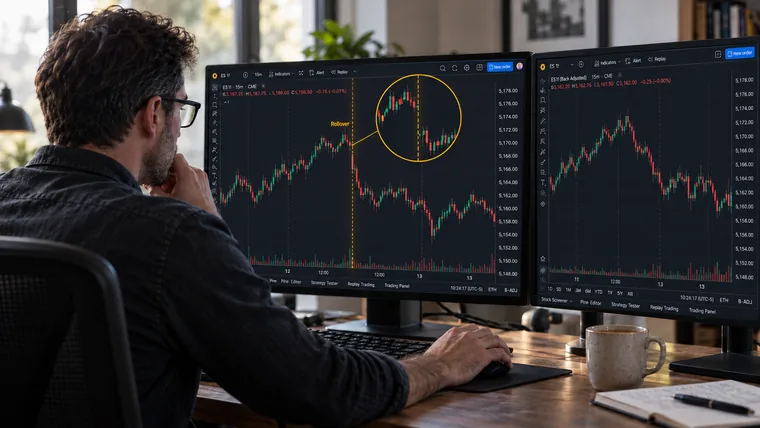
Futures contracts expire, so any test on ES, CL, GC or ZN that runs longer than a few months has to stitch several contracts into one series. Done badly, that stitching creates gaps nobody ever traded and profits you never made. Below I’ll walk you through how Forex Tester Online handles it: two price modes, rollover markers, and a journal that keeps both the original and the adjusted prices.
If you’re new to testing futures, we’ve already covered the basics, from contract specs to a first test, in our guide to backtesting futures trading strategies. Here I want to go one level deeper, into what actually happens at each roll.
Why Continuous Contracts Matter for CME Futures
Here’s the core problem. CME futures expire every quarter, and some products every month. Around each expiry, traders move from the old contract to the new one. For a few days both trade at once, and the new one almost never trades at the same price as the old.
Glue the raw prices together and you get a jump on the chart that nobody ever traded. Your trend lines break, your support and resistance shift, your indicators react to a move that didn’t happen, and a position held across the roll can show a profit or a loss that’s pure fiction.
Continuous contracts fix this, and Forex Tester Online gives you two ways to look at the same CME data. Original prices show what each contract actually traded at. Back-Adjusted prices shift the history so the roll gaps disappear and the series runs smoothly. The history goes back to 2010 for the main contracts (ES, NQ, YM, GC, CL, NG and ZN), and micro contracts start in 2019.
Setting Up the Comparison: Same Market, Two Price Modes
The easiest way to understand this is to see it. Load a liquid market such as the E-mini S&P 500, crude oil or gold, and open two synchronized charts of the same symbol and timeframe: one in Original mode, one in Back-Adjusted. They move together as you step through the replay, so you’re always looking at the same moment.
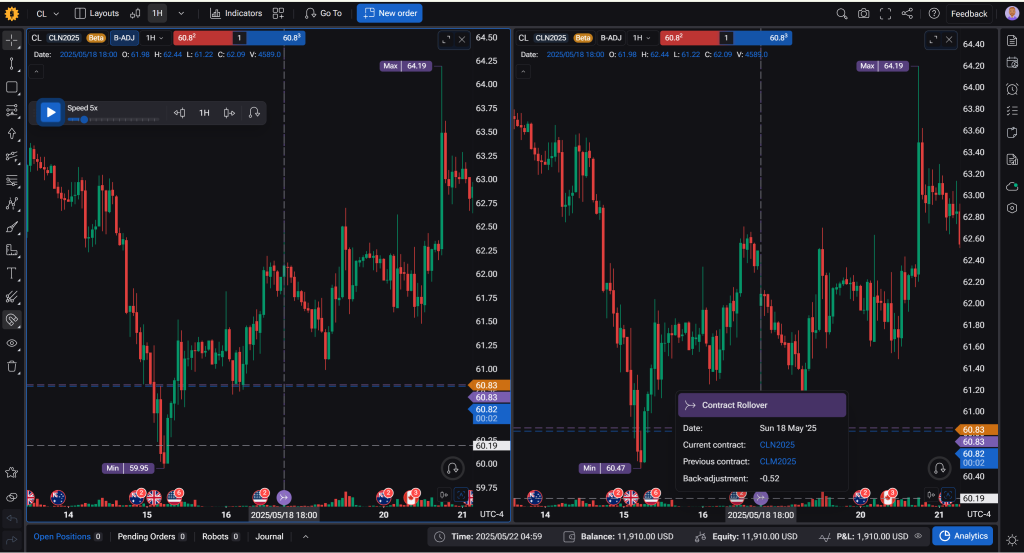
The difference between non-adjusted and back-adjusted CL chart. The crosshair points at rollover time.
You’ll notice vertical rollover markers on both charts. They show where the continuous series switches to the next contract, based on where trading volume moves from one contract month to the next.
To be honest, there’s no single “correct” roll moment. Both contracts trade side by side for a while, and every platform has its own rule for choosing the switch. What matters is that you can see it. In Original mode you’ll see the price jump at each marker; in Back-Adjusted mode the line stays smooth and the marker simply shows where the adjustment happened.
So which view should you trust? It depends less on your strategy type and more on what your rules are tied to. If your rules use absolute prices, such as round numbers, old highs and lows, or a specific level, read them on Original prices, because back-adjustment moves historical levels to values that never traded. If your rules use relative measures like moving averages, ATR multiples or distance from a swing, the Back-Adjusted series is the better fit, because roll gaps can’t distort the math.
Trade Behavior Across the Rollover
Try this: open a long a few days before a rollover marker and let the replay run through it. In both price modes, Forex Tester Online closes the position at the roll.
I want to be clear that this is a modeling choice, not how expiry works in real life. In a real account you usually have a day or two to close or roll the position yourself, and if you’re still holding close to expiry, your broker will call and ask you to close it. In physically delivered contracts like crude oil, the alternative is literally taking delivery. We close at the roll because it keeps the backtest honest: the gap between contracts never turns into P&L, which is exactly the mistake tools make when they treat that jump as a real move.
A few more details that matter if you trade futures for real. Pending limit orders that haven’t filled carry over to the new contract at the equivalent price, so you don’t lose them. Market and stop orders fill at bid/ask, while limit orders fill at the last trade price, the way futures orders are actually matched. Tick values are instrument-specific: one tick in ES is $12.50 per contract and $1.25 in the micro, while CL and GC use their own tick sizes and multipliers.
After the roll, the closed trade in the journal shows the entry, the exit at the roll, the ticks captured and the dollar result based on the real contract specs. It’s also tagged as a rollover, so later you can pull up every roll-related close with one filter.
Original versus Back-Adjusted Prices Inside the Journal
This is the part I like most, because it saves a lot of confusion later. For every trade, the journal can show the Original and Back-Adjusted prices side by side.
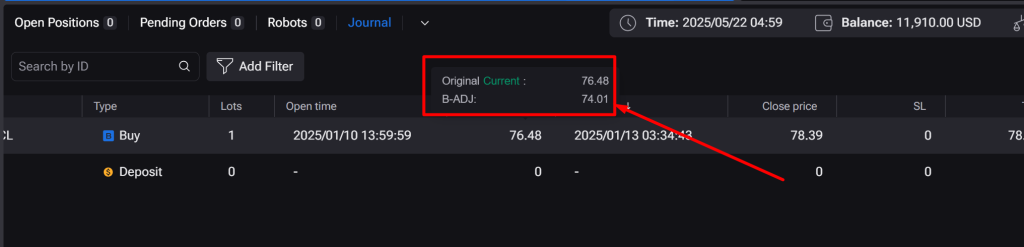
Use the Original column when you compare your backtest with a live or paper account, because broker statements use unadjusted contract prices. Use the Back-Adjusted column when you review entries you made against indicators or levels on the adjusted chart. The difference between the two is simply the total roll adjustment up to that point in history.
One thing people often get wrong: your equity curve is the same in both modes. P&L is always calculated from the real prices of the contract you traded, so the price mode changes how the chart and indicators look, not your results. What does affect the curve is the close at each contract switch. A trade you would have rolled in real life becomes two trades in the backtest, so keep that in mind when you compare trade count or average holding time with your live results.
You can also add notes, tags and screenshots right at the roll. Over a multi-year test, that turns into a really useful record of how your strategy behaved at every contract change.
What This Means for Your Backtest
You don’t need to do anything special to get accurate results. Forex Tester Online handles the rolls for you. There are just three things worth knowing:
- Pick the price mode that matches your rules. If your rules use specific price levels, such as round numbers or old highs and lows, use Original prices. If they use indicators like moving averages or ATR, use Back-Adjusted. You only need to decide this once per strategy.
- Expect a few extra trades. A position open at the roll is closed and counted as a separate trade, so your trade count can be slightly higher than it would be live. The rollover tag in the journal shows you exactly which ones.
- Your results don’t depend on the mode. P&L is always calculated from the real contract prices, so switching between Original and Back-Adjusted changes how the chart looks, not your equity curve.
That’s it. The rest is just testing your strategy.
CME Data Fees: Real-Time Feeds versus Historical Data
I see a lot of confusion around CME data fees, so let me untangle it. Most of what you’ll find online refers to real-time market data. CME charges exchange fees for live CME data feeds, and you usually pay them through your broker or trading platform. Non-professional subscribers pay less than professionals, and delayed data is often free, but you can’t trade intraday on it.
Historical CME data for backtesting is a different story. You’re not trading on it, so you don’t need a live feed. What you do need is deep, clean tick history, and that’s where many platforms either cut the history short or sell it as an add-on. In Forex Tester Online, CME historical data is included in the Pro subscription. There are no separate exchange fees for it, no paywall on older years, and new data simply appears in the platform.
The data includes volume, bid/ask and last-trade information. Settlement prices are applied to daily candles by default (you can turn this off in the project settings), so your higher-timeframe levels match what your broker or prop firm uses.
Putting It All Together
Contract rolls are one of those things you shouldn’t have to think about when you backtest futures. You should be able to load a market, test your idea across years of CME data, and trust that the numbers reflect what would have actually happened, without phantom gaps or profits you never made.
That’s exactly what we built. Forex Tester Online handles the rollovers for you, keeps your P&L tied to real contract prices, and lets you choose the price view that fits your strategy. All you have to do is test.
If you trade futures, try your strategy on a dedicated futures backtesting platform that treats contract mechanics the way the market does. One session is usually enough to see the difference.

Forex Tester Online
Advanced backtesting software for futures