Summarize at:
In search of the market driving force, we are ready to use any idea. The concept of the market volume appeared in 1946 − the famous financial players Jonathan Woods and Martin Vignolia called it a «cumulative volume».
In the conventional form, the On Balance Volume indicator began to be used in 1963, after publication of Joseph E. Granville’s book «New Key to Stock Market Profits».
It was Granville who first realized the idea of volume analysis in the form of a technical tool for measuring positive/negative cash flows and applied it successfully for the commodity markets forecast.
In the Forex market, there is no data on the amount of contracts, so we have to use the available data: enthusiasts replaced the real volumes in the OBV indicator by the tick volume. These trading methods are still relevant.
So let’s begin.
Logic and purpose
The OBV indicator exploits a fundamental idea that the volume dynamics precedes the price change. In fact, the indicator’s line shows a rate of change in volume and in price that accompanies this volume.
If the volume increases or decreases sharply, and the situation is not yet visible on the price chart, it means that waiting for a strong movement is a good idea.
Have you wondered why?
To get a strong price movement, for example upward, major investors are beginning to invest in a trading asset (buying at the min) already at the time when small players are still selling it.
The amount of money in the market increases significantly, and the price still falls or stays the same for some time. Small players do not have time to «turn around» and start losing money actively.
For some time, there is a struggle near the point of equilibrium, after which a large interest finally moves the price in the right direction for itself, and a subsequent connection of the «market crowd» to it ensures a strong movement. Having received a desirable profit, large players turn their «money» in the opposite direction.
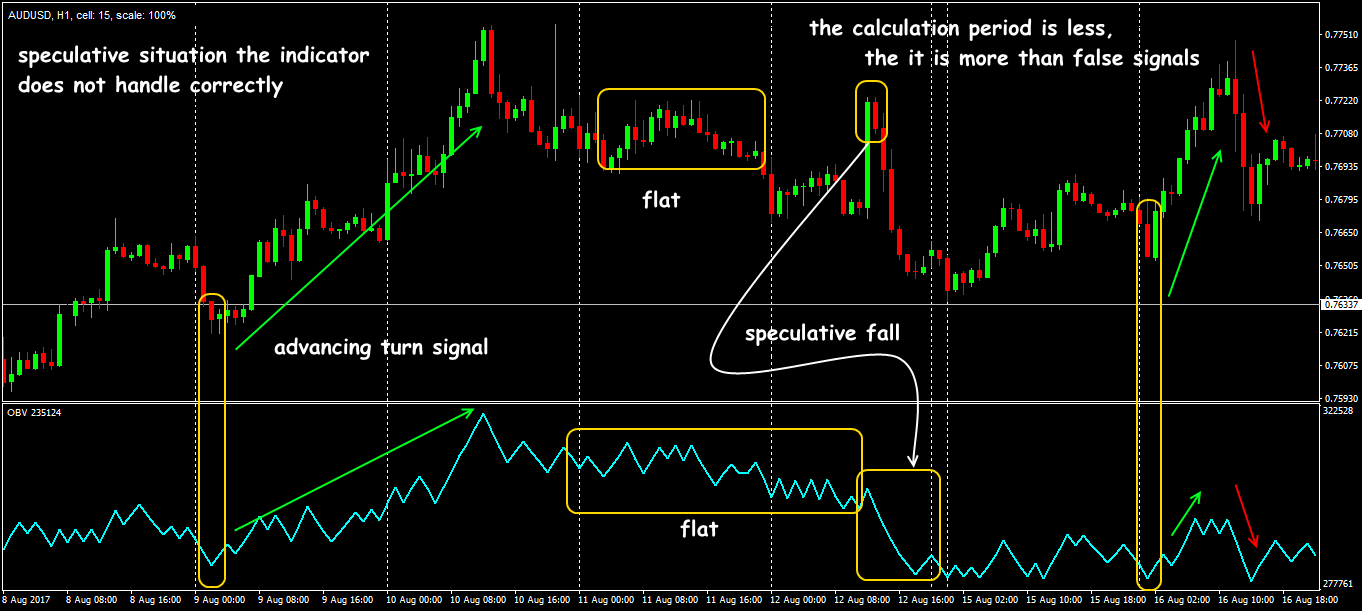
To catch the moment when major players are entering the market is the goal of any professional trader. It is a thing the volume analysis is useful for. But there is one more point. Real market volumes allow you to estimate an actual turnover of the market (the number of lots in the buy/sell transactions per unit of time), while the tick volumes act as a counter for price fluctuations. It does not matter whether the quote has changed by 1 point or by 100 points − the value of tick volume will change by one point. We only have to hope that the tick data reflects the price dynamics accurately.
The use of tick volumes in the OBV indicator requires special attention to its trading signals, but it will be discussed later.
Calculation procedure
The tick volume is a total number of purchases and sales (price ticks). The value of On Balance Volume is a cumulative moving average of the trading volume.
What this means is:
- If the closing price of the current bar is higher than the previous close (price of the asset is growing), then the volume value of the current bar is added to the previous OBV value (trend is upward):
OBV(i)=OBV(i-1)+VOLUME(i)
- If the closing price of the current bar is lower than the previous one (price of the asset is coming down), then the current volume is subtracted from the previous value (trend is downward):
OBV(i)=OBV(i-1)-VOLUME(i)
- If the current closing price is equal to the previous one (there is a flat market), then:
OBV(i)=OBV(i-1)
The calculation does not use additional mechanisms of smoothing or averaging, which means that this algorithm will not lag behind the real market trend (check here OBV Tutorial).
Parameters and control
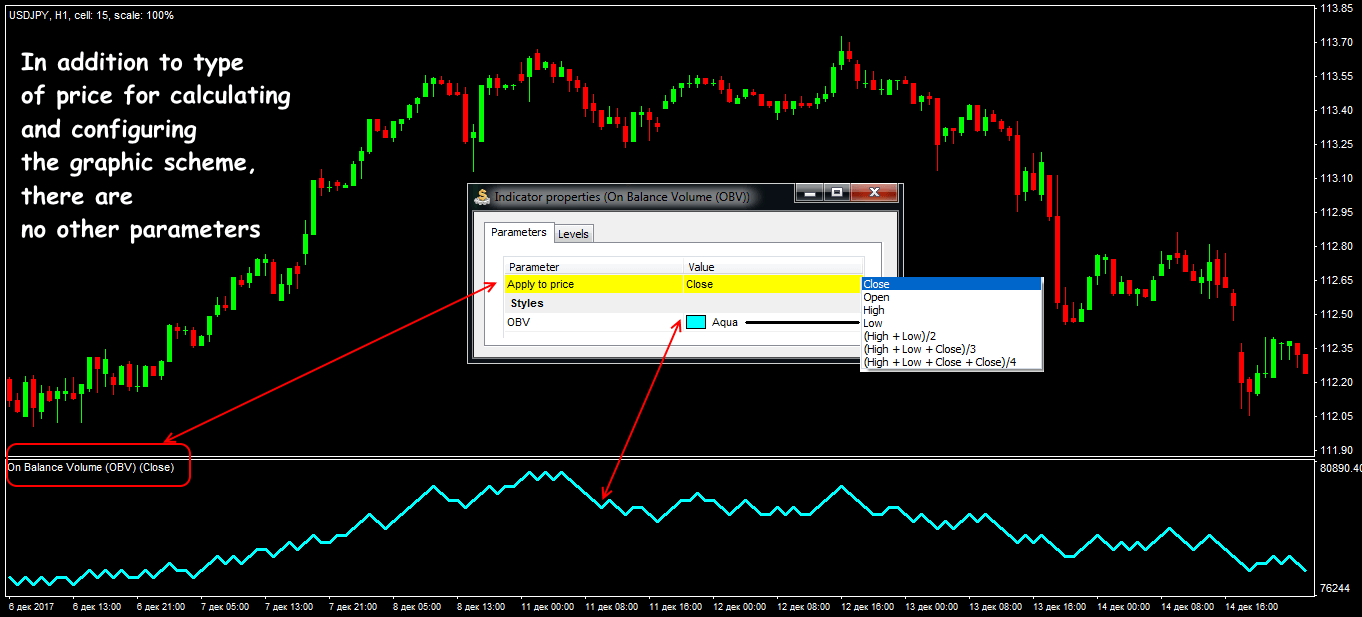
This indicator can be found in the standard set of all popular trading platforms; it is located in an additional window under the price chart and represents an ordinary oscillator’s line.
In the futures markets, the OBV indicator always uses the last quote of the candle, that is, the closing price. We also recommend using this parameter to eliminate an effect of redrawing the indicator’s line completely.
In the Forex market, the numerical OBV value is practically not used (it is too relative). Only the direction of its line is needed for analysis.
Let’s look at it in detail.
Trade signals of the indicator
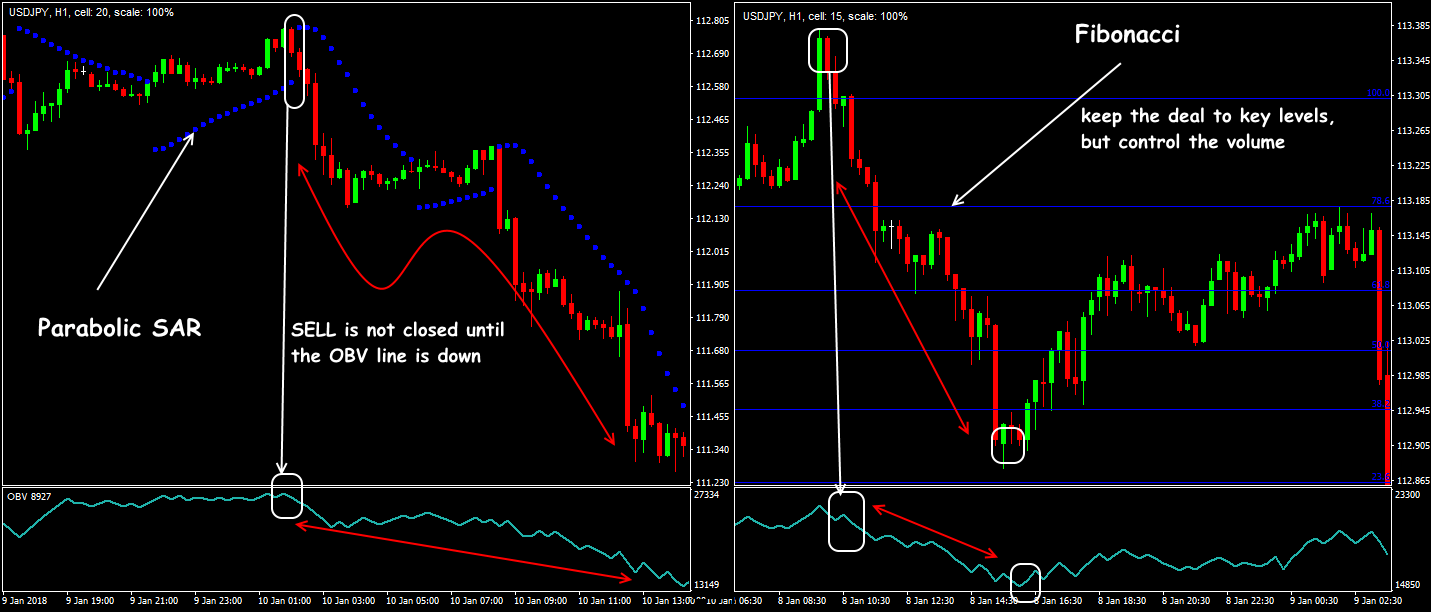
The On Balance Volume indicator does not give the entry points by itself − its signals should only confirm the information from other indicators.
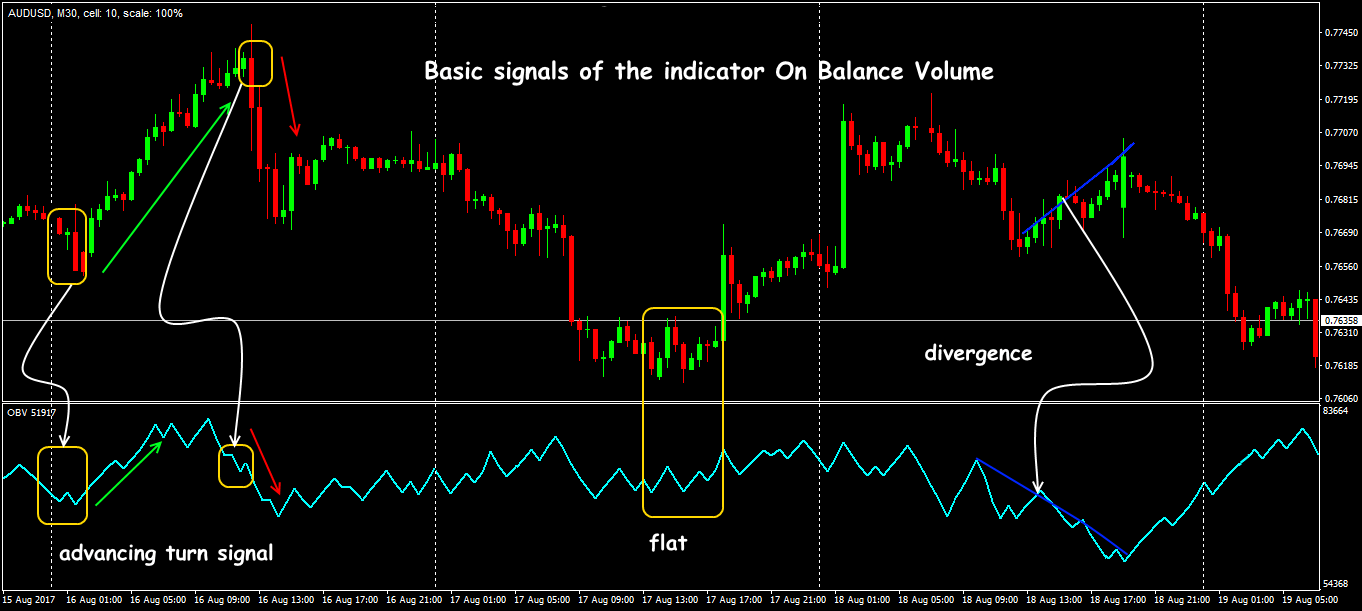
Reminder: interpretation of the signals is based on a principle according to which the changes in the OBV line outstrip the price dynamics.
This indicator has only one task − to warn about a trend reversal. Let’s think about it using a standard scheme: the increase in both price and volume supports the upward trend, while the decline in the price and volumes means that the downtrend continues.
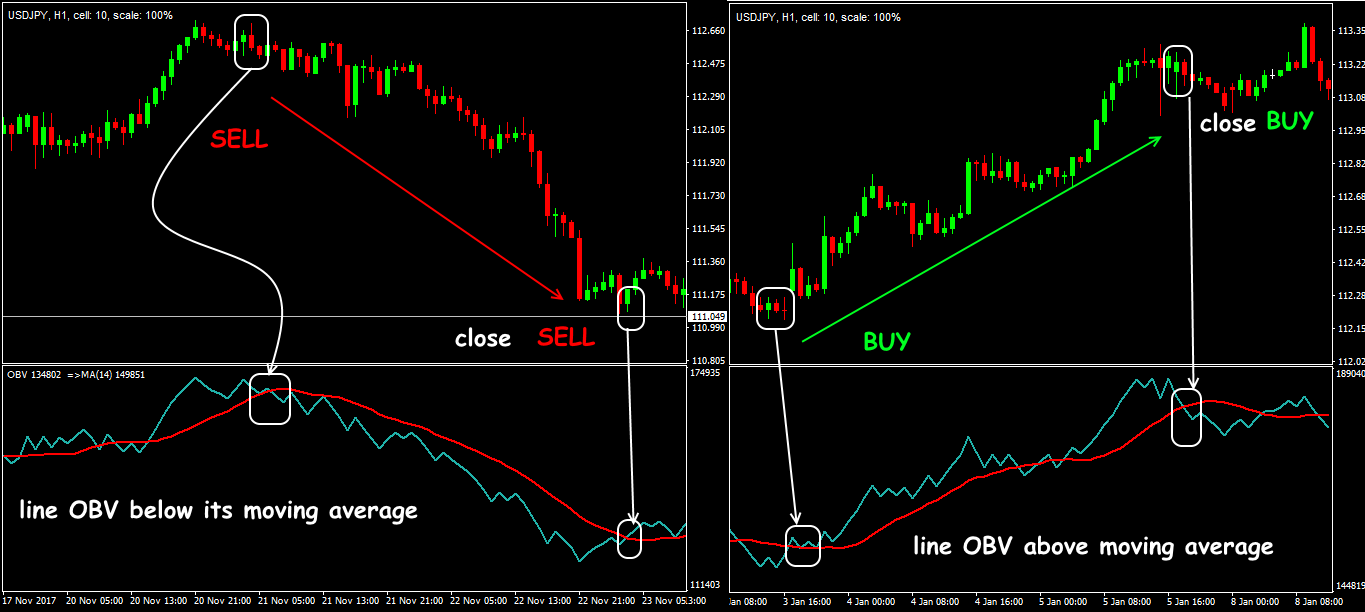
To improve the trend control, you can build a moving average on the OBV data. In this case:
- open a BUY order at the moment of the MA intersection from bottom up;
- open a SELL order at the moment of the MA crossing from top to bottom.
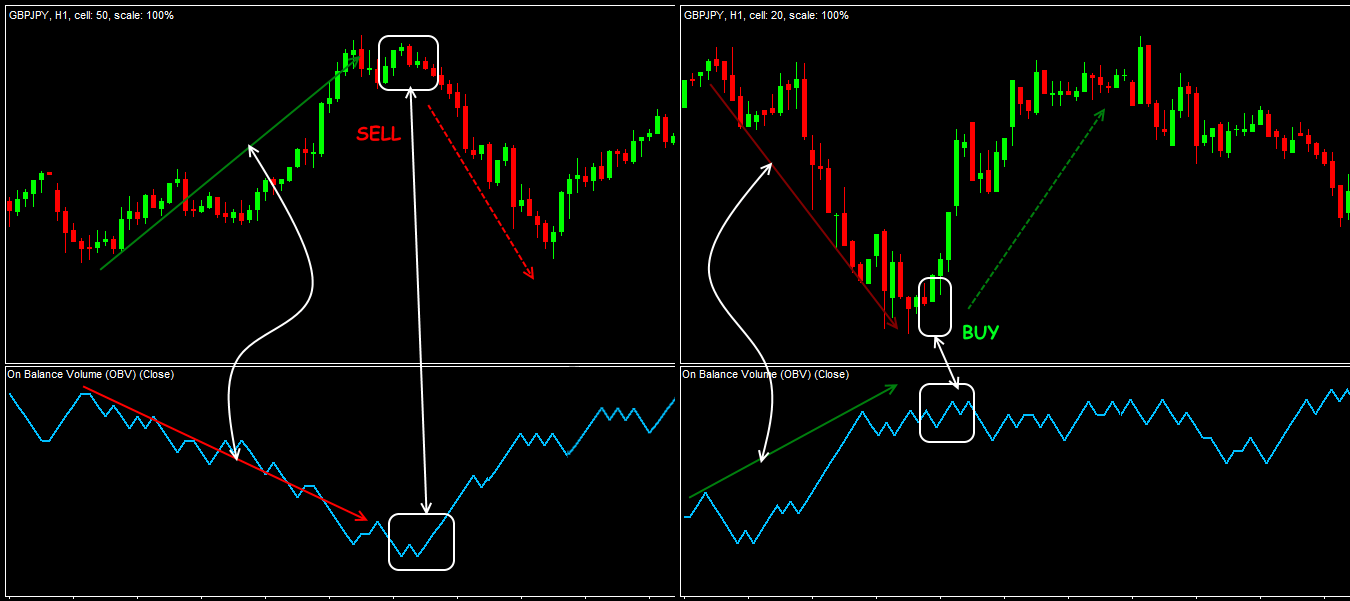
If the price moves faster than the On Balance Volume line, a market condition occurs that is called «no confirmation»: at the top of a bull market (price grows without the OBV support, or is ahead of it) or at the bottom of a bear market (price decreases without the indicator line coming down, or is ahead of this line).
At the moment of a reversal on the On Balance Volume line, there is a sharp throw: if it is on the breakdown upwards − we should buy; if it is on the breakdown downwards – we should sell.
Taking into account the calculation methodology, it can be assumed that it is the On Balance Volume indicator that estimates the divergence situations most correctly.
Divergence on the OBV indicator is possible only if the speculators start closing the deals (fixing their profits) massively or open a new position in the opposite direction (Using Graphic Tools).
All other oscillators, like MACD or RSI, use different mechanisms for calculating the average value, and the volume dynamics estimates only absolute values.
The volume growth is not limited by anything, therefore OBV will grow while the buyers are strong in the market, and fall until the interest in sale decreases.
Several practical remarks
Due to the fact that the OBV indicator uses the tick volume in the Forex market instead of the real one (money volume), its stable positive correlation with the price is only shown during the long periods − from H4 and higher. The results of the OBV analysis on the timeframes below H1 cannot be trusted at all (check OBV).
For a reliable entry according to the OBV signals, it is recommended to wait at least 1-2 periods and receive an additional confirmation from other indicators.
In our opinion, the attempts to combine the OBV indicator with the market profile indicators and other voluminous algorithms (for example, with the data of the horizontal market volumes) have no commercial sense. In this case, the signals coming from the main price chart are simply duplicated.
Reminder: the quality of the OBV signals directly depends on the data flow provided by your dealing center, so you should use it very carefully.
As an independent instrument of the technical analysis, the On Balance Volume indicator does not make sense, but in the combined, especially medium-term trend strategies, the estimation of the tick volume is just necessary.
Try It Yourself
After all the sides of the indicator were revealed, it is right the time for you to try either it will become your tool #1 for trading.
In order to try the indicator performance alone or in the combination with other ones, you can use Forex Tester with the historical data that comes along with the program.
Simply access Forex Tester Online. In addition, you will receive 23 years of free historical data (easily downloadable straight from the software).
Was this article useful for you? It is important for us to know your opinion – share your comments down below!
 Try Forex Tester Online
 ไทย
ไทย
 Tiếng Việt
 Polski
 Türkçe
 Nederlands
 Română
 한국어
한국어
 Svenska
