The idea of a price reversal trading is as old as the market itself, and perhaps new methods for finding key points are even still being developed.
As a result, price levels are subjective – there are as many strategies as traders themselves. But, in our opinion, the truth in this matter has long been found.
Back in the 30s of the XX century, the famous trader and mathematician Henry Chase offered a methodology for calculating levels, which does not allow different interpretations, that is, on any trading asset and in any market conditions, the results are equally effective.
Each market participant using the Pivot Points indicator sees the same, mathematically correct situation. Therefore – let’s start and try to understand how profitable it is for us.
Logic and purpose
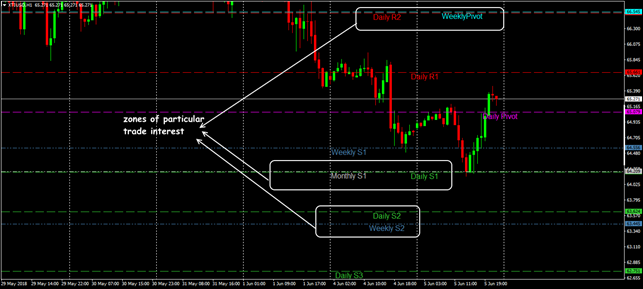
The meaning of reversal levels is that they show zones of unstable market equilibrium and perform as support or resistance levels. The limit and stop orders are placed in the reversal zone, depending on whether the trader expects a breakdown of a level or a trend reversal. In other words, this is the zone of strong market interest, and the movements in it are caused by the usual market psychology
The advantage of the Pivot Points levels is that they are objective: they are calculated on “clean” price data for the previous period (day, week, month).
No correction, smoothing or averaging is applied; the trader selects only the estimation period. Even if the real prices have a small inter-exchange difference, the calculation results are still about the same.
By the way, you can check the correctness of your broker quotes through the calculation of Pivot – they must coincide (± 5-10 points) with publicly available data, which are regularly published and actively discussed by the analysts.
The calculation procedure
The easiest way to determine the reversal levels has been applied on Wall Street for decades.
First, based on the prices of basic OHLC model, the key level (center) is calculated:
PIVOT=(HIGH+CLOSE+LOW)/3
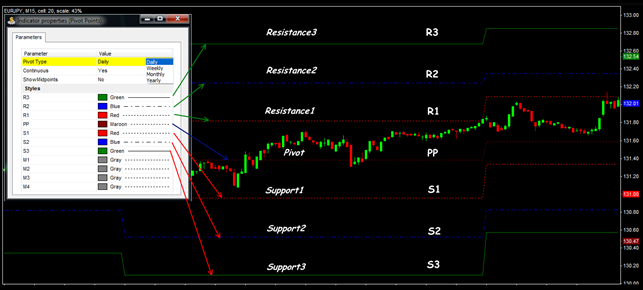
Further, we move from the center upwards and build resistance levels:
Resistance1=2*PIVOT-LOW_DAY
Resistance2=PIVOT+ Resistance1
Resistance3=HIGH+2*(PIVOT-LOW_DAY)
Similarly, we go down from the center line to determine the support levels:
Support1=2*PIVOT-HIGH_DAY
Support2=PIVOT- Support1
Support3=LOW_DAY-2*(HIGH-PIVOT)
The position of levels should be recalculated every 24 hours; most traders use the closing time of the New York session at 5 PM EST as the close of the day. The larger the timeframe is chosen for calculation, the more important the price level is considered (see Pivot Point).
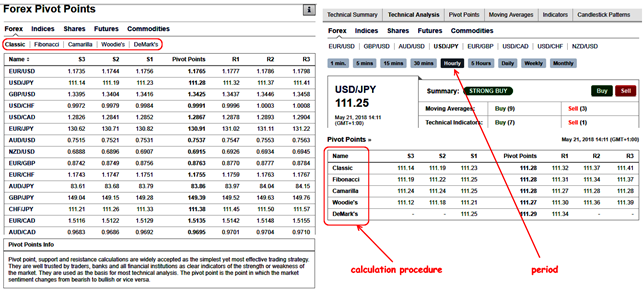
In addition to the standard calculation, the modern market offers several more options:
- Fibonacci: the calculation based on the famous series of numbers; the trader chooses the data range for calculation separately using special tools;
- Woodie: the calculation gives greater importance to more “fresh” price data;
- Demark: the famous analyst’s method calculates the potential levels that the price (at the current activity) can reach over a certain period;
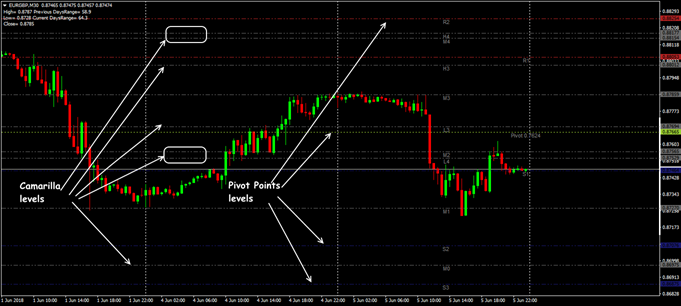
- Camarilla: the method developed by the stock exchange trader Nick Scott, who worked with bonds — it is a set of eight levels for setting the optimal Stop Loss/Take Profit.
On financial resources (for example, here), you can find a ready-made calculation of reversal points of several types for all trading assets.
Parameters and control
The proposed indicator is a simple technical script that shows the necessary price levels on the main chart but does not give explicit trading signals.
Some popular trading platforms do not offer Pivot Points as a basic set, but various versions of the indicator can be freely found on the network.
In the standard version, you can only customize the design of lines; you can also “shift” the beginning of the calculation for several hours using the Shift parameter.
The data for calculating the levels depend on the prices of the daily candle; therefore, the choice of the working timeframe (as well as their number) depends on the tactics for determining the breakdown of critical zones selected by a particular trader.
Pivot Points are used on any market instrument. Some versions of indicators, in addition to the main levels, also offer to build intermediate ones: S0.5; S1.5; S2.5; R0.5; R1.5; R2.5.
Let’s take a closer look at how to apply them in the real trading.
Trade signals of the indicator
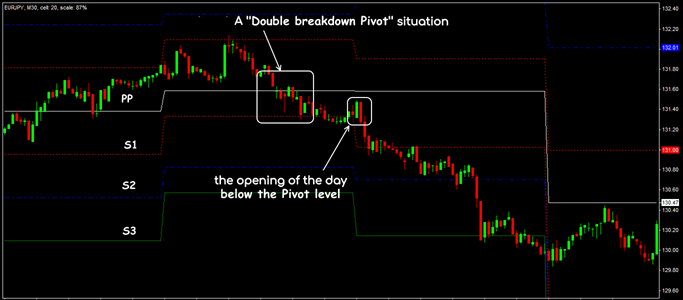
The most important trading value is the central line of the indicator:
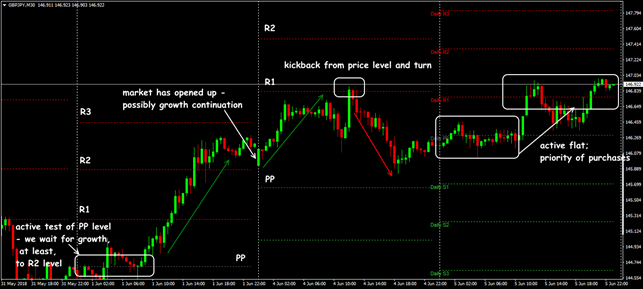
- if the market opens higher, then during the trading day purchases are recommended;
- if the day is opened below the PP line – there is a priority of the sales;
- if the opening occurs in the upper zone, but the price quickly breaks through the center line down – it is most likely that the trading day will pass in a flat.
For trading equipment, the Pivot Points system uses the usual tactics for rolling back or breaking through price zones (see How to use Pivot Points for range trading).
The most important is a zone of S1-PP-R1; if the market does not have large volumes that can affect the price, it is most likely to move precisely in this range until the breakdown towards a strong trend.
If the price breaks through and tests the S2 level, then you need to wait for either a movement to the S3 level or a return to S1 – the most likely direction is determined by the active trading volumes.
Intermediate levels are used as additional signals; as an example, the following situations occur most often:
- flat (stop) at levels S0.5-R0.5 – wait for the breakdown of the PP line down/up and then move to S1-R1;
- flat on S1 and the breakdown of S0.5 (or S2-S1.5) – move to the PP line and resistance levels;
- flat on S3 and the breakdown of S2.5 – move to the S2 and PP lines;
- flat on R1 and the breakdown of R0.5 (or R2-R1.5) – move to the PP line and support levels;
- flat on R3 and the breakdown of R2.5 – move to the R2 and PP lines.
The R3 and S3 levels are the control (extreme) targets for periods of high volatility. In the case of a very strong trend, the price easily overcomes the PP line and the basic levels that can be used to set Stop Loss/Take Profit.
What is the result?
The Pivot Points levels determine for the trader the real price zones of increased attention, that do not change during the trading day; consider below how to use it in practice.
Application in trading strategies
Pivot Points are used in intraday systems to enter when one of the levels is reached and to determine the “quality” of the price zone breakdown or as the target levels of profit or protective orders.
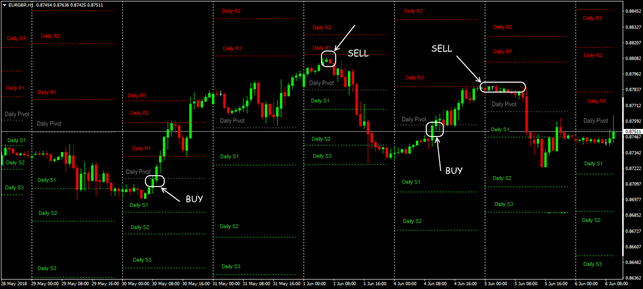
For example, the usual method for selling is as follows: the price touched one of the resistance lines – a reversal candle is formed – we open order on the next bar.
Stop Loss is set at half of the distance to the next level; Take Profit is placed at the first level after a turn. For a purchase transaction, we reason similarly.
It is worth paying attention to the price behavior in the zone of the Pivot Points lines and not forgetting about the main candle patterns.
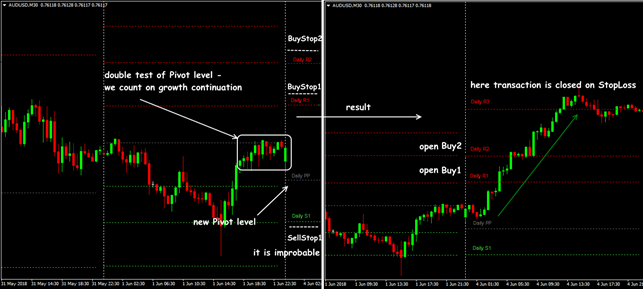
On assets with stable volatility, the dual-crossing trading strategy for Pivot Points is popular − see the screenshot below.
Theoretically, any trend should stop in the zone of S3 or R3, but most often, a reversal occurs at the second support/resistance level.
Levels R2, R3, S2, and S3 are used to close the deal, since by this time, the market has already been overbought or oversold, and the last levels rarely break through.
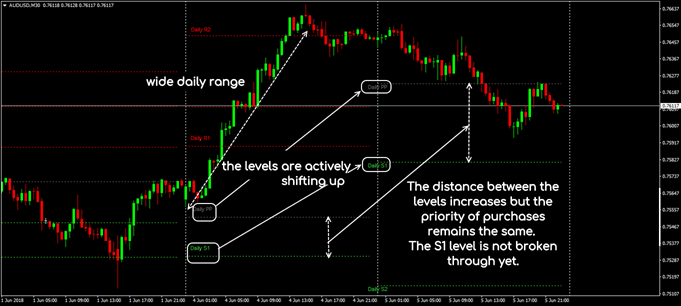
The mutual position of Pivot Points depends on the movement range for the previous trading day.
We recommend to simultaneously analyze the levels of several periods, for example, H1-H4, M5-M15-M30. The coincidence of the levels of several timeframes significantly enhances their trading value − in such zones, you can place pending orders to enter the breakdown.
If the price freezes for a long time in the zone R1-PP-S1, then it is better to wait until the market determines the direction.
From the point of reasonable money management, when trading at Pivot Points levels, it is recommended to divide the transaction volume into at least two parts for different purposes: the first Take Profit is put on the nearest level; the second Take Profit is at the next.
It means that when the first Take Profit is triggered, we transfer the second order to breakeven and then enable trailing to the second Take Profit.
A few practical notes
The main advantage of Pivot Points is a simple calculation mechanism, without adjustments and redrawing. At the same time, the multiple price crossing of the PP line during one trading day reduces the accuracy of the traffic forecast for the next day.
We remind you: Pivot Points are the primary technique for analyzing the market by large players, that is, the same levels are visible to all participants who are trying to make roughly the same trading decisions. The market makers take advantage of this situation and place large volumes of short-term pending orders in potential Pivot zones, so that small players fall into speculative “traps”.
That is why professional traders use indicator versions to accurately predict the price path, in which the reversal levels vary depending on the trading session. In any case, the Pivot Points tool is far from ideal, and its trading signals need confirmation.
Try It Yourself
After all the sides of the indicator were revealed, it is right the time for you to try either it will become your tool #1 for trading.
In order to try the indicator performance alone or in the combination with other ones, you can use FTO with the historical data that comes along with the program.
Simply get Forex Tester Online. In addition, you will receive 23 years of free historical data.
 Backtest on Forex Tester Online
 ไทย
ไทย
 Tiếng Việt
 Polski
 Türkçe
 Nederlands
 Română
 한국어
한국어
 Svenska
![Envelope indicator explained [tested settings included]](https://cdn-wp.forextester.com//app/themes/ft-blog/resources/gradients/A&B/Indicators.webp)

