Summarize at:
Reversal patterns mark the moment a trend turns and price heads the other way. Unlike continuation patterns that signal trend momentum, these setups warn, “the move is over – watch for the flip.” Reading them helps traders lock profits, open fresh positions early, and cut losses fast. In this guide we explain how to spot trend reversals, confirm them with volume and indicators, and trade both bullish and bearish patterns across forex, stocks, and crypto.
This is a comprehensive guide on how to spot and use reversal patterns. Enjoy!
What Are Reversal Chart Patterns and What Do They Indicate?
Reversal signal that a dominant trend is losing strength and a new one may soon begin. These chart reversal patterns appear after extended moves and stand in contrast to continuation patterns that point to trend persistence. Spotting a clear reversal helps traders exit late trades, flip direction, or stay flat until trend confirmation. Reversal trading works on any liquid asset once price action, volume confirmation, and supporting indicators agree.
Trend Reversal Triggers
A trend often turns when one or more of these events hit the tape:
- Climax volume spike near support and resistance levels
- Divergence on RSI or MACD showing fading price momentum
- Breakout and breakdown through key moving averages
- Sudden news that changes market psychology or liquidity flow
Reversals vs Corrections
A correction is a brief pullback inside the main trend. It ends when price resumes direction. A true trend reversal patterns show:
- Break of the prior swing high (in a downtrend) or swing low (in an uptrend)
- Shift in market structure with lower highs or higher lows
- Rising volume confirming the change, not just a pause
The Importance of Volume and Supporting Confirmation
Volume confirmation adds weight to any price action reversal patterns. Bullish reversal patterns need rising buy volume; bearish reversal patterns need strong sell volume. Combine volume with momentum indicators – RSI crossing 50 or MACD line crossing zero – for trend confirmation and to filter false reversal signals.
Market Psychology Behind Reversals
Reversals form when buyers exhaust in an uptrend or sellers exhaust in a downtrend. Head and shoulders patterns show topping distribution; double bottom patterns show capitulation and renewed demand. Understanding this price pattern psychology keeps a trader patient: wait for the crowd to flip before acting.
Categories of Reversal Patterns
Reversal setups fall into two broad groups. Chart-based patterns stretch over many candles and reveal bigger shifts in market structure. Candlestick patterns form with one to three candles and give faster, closer signals. Knowing which group fits your trading style improves pattern reliability and timing. Here are some details about both. Read below.
Chart-based reversal patterns
These chart reversal patterns build over days or weeks. Head and shoulders, double top, double bottom, and wedges all map clear swings between support and resistance levels. Their strength lies in trend confirmation: a neckline break or wedge breakout shows that market structure has flipped. Use them for swing trades and position trades where you can wait for a full breakout and volume confirmation. The drawback is late entry – the move has already started when the pattern completes.
Candlestick reversal patterns
Candlestick reversal patterns such as hammer candlestick pattern, shooting star, bullish and bearish engulfing pattern appear in one to three bars. They show sharp shifts in price action and trader sentiment. These signals work best on intraday charts near key support and resistance zones, especially when paired with RSI or MACD divergence. Fast signals mean early entry, but they also bring more false reversal signals. Always add volume confirmation or a small breakout to improve pattern reliability.
Don’t worry if you don’t understand what exactly this is about. We will review some specific patterns later in this article.
Major Chart Reversal Patterns List
This section covers the most traded chart reversal patterns. Learn their structure, common mistakes, and clear trading rules.
Bullish Reversal Patterns
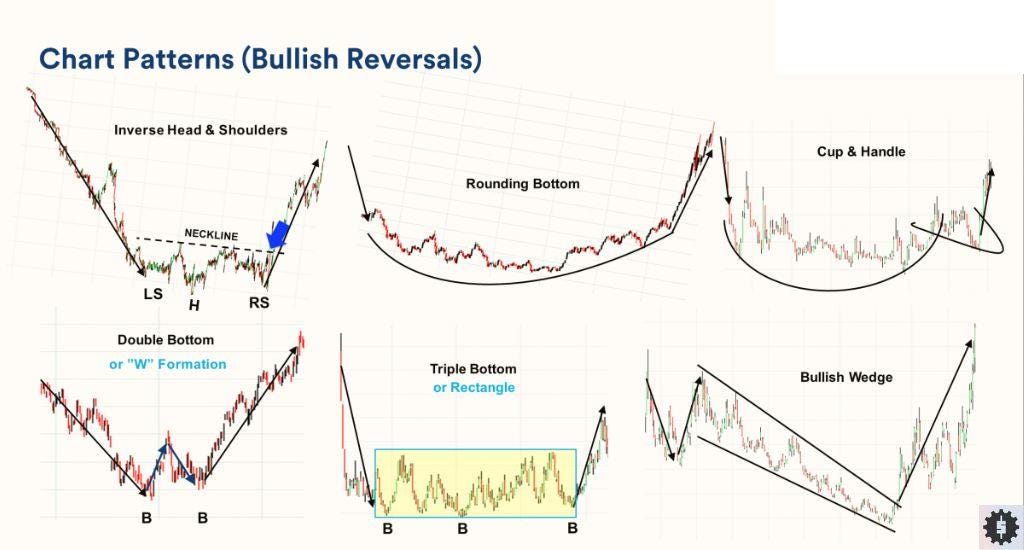
Inverse Head and Shoulders
- Structure: a low (left shoulder), a deeper low (head), a higher low (right shoulder), and a horizontal neckline.
- Setup: price breaks above the neckline with rising volume confirmation.
- Trade plan: enter on the breakout or retest, place stop loss under the right shoulder, aim for a target equal to the head-to-neckline height.
Spot and use inverse head and shoulders in your trading.
Double Bottom
- Two equal lows form a “W.” Look for a small middle peak.
- Avoid double bottom trading mistakes: skip setups where the second bottom pierces strong support too deep; that signals trend continuation, not reversal.
- Wait for a close above the middle peak. Set stop loss below the second bottom. Use a 1:2 risk/reward or project the pattern height.
Falling Wedge
- Converging trendlines slope down. Volume often dries up inside the wedge.
- Spot bullish vs bearish: a falling wedge in a downtrend is bullish; a rising wedge in an uptrend is bearish.
- Checklist: breakout must pierce the upper trendline on strong volume, stop loss below the last swing low.
Bullish Island Reversal
- A gap down leaves price isolated, then a gap up traps sellers.
- Trade entry: buy after the gap up, stop loss under the island low, target the start of the island gap.
Triple Bottom
- Three equal lows, each bounce shows buyers returning.
- Enter above the neckline formed by the highest bounce, set stop loss under the last low, target the pattern height.
Others
Rounding bottom and bullish pennant can also act as bullish reversal patterns when they end extended downtrends.
Related: 4 Cases When Trading Patterns Fail
Bearish Reversal Patterns
Triple Top Pattern
- Three peaks at the same resistance. Break of support confirms the reversal.
- Sell the breakdown, place stop loss above the last peak, target the pattern height.
Bearish Island Reversal
- Opposite of the bullish version: a gap up, small island, then a gap down. Short after the gap down, stop loss above the island high.
Head and Shoulders
- Structure: left shoulder high, a higher head, right shoulder high, neckline.
- Setup: bearish when price cracks the neckline with volume confirmation.
- Strategy: sell the breakdown or a retest, stop loss above the right shoulder, target equals distance from head top to neckline.
Double Top
- Forms an “M.” Confirmation comes when price closes below the middle trough.
- Common mistakes: entering before confirmation or ignoring low volume.
- Short the close below support, stop loss above the second top, aim for the pattern height.
Rising Wedge
- Trendlines converge upward. Price breaks the lower trendline.
- Double top spotting tip: volume often fades inside the wedge, then spikes on the breakdown.
- Checklist: short on breakdown, stop above last swing high, partial profit at the first support.
Others
Bearish pennant and rounding top also work as bearish reversal patterns after long uptrends.
Candlestick Reversal Patterns Overview
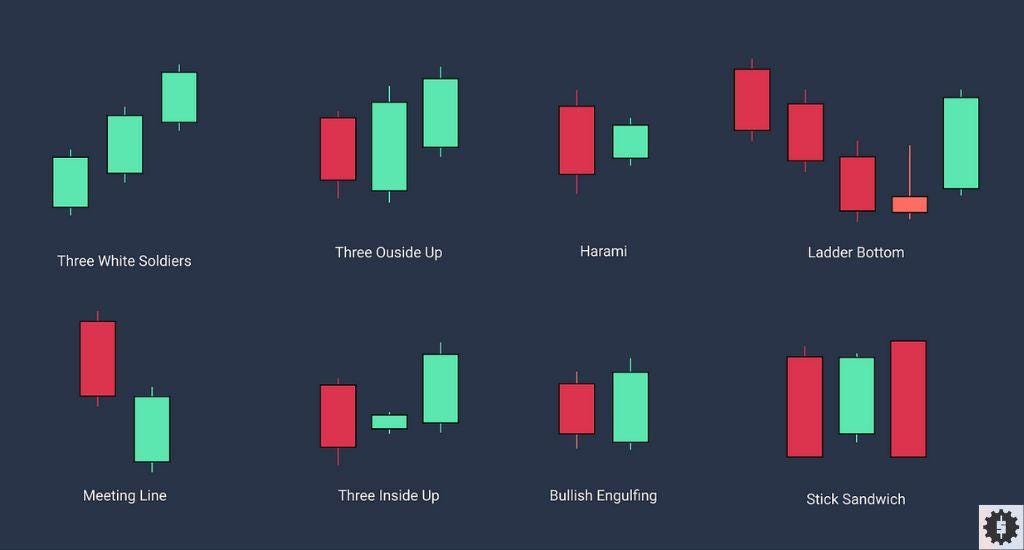
Candlestick reversal patterns give fast signals, often in one to three candles. They work best near clear support and resistance levels and when backed by volume confirmation or RSI divergence. Use them for early entry, then let a larger chart reversal pattern confirm the move.
| Pattern | Direction | Key traits | Typical use |
|---|---|---|---|
| Hammer candlestick & inverted hammer | Bullish | Small body, long lower shadow; inverted hammer flips the shadow | Spot bottoms on intraday charts |
| Shooting star & hanging man candlestick | Bearish | Small body, long upper shadow; hanging man appears after a rise | Warn of tops in uptrends |
| Bullish engulfing pattern | Bullish | Large green candle wraps prior red candle | Entry signal in a pullback of an uptrend |
| Bearish engulfing pattern | Bearish | Large red candle engulfs prior green candle | Early short signal near resistance |
| Morning star pattern | Bullish | Three-candle set: long red, small body gap down, long green closing above mid red | Marks strong trend reversal at support |
| Evening star pattern | Bearish | Opposite of morning star | Signals trend reversal at resistance |
| Piercing line pattern | Bullish | Green candle closes above half of prior red candle | Use with rising volume |
| Dark cloud cover pattern | Bearish | Red candle closes below half of prior green candle | Fade weak rallies |
| Three white soldiers | Bullish | Three long green candles closing near highs | Confirms fresh bullish momentum |
| Tweezer bottom & tweezer top | Reversal | Two candles with matching lows or highs | Spot quick turns in tight ranges |
When to choose:
- Candlestick patterns are ideal for traders who need quick entry and can watch the chart closely.
- Chart reversal patterns suit swing and position traders who wait for a full break of support or resistance.
Combine both to avoid reversal pattern failure: take a hammer candlestick at the right shoulder of an inverse head and shoulders, confirm with rising volume, and you have layered strength for higher pattern reliability.
Practical exercise (using historical data)
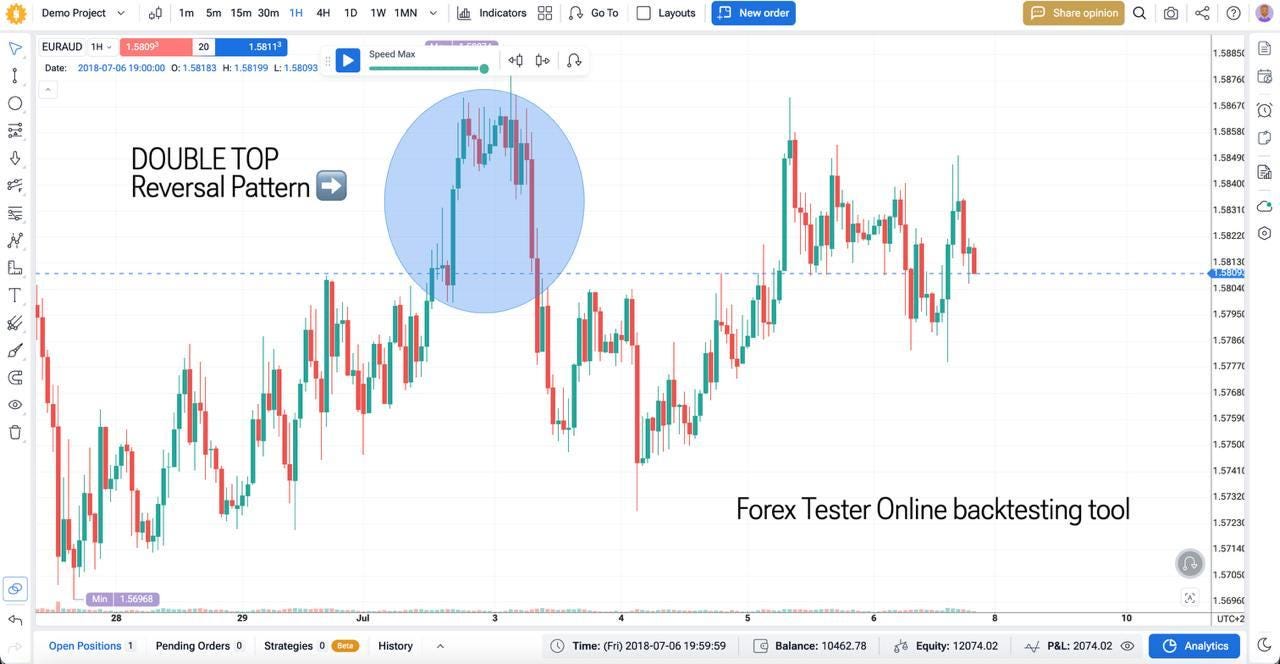
Before we move on, you can try spotting any reversal pattern on the chart.
Test each trade setup in Forex Tester Online. Backtesting the reversal chart patterns on real history shows win rate, price momentum metrics, and drawdowns without risking real money.
Image source: Forex Tester Online
Try to find and trade any of these patterns at least 5 times on Forex Tester Online. Then, continue reading to learn new strategies.
Interpreting and Confirming Reversal Patterns
A pattern alone is not enough. Always add confirmation.
Volume confirmation
Strong reversals come with rising volume. A head and shoulders neckline break on low volume is weak. Wait for a clear spike to trust the move.
RSI and MACD
RSI crossing 50 after bullish divergence supports the trade. MACD line crossing above zero adds trend confirmation in bullish reversal patterns and below zero in bearish ones.
Support and resistance levels
Place patterns near major levels. A double top under long-term resistance is worth more than one in the middle of a range. Use horizontal lines or prior swing highs and lows.
False signals and how to avoid them
Thin markets and news spikes create fake breaks. Filter by waiting for a candle close beyond the neckline or pattern boundary, not just an intrabar wick.
Optimal timeframes
Daily and four-hour charts give the best pattern reliability. Lower charts offer early entry but more noise. Align signals: a hammer on the one-hour means more when the four-hour RSI also turns up.
By combining price action, volume, and momentum indicators, traders raise the odds that a chart reversal pattern is real and not a random bounce.
Avoiding Reversal Trading Mistakes Using Backtesting Online Platform FTO
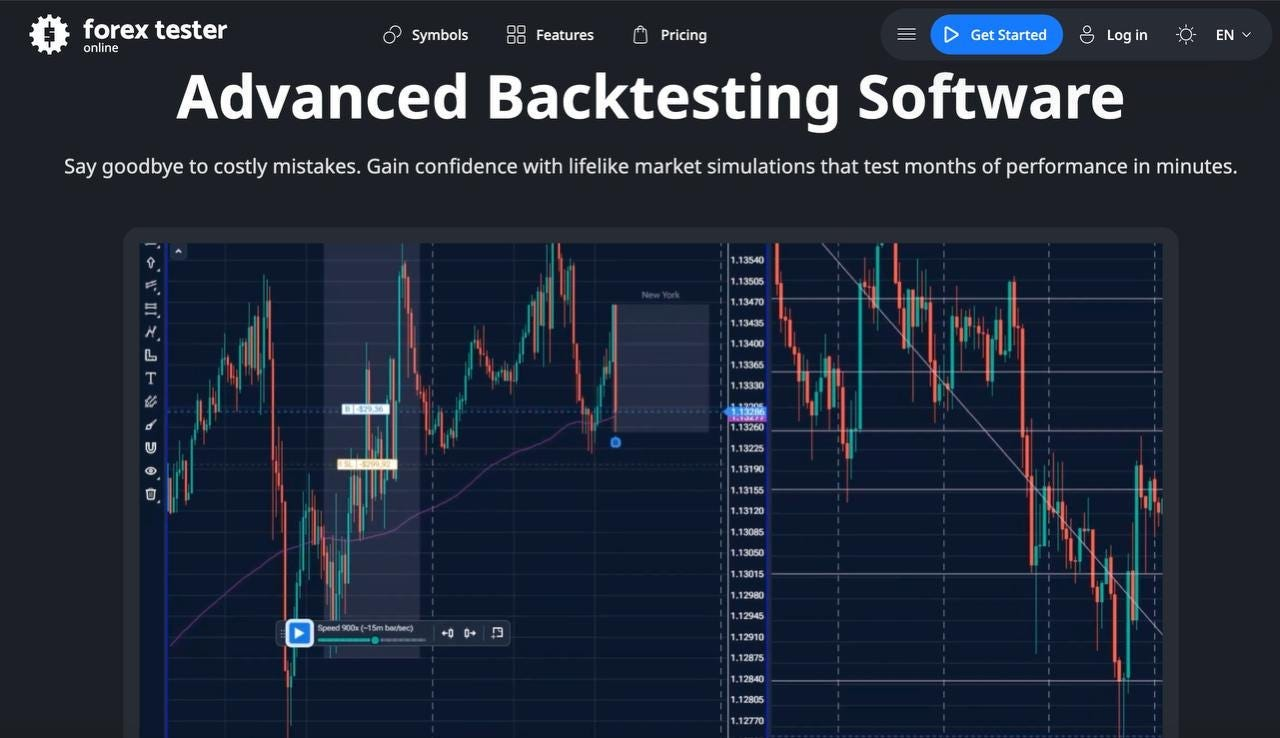
Reversal trading looks simple on paper but false reversal signals can drain an account fast. The fix is backtesting every price action reversal pattern before risking cash. To do so, you can use Forex Tester Online backtesting software.
Why Forex Tester Online helps
- ✅ 21 years of tick data for stocks, forex, and crypto
- ✅ One-click replay to see chart reversal patterns form bar by bar
- ✅ All you need to backtest patterns-based strategies
- ✅ Custom indicators for volume confirmation, RSI, and MACD
- ✅ Mystery Mode to hide symbol and timeframe, cutting bias
- ✅ Detailed stats: win rate, drawdowns, pattern reliability, risk management metrics
Mini-guide: testing a head and shoulders setup
1) Register on the FTO website to get started (or log in your existing account).
2) Then, create and launch a project.
3) Finally, you can use all the backtesting tools you need! Learn to identify patterns and test your patterns-based strategies.
With the right trading platforms and disciplined backtesting, trend traders can follow trends with confidence and clear trading rules.
Conclusion
Reversal patterns warn that a trend is ending. They give clear entry and exit signals when you read them with volume and momentum tools. Use both chart reversal patterns and candlestick signals. Test every setup with Forex Tester Online. Real numbers beat guesswork. Trade small, keep stops tight, and let the new trend prove itself.
Disclaimer
Trading involves risk. The indicators in this article are for educational purposes only and are not financial advice. Past performance does not guarantee future results. Always test strategies before using real money.
FAQ
Are reversal patterns always reliable?
No. Pattern reliability rises with strong volume and indicator confirmation. Always backtest and manage risk.
Can reversals be used in all markets?
Yes. Stocks, forex, crypto, and futures all show trend reversal patterns. Liquidity and volume may change the win rate.
How should beginners approach trading reversals?
Start on a trading simulator account. Focus on one pattern like double top or hammer candlestick. Backtest, keep notes, and risk no more than 1% per trade.
Forex Tester Online
Learn to spot reversal trading patterns by practicing with our simulator!
 ไทย
ไทย
 Tiếng Việt
 Polski
 Türkçe
 Nederlands
 Română
 한국어
한국어
 Svenska


