Knowing the differences between technical indicators is key for traders. The Relative Strength Index (RSI) and the Moving Average Convergence Divergence (MACD) are two big ones. They help traders see market trends in different ways.
The RSI shows how big the recent price changes are. It helps spot when prices are too high or too low. The MACD, on the other hand, looks at the trend of price changes. It shows how two moving averages of a security’s price relate to each other.
Key Takeaways
- RSI and MACD are both essential technical indicators used in trading.
- The RSI measures the speed and change of price movements to identify overbought or oversold conditions.
- The MACD is used to identify trends and predict price movements.
- Understanding the differences between these indicators can enhance your trading strategy.
- Both indicators can be used together to form a more complete trading plan.
Understanding Technical Indicators in Trading
Technical indicators are key tools for traders. They help analyze markets and make smart choices. These tools show market trends, predict prices, and spot trading chances.
Role of Technical Indicators in Market Analysis
Technical indicators are vital for market analysis. They give traders insights into market movements. For example, the Relative Strength Index (RSI) spots when prices are too high or too low.
Other indicators, like the Moving Average Convergence Divergence (MACD), signal when trends might change or continue.
Importance of Choosing the Right Indicators
Choosing the right indicators is critical for trading success. With many options, traders must pick ones that fit their strategy and goals. Using indicators like RSI and MACD together helps traders understand the market better.
This way, they can make more informed trading decisions.
What is RSI (Relative Strength Index)?
RSI is a well-known technical indicator. It shows the speed and change in price movements. This helps traders spot when prices are too high or too low. It’s a key tool for making smart trading choices.
Definition and Formula
The Relative Strength Index (RSI) is a momentum oscillator. It measures the speed and change in price movements. The formula is: RSI = 100 – (100 / (1 + RS)), where RS is the average gain of up days divided by the average loss of down days over 14 days.
How to Calculate RSI
To find RSI, first, you need to calculate the average gain and loss over a period. Then, find the RS by dividing the average gain by the average loss. Lastly, use the RS in the RSI formula to get the RSI value.
Interpreting RSI Values
RSI values range from 0 to 100. A value above 70 means the price is too high, suggesting it’s time to sell. On the other hand, a value below 30 means the price is too low, suggesting it’s time to buy. Traders use these signals to make informed trading decisions.
What is MACD (Moving Average Convergence Divergence)?
The MACD is a key tool in technical analysis. It helps spot market momentum. It shows the relationship between two moving averages of a security’s price.
Definition and Components
The MACD uses two moving averages: a fast and a slow one. The MACD line is the difference between these averages. The signal line is a 9-period EMA of the MACD line.
How to Calculate MACD
To find the MACD, subtract the 26-period EMA from the 12-period EMA. The signal line is the 9-period EMA of the MACD. The MACD histogram shows the difference between the MACD and its signal line.
Interpreting MACD Signals
MACD signals have different meanings:
- Crossovers: A bullish signal happens when the MACD line goes above the signal line. A bearish signal occurs when it goes below.
- Divergences: When the MACD and price action don’t match, it might signal a trend change.
Knowing these signals is important to use these indicators in the best possible way.
RSI vs MACD: Key Differences
As you can see, RSI and MACD are two key technical indicators. An they have different uses.
Calculation Methods Compared
The RSI looks at recent price changes to spot overbought or oversold levels. It uses a formula that compares gains and losses over 14 days. MACD, on the other hand, calculates the difference between two moving averages. It focuses on how these averages move together or apart.
Signal Types and Interpretation
RSI signals come from levels above 70 or below 30. These levels suggest a possible change in trend. MACD signals come from crossovers and divergences. These show the direction and strength of the trend.
Timeframe Sensitivity
RSI is more sensitive to the timeframe chosen. It’s good for short-term trading. MACD, with its moving averages, is better for spotting long-term trends. Traders should pick the right indicator for their strategy and timeframe.
How to Use RSI in Your Trading Strategy
Traders can improve their strategies by learning to use the Relative Strength Index (RSI). The RSI is a useful tool for spotting when prices are too high or too low. It also helps in finding divergence signals and adjusting to market changes.
Step-by-Step Guide to Identifying Overbought and Oversold Conditions
To spot overbought and oversold conditions with the RSI, follow these steps:
- Set the RSI period to 14 (the default setting).
- Watch the RSI level: above 70 means it’s overbought, below 30 means it’s oversold.
- Look for reversal chances when the RSI hits these extremes.
How to Spot and Trade RSI Divergence Signals
RSI divergence happens when price and RSI move opposite ways. To trade RSI divergence signals:
- Find the divergence by comparing price highs/lows with RSI values.
- Confirm it with other indicators or chart patterns.
- Trade in the direction shown by the divergence.
Best Market Conditions for RSI
The RSI works best in trending markets, helping spot overbought and oversold. It’s also good during consolidations to find breakouts. But in very volatile markets, it might give false signals. Always use it with other indicators for better results.
How to Use MACD in Your Trading Strategy
The Moving Average Convergence Divergence (MACD) indicator is a powerful tool for traders. It helps them understand trend direction and strength. This knowledge aids in making better trading decisions.
Step-by-Step Guide to Reading Trend Direction and Strength
To use MACD for trend direction, watch the MACD line and the signal line. If the MACD line is above the signal line, it’s a buy signal. If it’s below, it’s a sell signal.
The trend’s strength is shown by how far the MACD line is from the zero line. The farther it is, the stronger the trend.
How to Trade MACD Crossovers and Divergence
MACD crossovers happen when the MACD line crosses the signal line. A bullish crossover means buy, and a bearish crossover means sell. This is a strong signal.
Divergence between the MACD and the price chart can also signal a trend reversal. For example, if the price goes up but the MACD doesn’t, it might mean the trend is weakening.
Best Market Conditions for MACD
MACD works best in trending markets. It’s great at showing trend direction and strength. But, it’s not as good in range-bound or volatile markets.
Traders should use MACD with other indicators. This helps filter out false signals and makes MACD more effective.
Combining RSI and MACD for Better Trading Decisions
RSI and MACD together are a strong tool for traders. They help understand market trends better. This makes trading strategies more effective.
How to Use Both Indicators as Confirmation Tools
Using RSI and MACD together helps confirm trading signals. For example, if RSI shows an asset is oversold, a bullish MACD crossover can confirm a buy. This makes trading decisions more confident.
On the other hand, if MACD shows a bearish crossover, RSI can check if the asset is overbought. This helps traders make better choices.
Step-by-Step Trading Strategy Using RSI and MACD Together
To use RSI and MACD well, follow these steps:
- Watch the RSI for overbought (above 70) or oversold (below 30) signals.
- Use the MACD to check the trend direction and strength.
- Look for MACD crossovers as trading signals.
- Confirm these signals with RSI to match the market condition.
Backtest RSI & MACD the right way on Forex Tester Online
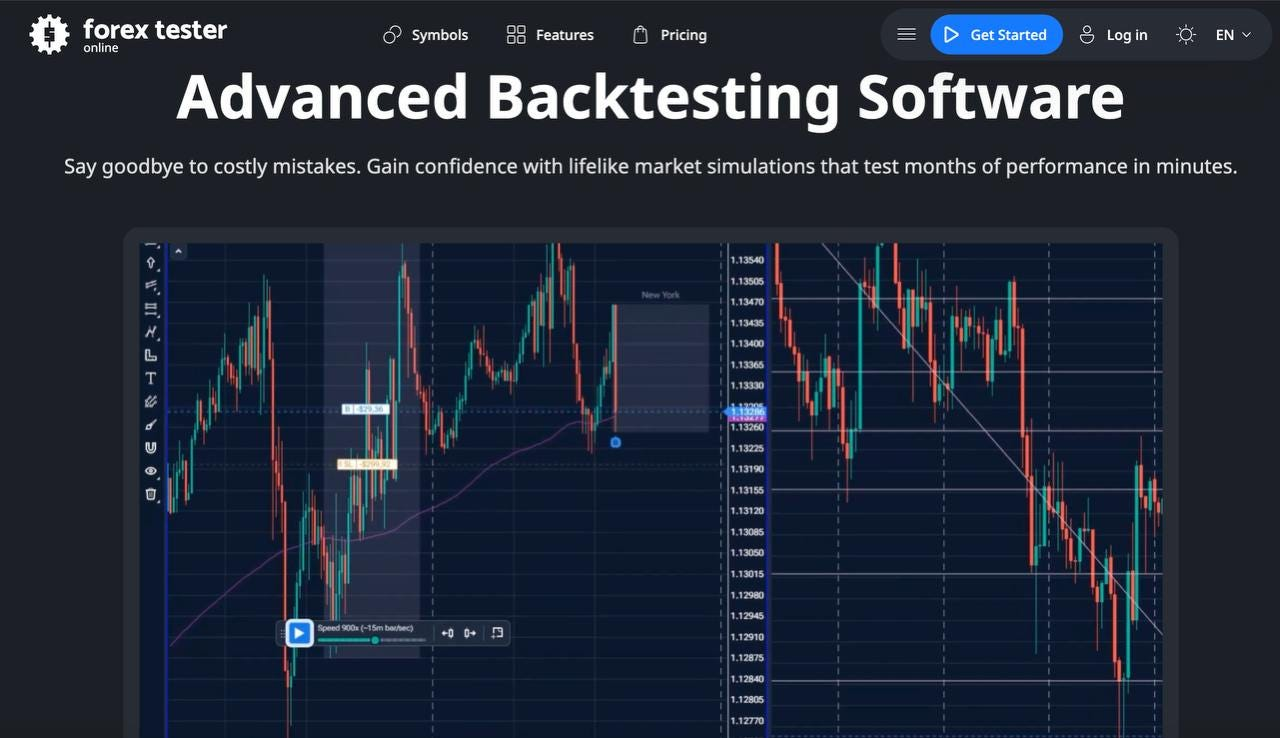
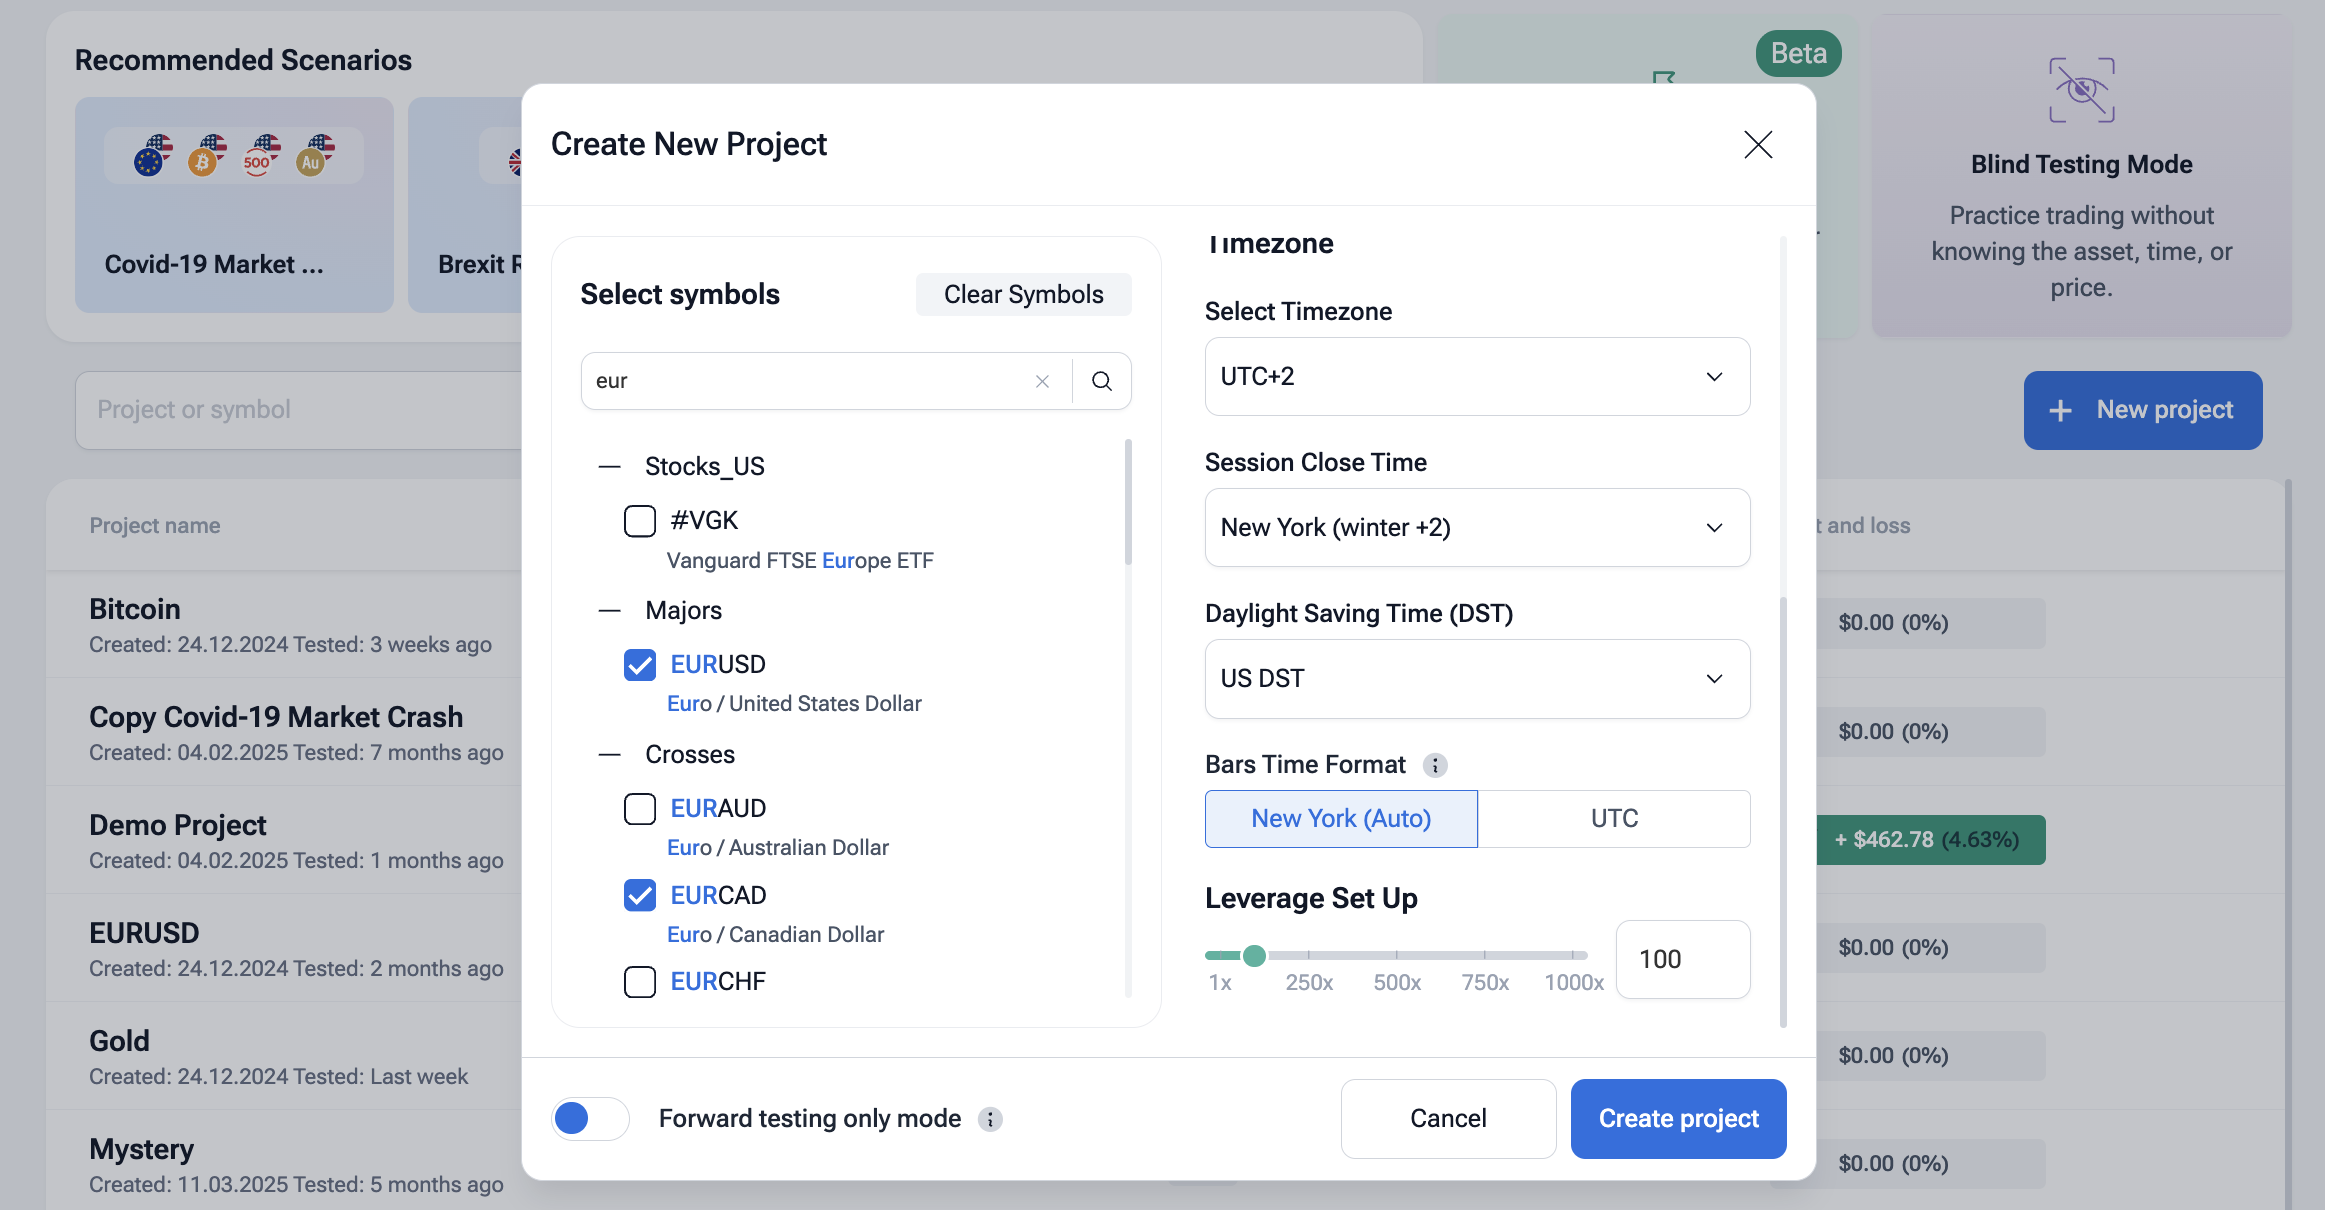
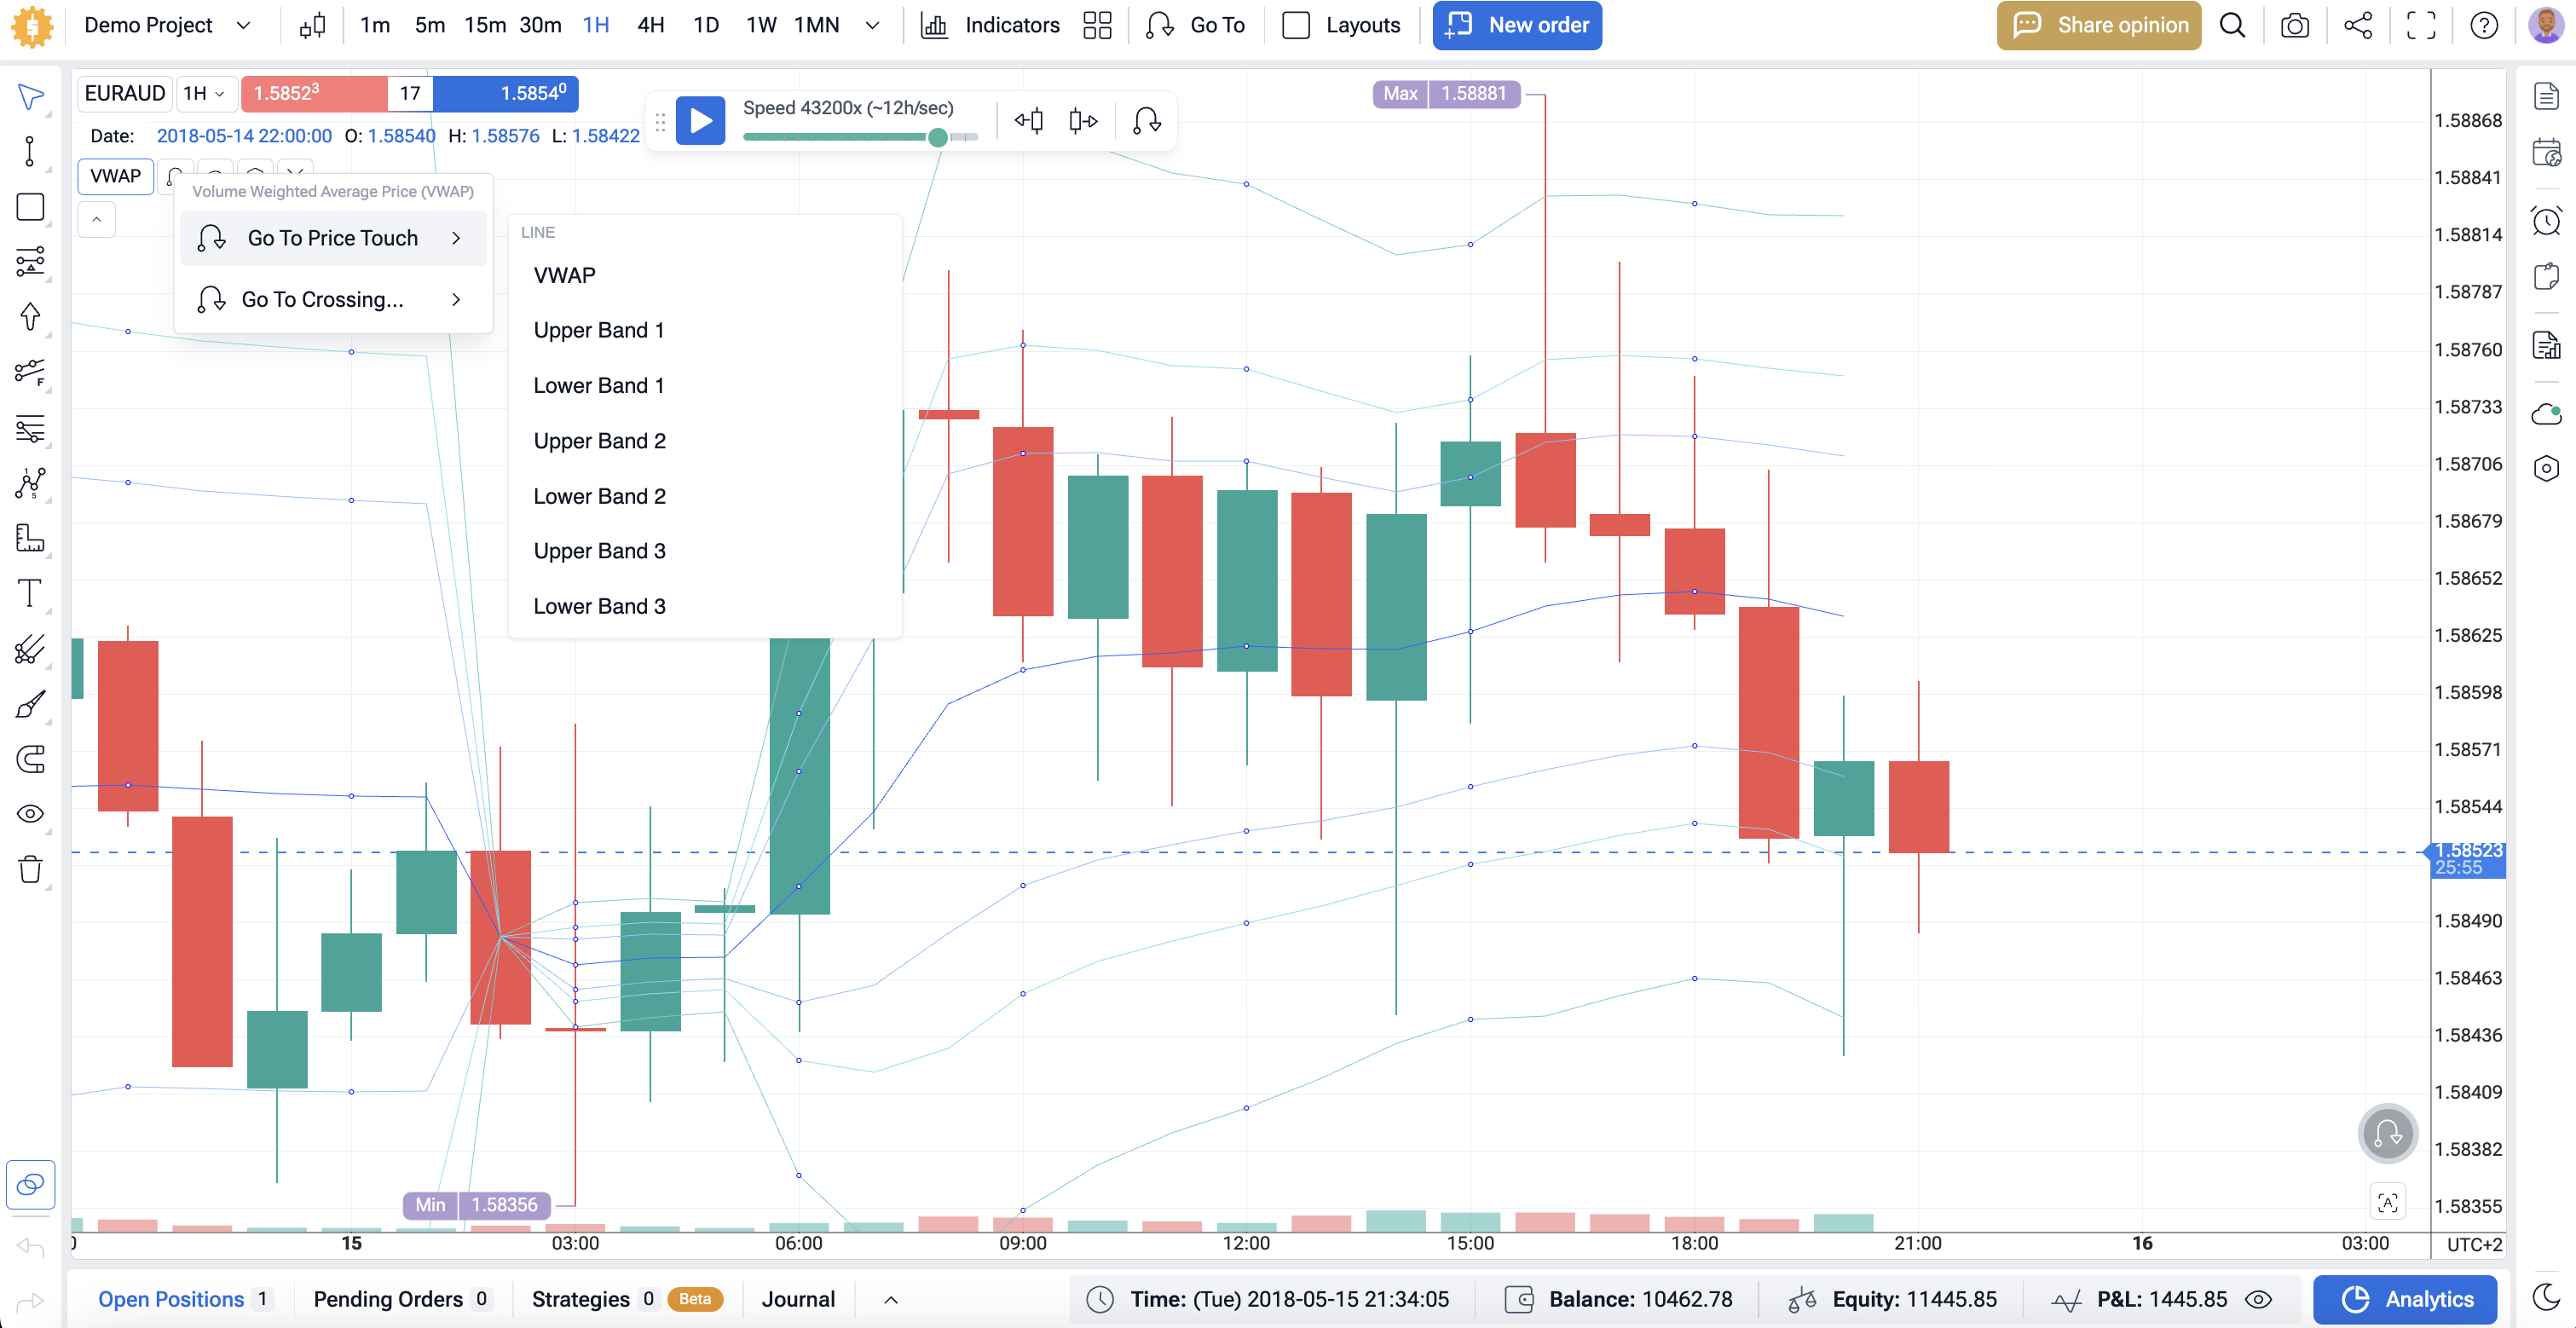
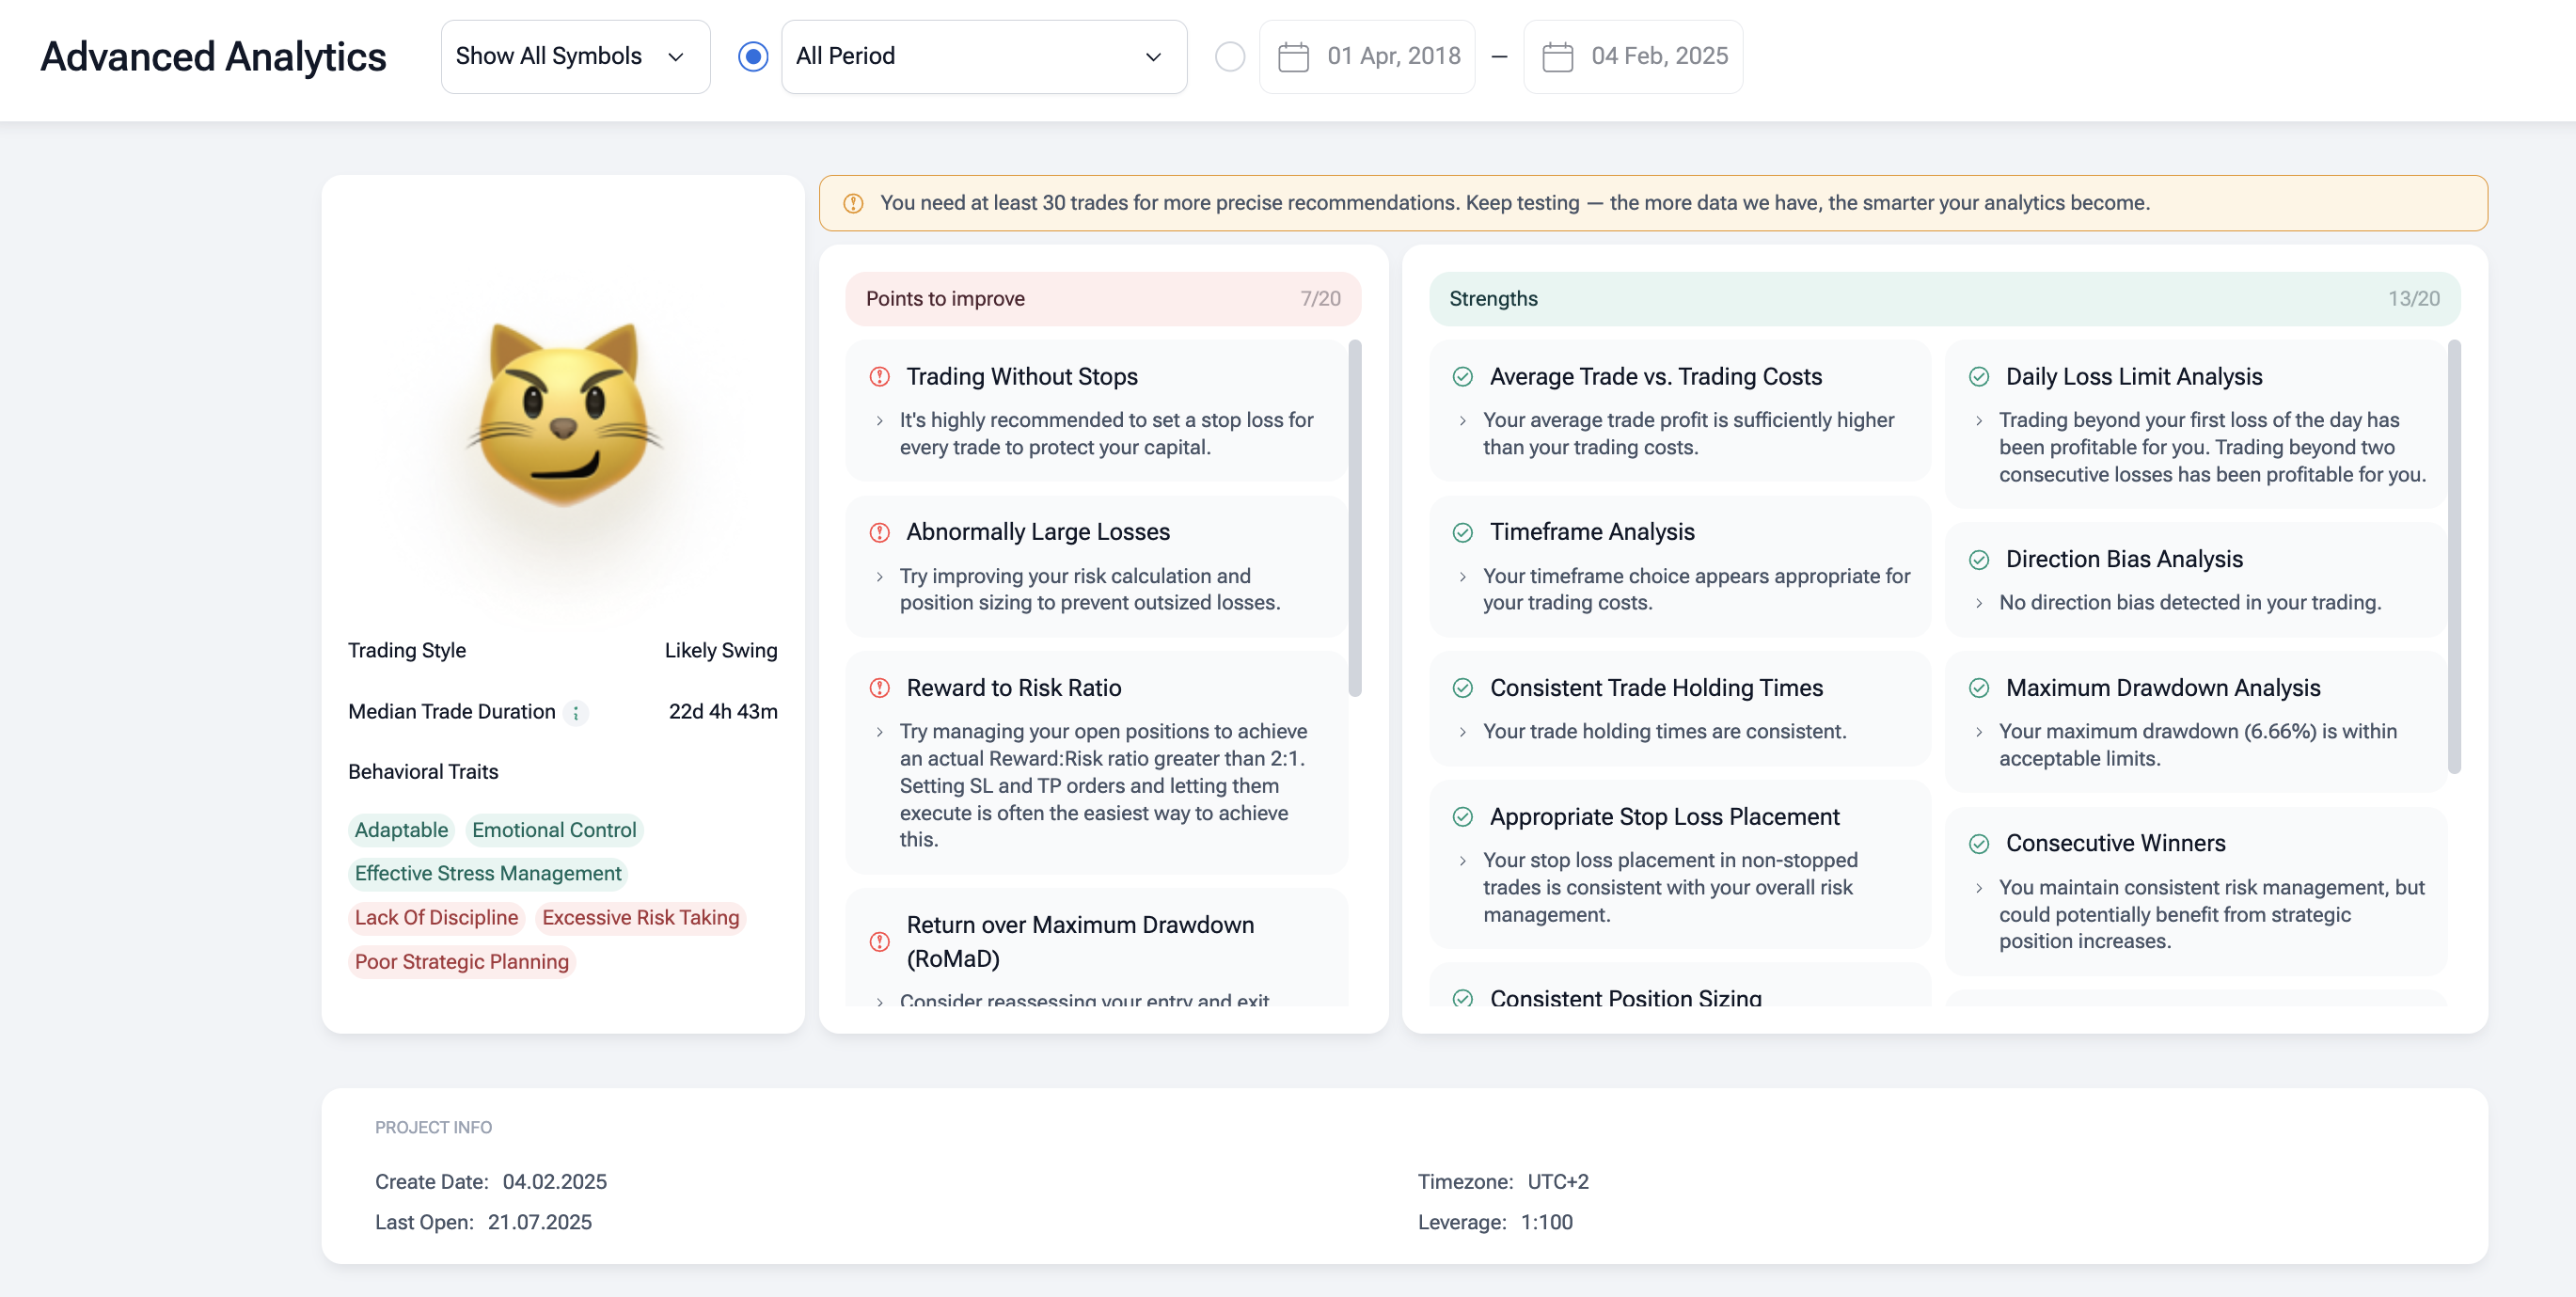
Our backtesting software replays real markets tick-by-tick across forex, commodities, stocks, and crypto. You can test RSI, MACD, Moving Averages, and Bollinger Bands on clean historical data, then read hard stats: win rate, payoff, drawdown, MAE/MFE, equity curve.
Use FTO to compare RSI vs MACD entries, confirm with support and resistance, and pressure-test risk management before going live.
✅ 20+ years of tick data
✅ Custom technical indicators
✅ Integrated news feed
✅ AI trading analysis
✅ Automated tests using AI assistants
✅ Technical analysis filters
✅ Mystery Mode to hide future bars
✅ “Jump to” specific time frame meeting required conditions
✅ Prebuilt market scenarios
✅ Detailed analytics and latency logs
✅ Prop Firm challenges
✅ And more…
Spend several hours on Forex Tester Online to sharpen your strategies and risk management before you start risking real money on live market.
Common Mistakes to Avoid When Using These Indicators
Don’t rely too much on one indicator. Use RSI and MACD with other analysis for a full view.
Also, don’t ignore the big picture. Consider market trends and news with RSI and MACD signals.
Conclusion
Understanding technical indicators like RSI and MACD is key for smart trading. The Relative Strength Index (RSI) and Moving Average Convergence Divergence (MACD) are powerful tools. They help in different ways when analyzing the market.
Knowing the differences between RSI and MACD helps traders use them better. These tools can give insights into market trends and when things might change. They are useful alone or together.
Choosing the right indicators and using them well is the secret to success. Mixing RSI and MACD gives a clearer view of the market. This helps traders confirm signals and make better predictions.
In short, RSI and MACD are vital for traders. Knowing how to use them can improve trading decisions. This way, traders can handle the financial markets with more confidence.
FAQ
What is the main difference between RSI and MACD?
RSI shows how much prices have changed recently. It helps spot when prices are too high or too low. MACD, on the other hand, looks at the relationship between two moving averages. It helps identify trends.
Can RSI and MACD be used together in a trading strategy?
Yes, you can use RSI and MACD together. This combination helps confirm trading signals. It makes trading decisions more informed.
How do I identify overbought and oversold conditions using RSI?
To spot overbought or oversold with RSI, look for values above 70 or below 30. These levels indicate when prices might be too high or too low.
What is the best timeframe for using MACD?
The best time frame for MACD depends on your trading strategy. It’s often used on daily or weekly charts. This helps identify trends and their strength.
How do I trade MACD crossovers?
To trade MACD crossovers, watch for the MACD line crossing the signal line. A bullish crossover means the MACD line goes above the signal line. This is a buy signal. A bearish crossover means the MACD line goes below the signal line. This is a sell signal.
What are the common mistakes to avoid when using RSI and MACD?
Avoid relying only on RSI or MACD. Also, don’t ignore the overall trend. Make sure to adjust the indicators for the current market conditions.
Can RSI be used in any market condition?
RSI works best in trending markets. In markets that are not trending, RSI might give false signals. Always use it with other tools or indicators.
How do I adjust RSI and MACD settings for different markets?
Adjust RSI and MACD settings based on market volatility. For very volatile markets, use a longer RSI period or a slower MACD setting.
Forex Tester Online
Practice RSI and MACD without risking real money backtesting it via FTO
 ไทย
ไทย
 Tiếng Việt
 Polski
 Türkçe
 Nederlands
 Română
 한국어
한국어
 Svenska


