Summarize at:
Since the development (in the early 50’s of the last century) by the financier George Lane, this oscillator not only helped to make money, but also saved millions of traders from busting. The task of the group of indicators under the general name Stochastic is to search for reversal situations in order to enter the market with a new trend or to close positions in time.
Stochastic Oscillator shows position of the current price relative to the range over a certain period and helps to «see» the moment when the sellers/buyers’ balance is broken on the market and the price of an asset is ready to change its direction.
It doesn’t matter what asset you trade and how you do it, today (of course if you respect the technical analysis at least a little bit!), it is difficult to avoid using (with varying degrees of reliability) any of the versions of this classic tool.
What is Stochastic Oscillator?
Stochastic indicator is a simple momentum oscillator which has been around since the late 1950’s. What the Stochastic oscillator does is to determine just when a currency pair is oversold or overbought – which is why stochastic forex indicators are such an integral part of forex trading. Stochastic trading is widely used by most forex traders, even though the oscillator is over 50 years old – which suggests just how useful it has been in all the decades it has been around.
The following formula is used to calculate the indicator…
%K = 100[(C – L14)/(H14 – L14)]
C = the most recent closing price
L14 = the low of the 14 previous trading sessions
H14 = the highest price traded during the same 14-day period.
%D = 3-period moving average of %K
Stochastic Oscillator: Logic and purpose
Stochastic Oscillator is a typical impulse indicator of the price rate (like RSI or WPR). It determines speed of the market by a relative position of closing price in the range of max/min for a certain period. As a result, trader gets the probability of updating the price extremum, that is, he can assess the chances of continuation of the trend (see What is the Stochastic Oscillator).
The author’s trading idea is as follows: on a bull trend (uptrend), the closing price of the current timeframe should be located in the zone of the previous max (for the billing period); on a downward trend, the closing price should stop in the zone of the previous min. It is believed that Stochastic is more accurate than Williams’ %R line, since it contains several steps to correct market noise and suppress «false» signals.
is about 50 − there is no tendency to change the trend.
The value of the indicator in the range from 70 to 100 means that market is overbought; if the value is 30 (and below) – the market is oversold. In critical areas, the indicator slows down − the leading group of players weakens, and if a reversal of Stochastic occurs, the probability of price movement in the opposite direction increases.
The direction and character of behavior of the indicator’s lines show how strong the price impulse can be. If the value is about 50 − there is no tendency to change the trend.
Stochastic Oscillator: Calculation procedure
In the basic version, the Stochastic Oscillator indicator consists of two lines − a «fast» stochastic %K (it is a solid line by default) and a «slow» stochastic %D (dashed line).
It is believed that for most trading assets with an average level of volatility, the SMA smoothing method shows the most stable results, while for the high-volatility assets, the EMA method is preferred, and for the stock assets, the EMA from a typical price method is sometimes applied. The range of values (in %) is from 0 to 100.
Stochastic Oscillator:Parameters and control
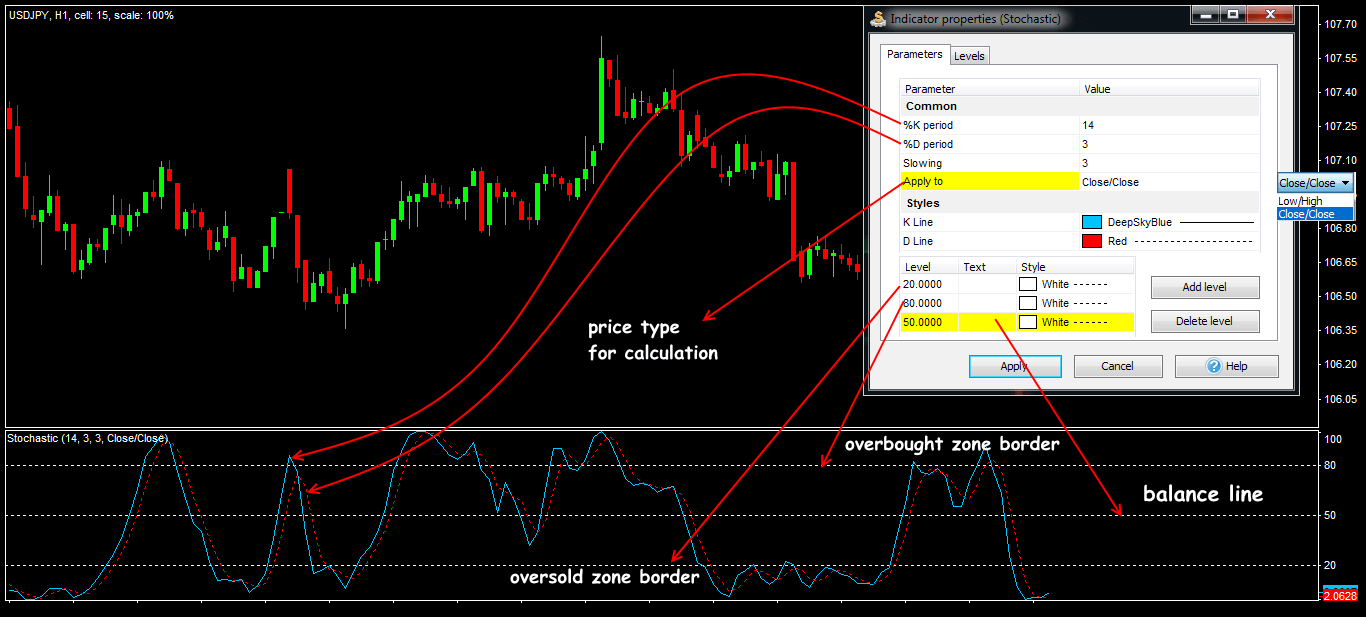
Traditionally for this type of indicators, the Stochastic Oscillator is located under the price chart in a separate window with a scale of values (0;100). Besides the main lines, there are also two basic levels: 80(70) for overbought area and 20(30) for oversold, and a balance line (50).
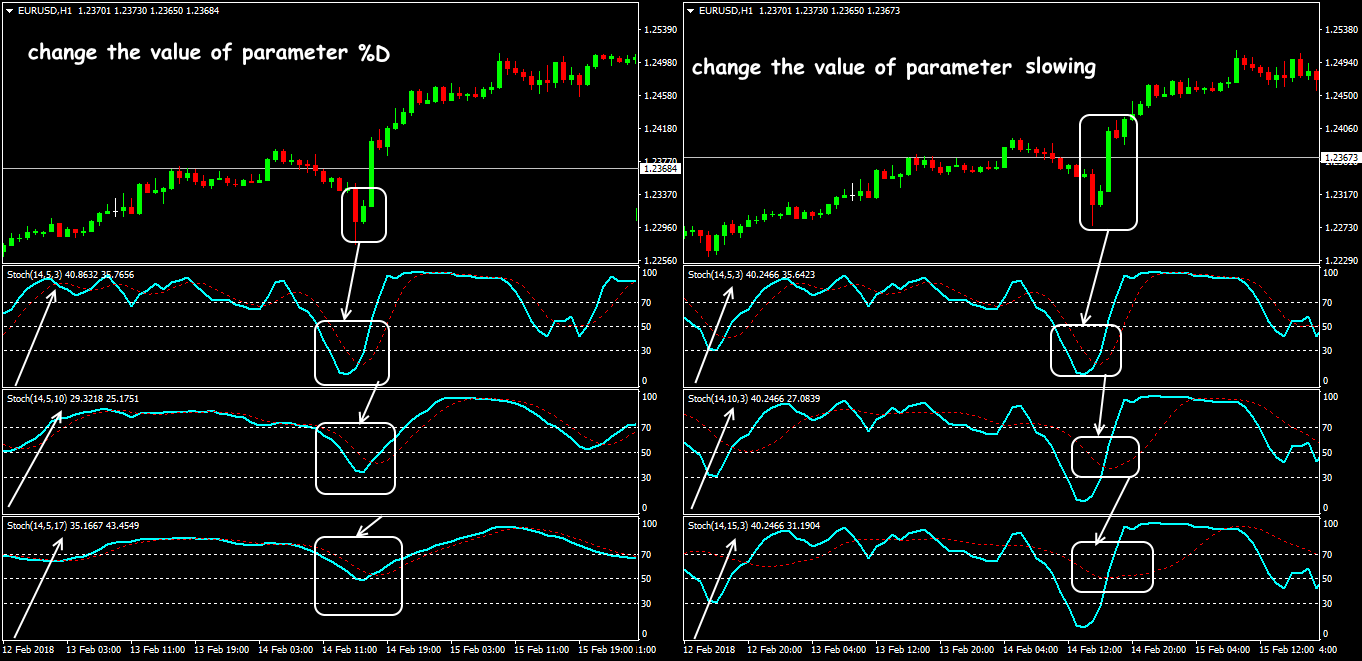
The most important parameter is the number of bars for calculation, the others only determine the degree of correction of the %K and %D lines. In the standard version of the indicator, there is an additional Slowing parameter that serves for using a certain number of the K% values for a further smoothing of the indicator.
For example, if the deceleration parameter value is 3, then only the last 3 K% values (averaged to one value) will be used to generate the K% line.
Today, the parameters recommended by George Lane (the period from 9 to 21), should not be considered as the ultimate ones − it is better to choose by yourself. The default settings (5/3/3) work quite effectively for the currency assets, although it is believed that the optimal parameters depend on the timeframe.
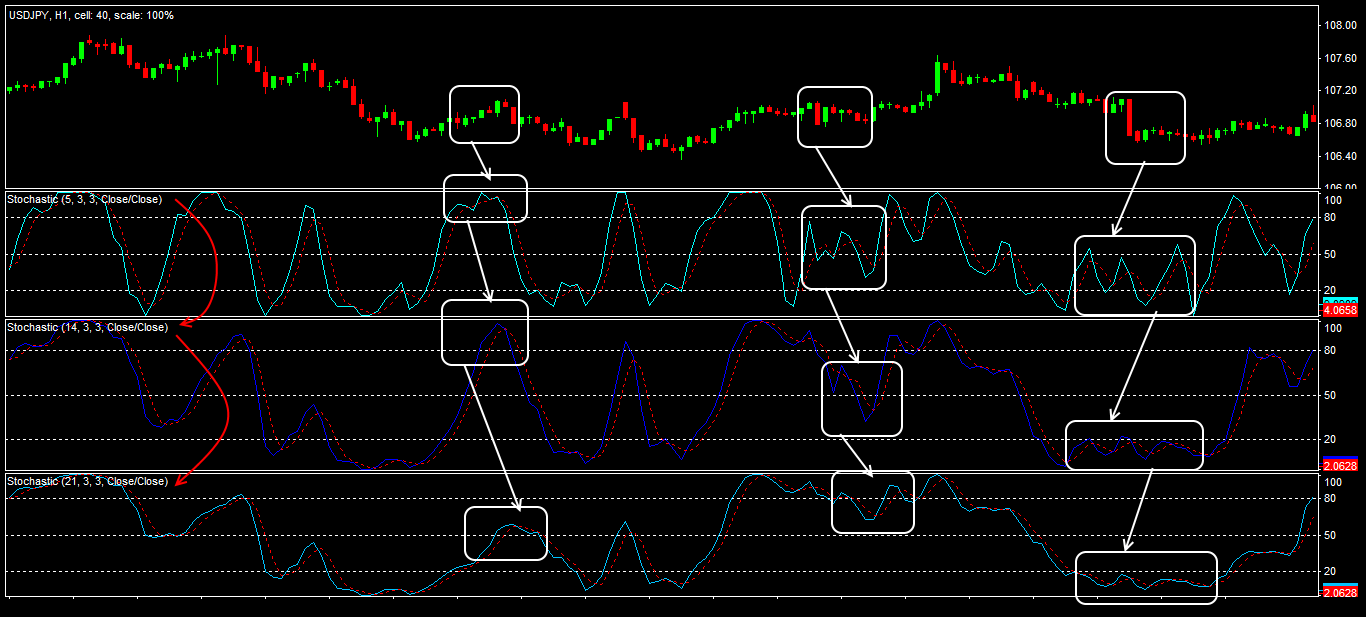
The larger the timeframe, the shorter the calculation period of the main line. So on the timeframes up to M30, you can choose period 9-13, on the H1 timeframe, parameters (13/5/3) work well, and on H4 and above − period 5-9 is preferred. By the way, to search the divergences and control the critical zones, it is recommended to use different parameters, read more about it below.
The higher the indicator’s period, the less sensitive it becomes to insignificant market fluctuations, and the more decelerated it will be. Like any oscillator, Stochastic gives the most reliable signals on the periods from H4 and higher.
Changing the boundaries of critical zones should also be done cautiously. Reducing the top level to 70 or raising the lower level to 30 increases the number of possible trading signals, but their credibility is reduced.
Increasing of the smoothing parameters will make the indicator reach the extremum zones faster and stay in critical areas longer. This will allow you not to miss any serious reversal of the trend.
If you reduce the smoothing parameters, the main lines will be in the central zone much longer, which is favorable for long-term trading. But trading signals of the reversal will appear much less often.
It’s time for trading signals – let’s look at it in detail.
Trade signals of the Stochastic Oscillator indicator
Before using the Stochastic Oscillator, we remind you that its trading logic is similar to the standard impulse indicators. It is considered that Stochastic gives the following types of signals.
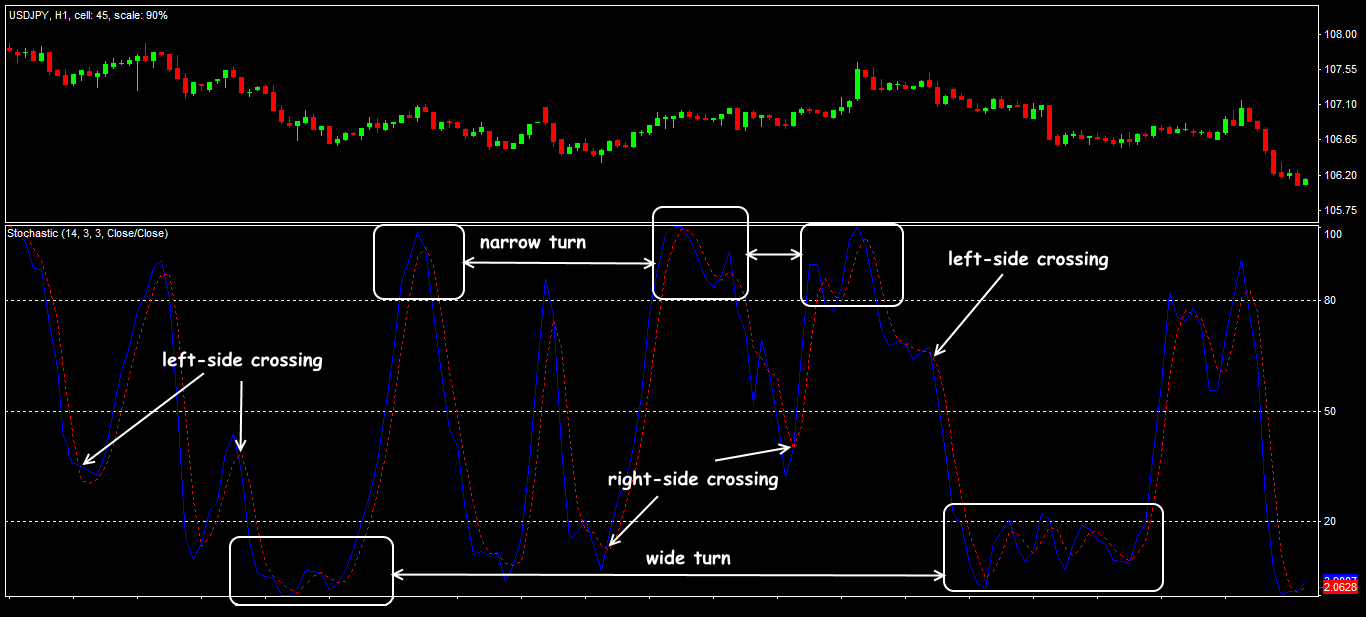
Crossing of the fast and slow indicator’s lines
The signal line reacts faster, so its behavior is considered the key one for making a decision:
- if the %K line crosses the rising %D line from the top downwards − we open only a Buy order;
- if the %K line crosses the descending %D line from the bottom upwards – we open only a Sell order.
Stochastic fans distinguish right-handed and left-handed crossing of indicator’s lines. Right-sided crossing is considered more reliable.
Crossing the boundaries of critical zones
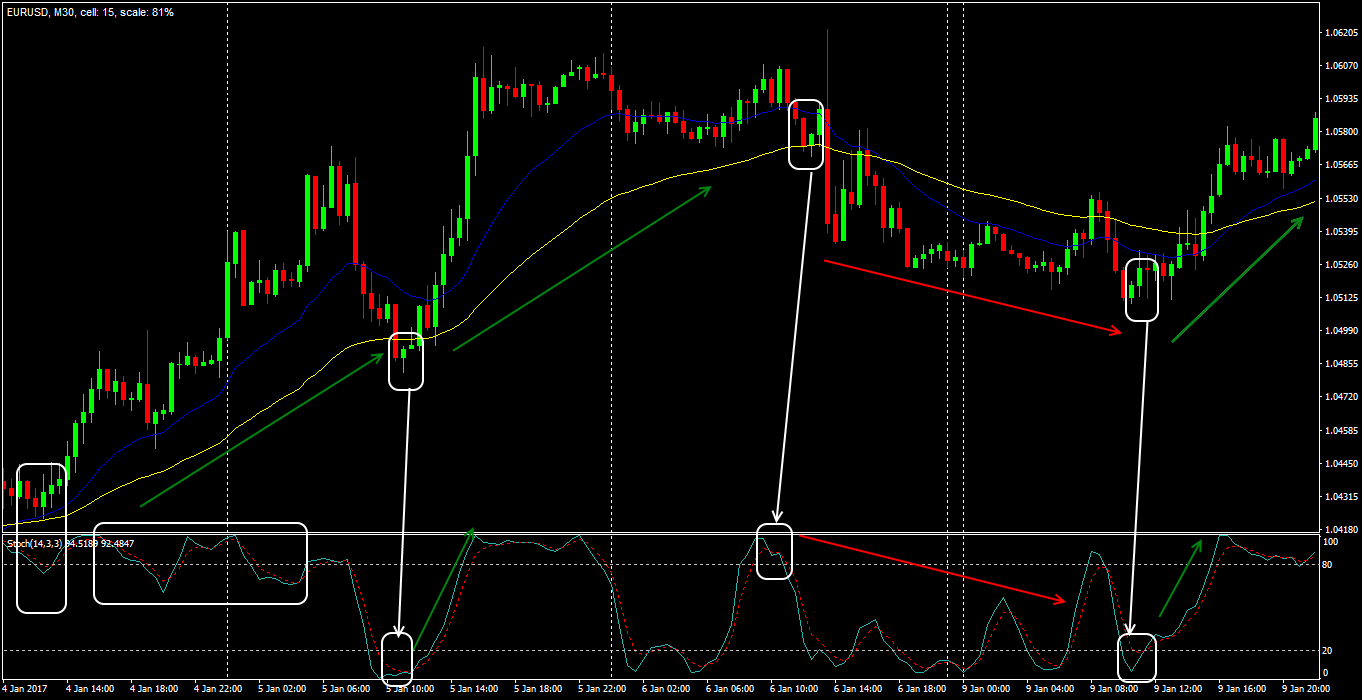
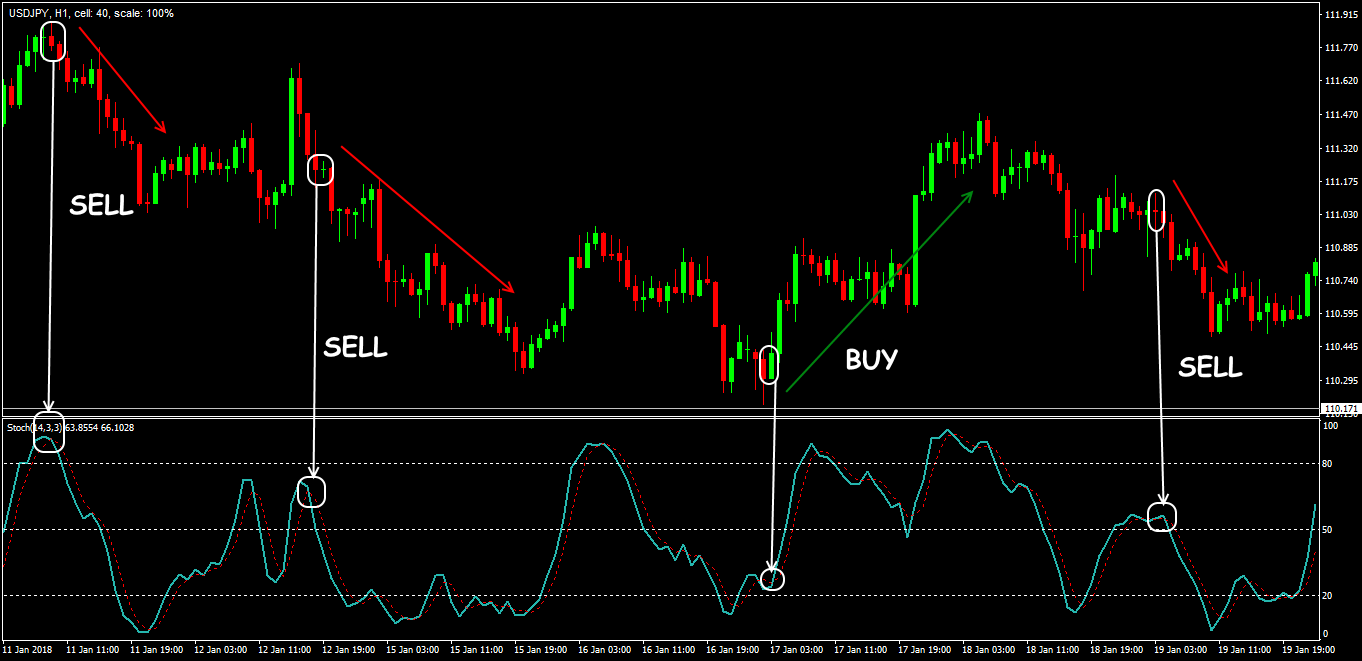
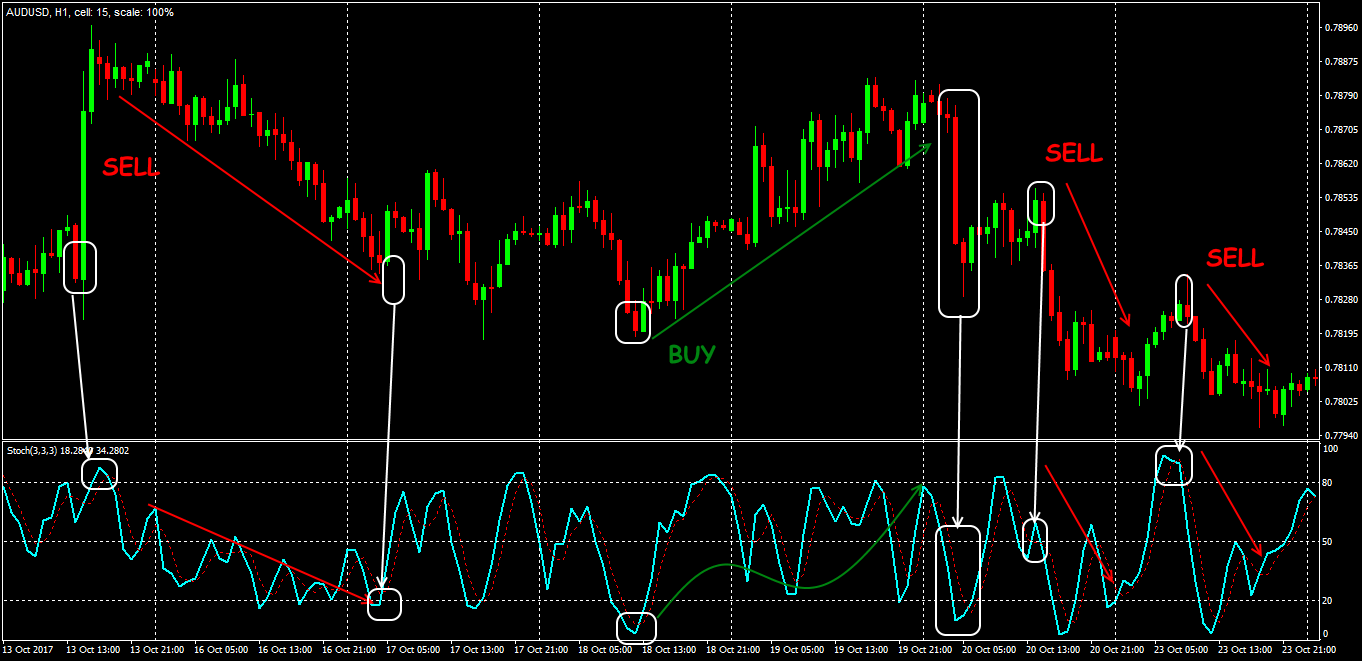
When there is a breakdown of the overbought level 80 (70) on the bullish trend, it is considered the first signal of the growth’s stop and (perhaps!) of a downward turn.
When the main line crosses the level 20 (30) on the downtrend, it is a signal of the declination’s stop and of a possible upward turn.
The behavior of the %K line in the critical zone is interpreted as follows:
- a bottom-up turn and exit from the oversold zone is a signal for purchase;
- a top-down turn and exit from the overbought zone is a signal for sale.
It is recommended to pay attention to the shape of the reversal in the overbought/oversold zones: if a sharp extremum is obtained, the movement after the turn will be strong and rapid, and if the turn occurs after the flat period in the critical zone – it will be weaker.
If the indicator’s lines only enter the critical zone (below 20 or above 80), then it is better to hold back from transactions; only exiting the zone after a turn can be considered a trading signal.
The divergence of the Stochastic lines and of the price chart
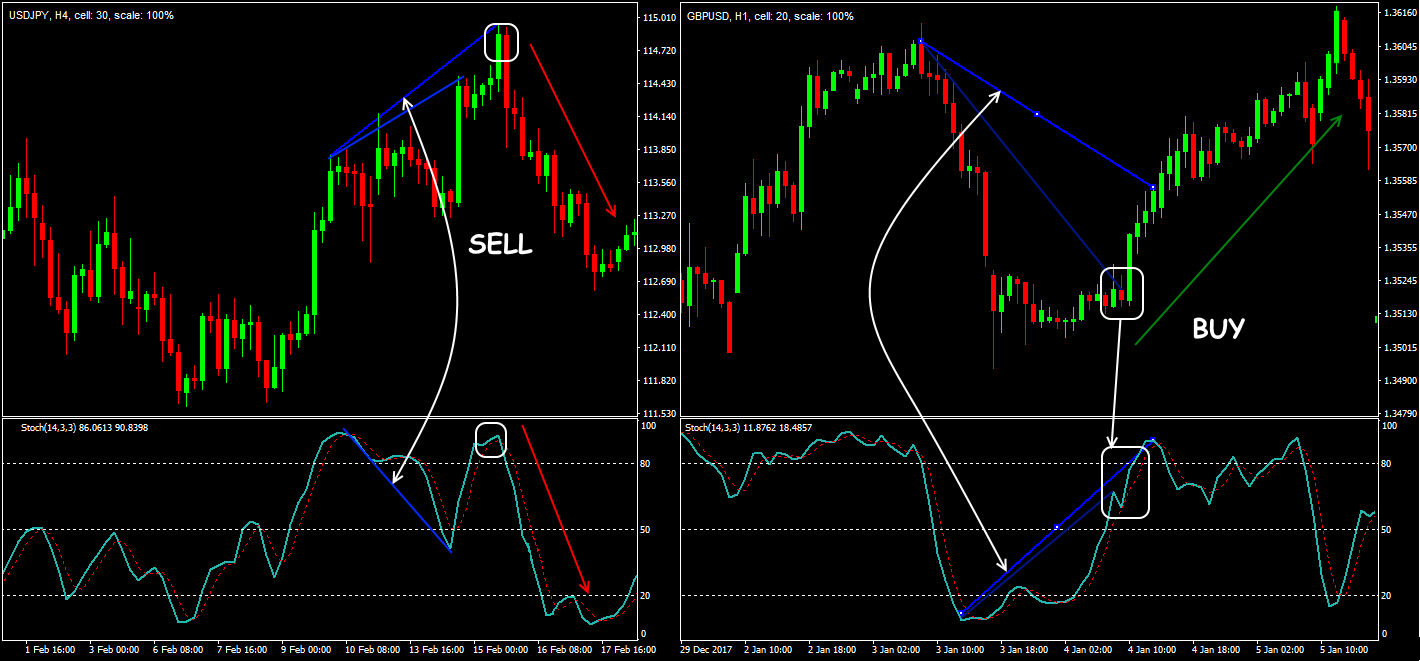
Strong (but rare!) advanced signal of trend’s reversal. Even if such situation is visible, it is necessary to analyse intersection of the indicator’s lines and behavior in the critical areas to make a decision. So:
- Open a BUY order if the price shows a new Low (local), and the indicator’s line couldn’t break its min; the indicator’s value at this moment is above the oversold boundary. Stop Loss is below the last local price min.
- Open a SELL order if the price forms a new local High, and Stochastic cannot renew its max; the indicator must be in the overbought zone at the moment of forming a divergence. Stop Loss is located above the local price max.
Breakdown of the balance line
The central line of Stochastic is a border between the bull zone (50-100) and the bear zone (0-50). If the indicator is near level 50 (the price is near the middle of range), then there is uncertainty in the market. If, after crossing the balance line, Stochastic continues to move upwards, then the bulls become stronger; if downwards, then the bears become stronger.
Practice shows that the price reaches, at least, the middle line after a turn from the critical zone. The situations when the price comes back without reaching the balance line are extremely rare.
The result?
If Stochastic is stably located in the range from 100 to 50, then there is an uptrend in the market (with a tendency to continue), if it is in the range from 0 to 50 – there is a downward trend. If there are additional signals, it is quite possible to open a deal after a confident breakdown of line 50.
Application in trade strategies
Most of the techniques use this indicator as a basic oscillator.
What this means is:
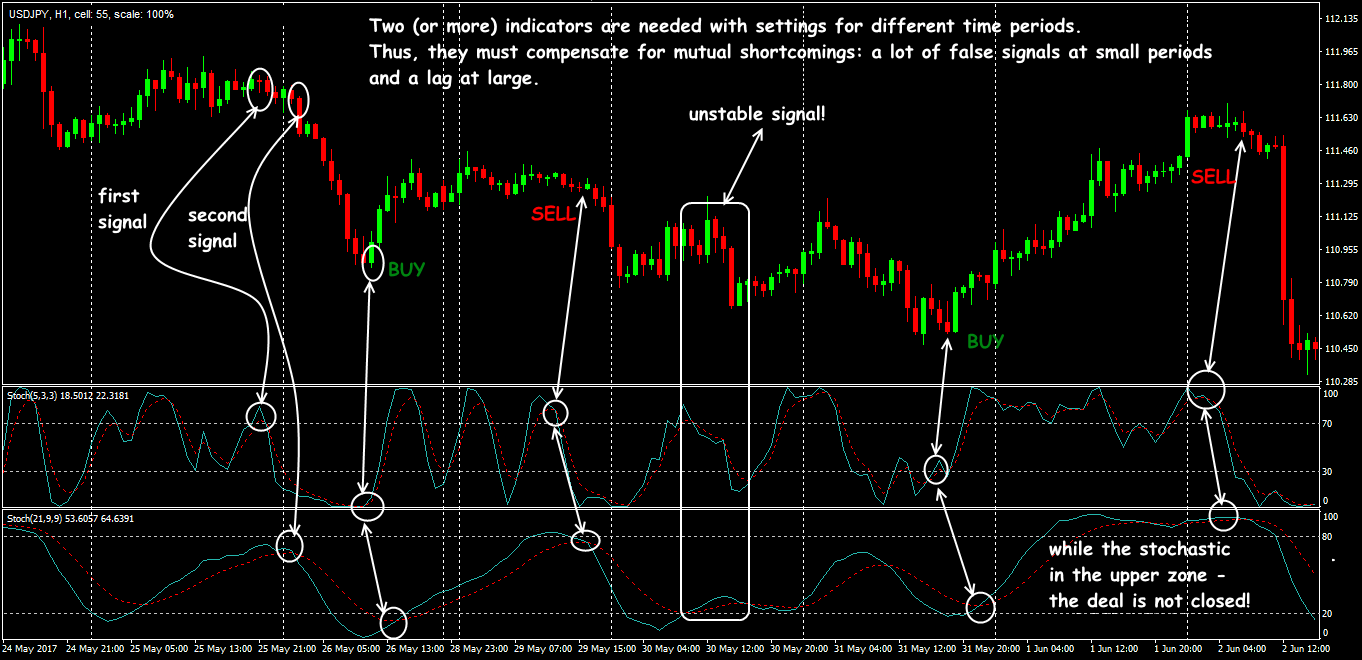
That you need to take into account the trading style to get a beneficial result from Stochastic: short-term setups help not to miss the trend, and long-term ones help to eliminate false signals (see Stochastic trading strategy).
Stochastic + Stochastic (сheck Crush it with Slow Stochastics).
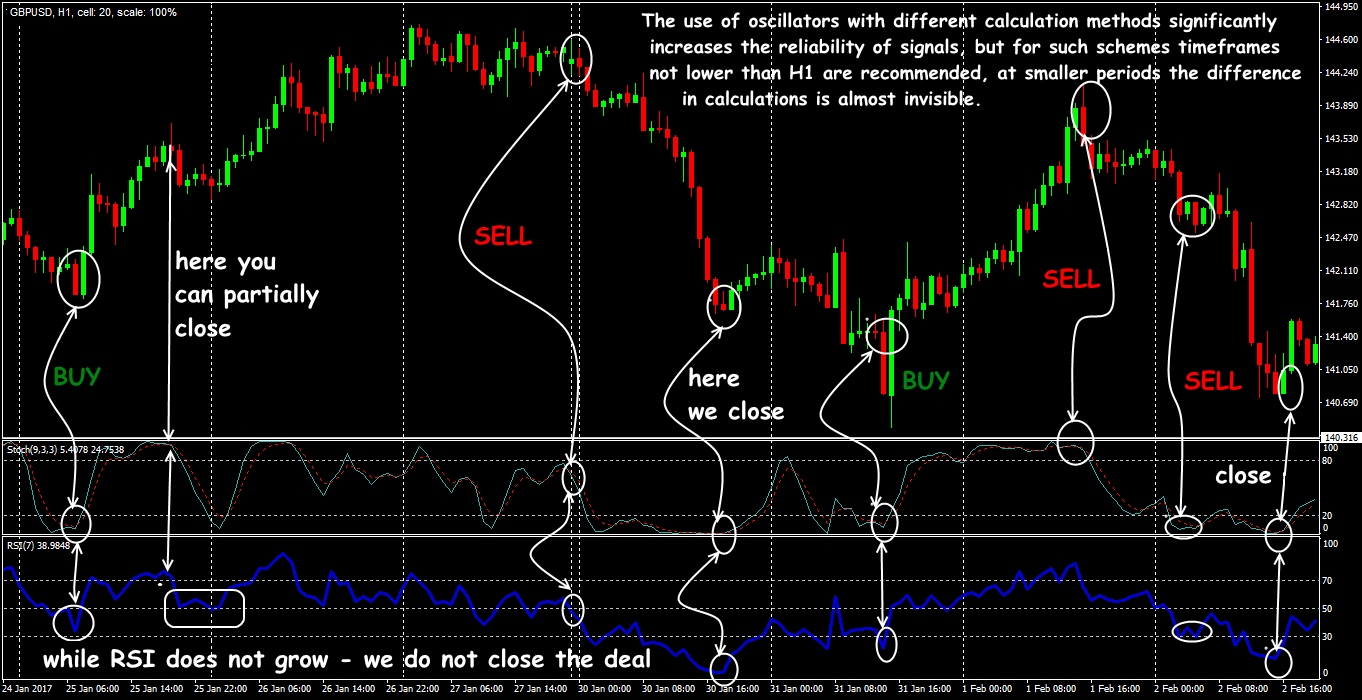
Stochastic + Oscillator
Stochastic + trend
To assess the trend, you can use any standard tools (moving averages, channels), and Stochastic confirms the trading signal.
MACD signals are in most cases ahead of Stochastic, the intersection of its lines is used as confirmation. To close an order, the opposite situation is needed: Stochastic reacts first. The strategy works on the periods from H1 and higher (check MACD and Stochastic: A Double-Cross Strategy).
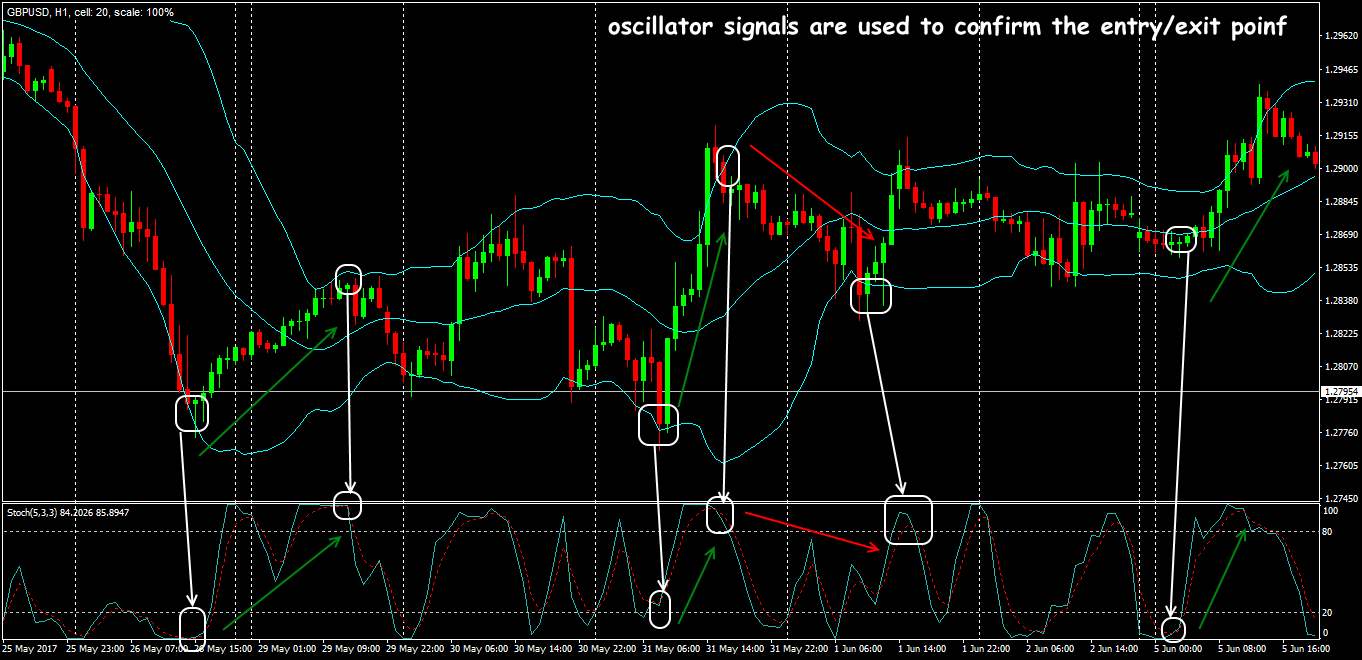
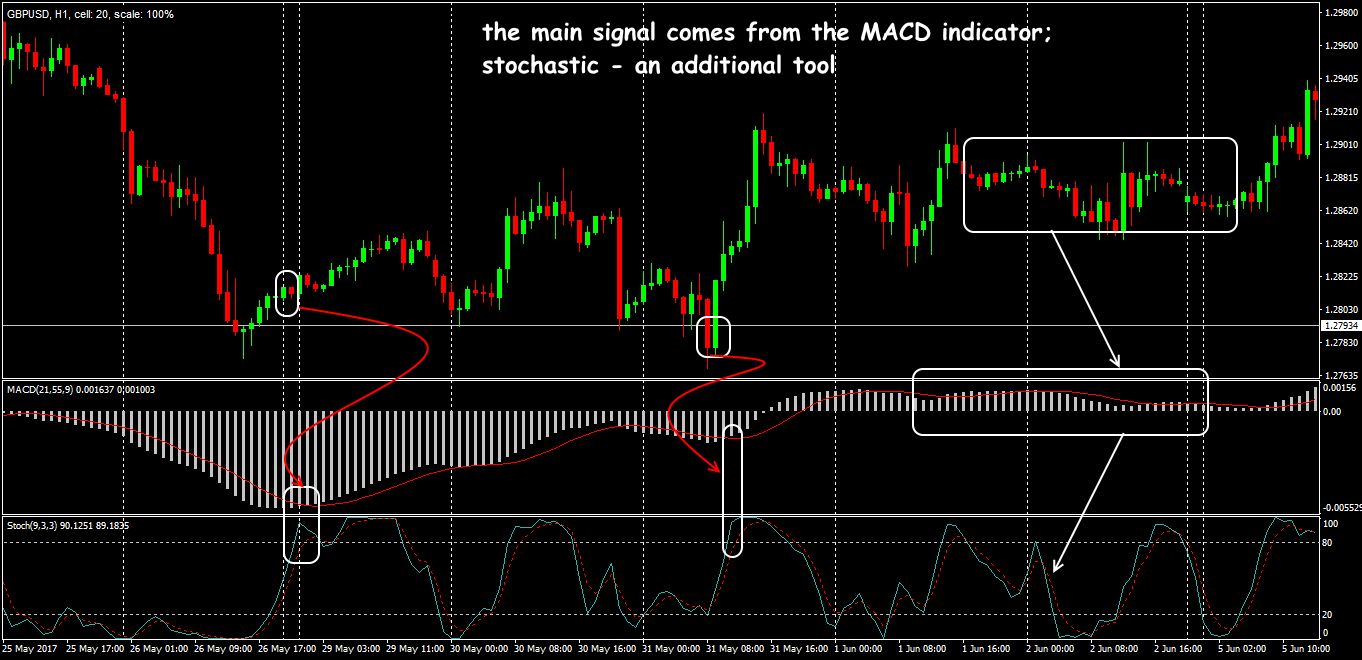 Stochastic Oscillator as a confirmation of the signal
Stochastic + Volatility
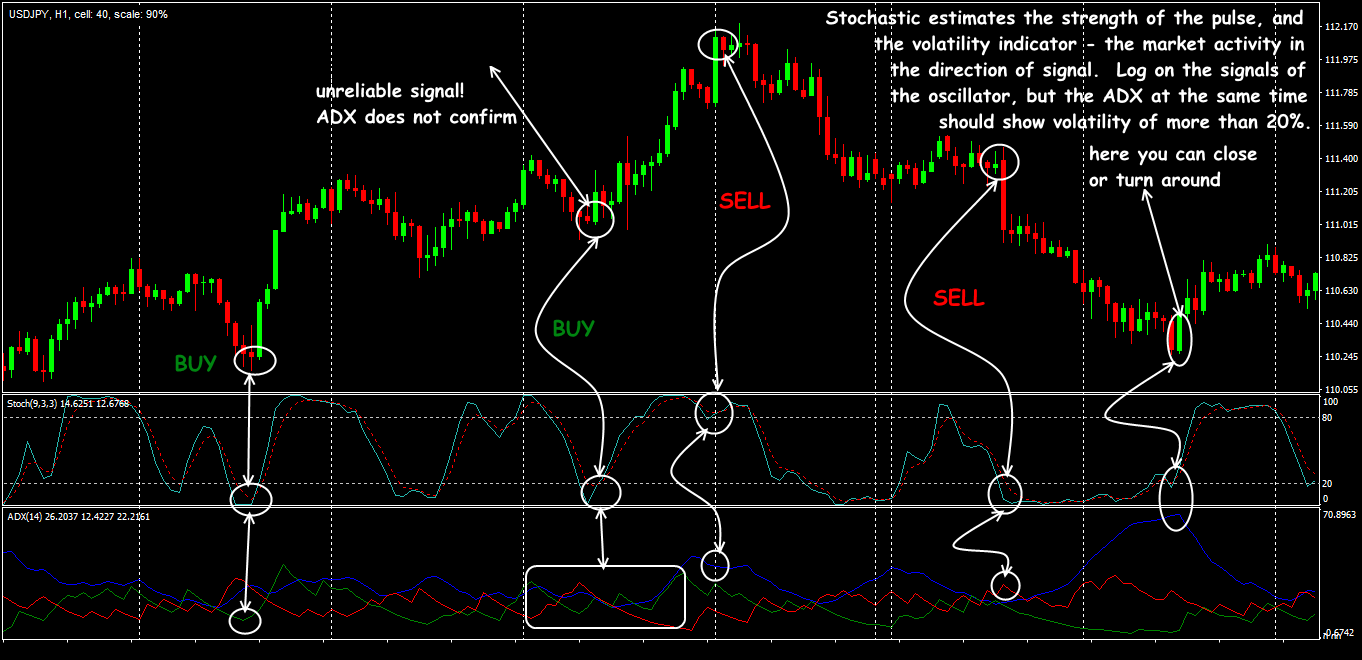
Stochastic + ADX strategy
These indicators understand the flat in a bit different way. The Stochastic signal is not always confirmed by the ADX lines, so it is recommended to add a moving average with a period of at least 20.
Several practical remarks
The indicator works well on the wide price ranges or on the soft trends with a slight inclination to the top/bottom. The market with a stable trend and minor corrections is not the best time for Stochastic Oscillator.
If Stochastic lines move synchronously during the counter-impulse period, and the fast line moves ahead of the slow one, the impulse is strong enough. If the impulse is accompanied by a constant intersection of the Stochastic lines, then its further development is doubtful (Use Stochastic Oscillator The Right Way).
When the Stochastic oscillator exits the critical zones, it doesn’t mean the appearance of an immediate entry point − it is necessary to analyse the overall trend. When there are sharp price impulses, the indicator quickly gets extreme values, and moreover, it can move within a critical zone for a long time. In this case, the loss of good entry points or, vice versa, the appearance of a large number of «false signals» is possible.
Simple strategy for using the Stochastic Oscillator for forex trading
Forex Stochastic trading is actually surprisingly easy. There are several different variations of Stochastic trading, we start with the easiest – Slow Stochastic.
 Slow Stochastic consists of two moving averages and is found at the bottom of the chart. The moving averages are between 0 and 100. The red line on the chart is the %K line in the formula and the blue line is the %D line. %D is the moving average of the %K line and always trails it. These lines are known as Stochastic lines.
The chart helps traders identify new trends in the market as and when they emerge and offer clues either when the momentum is increasing or decreasing – which would indicate how a trade is moving. When the two lines cross, they indicate a shift in momentum.
The signals given by the chart can always be strengthened and improved. The idea is to filter the trades so as to get a much stronger signal which would indicate the course of action to consider. There are two ways to do that.
Find out if there are any Crossovers at Extreme Levels
Some signals are stronger than others, and these are the ones to be noted. It is not necessary to observe every signal given by the fast Stochastic oscillator. The first thing to do is to identify the crossover of the Stochastic lines that occur at the most extreme levels.
Typically, the Stochastic indicator is bound between 0 and 100…. When it is over 80, it indicates “overbought” and when under 20, it indicates “oversold”.
So, if there is a cross-down at above 80, then it suggests a potential shift in trend, lower from the overbought levels. Similarly, a cross up that occurs just below 20 suggests a possible shift in trend, higher from oversold levels.
Time a Buy/Sell using a Higher Time Frame in the Direction of the Trend
One of the things you will observe during Stochastic forex trading is that when there is a very strong uptrend, the Stochastic oscillator remains in the overbought levels for a long time. Now, this may send many false “sell” signals if you’re not careful enough. Obviously, you should not sell a strong uptrend, especially when the trade still has some way to go.
So, when you find a strong uptrend, look closely for a dip, or a correction, which would allow you to time a buy. This means waiting patiently for an intraday chart to show a correction and show oversold indications.
When this happens, and the Stochastic lines cross up from the oversold levels, then this is the signal to buy that you’re looking for, and this in effect reflects the much bigger trends. So this is how traders use the Stochastic indicator to time entries for trades in the direction of a bigger trend.
Try It Yourself
After all the sides of the indicator were revealed, it is right the time for you to try either it will become your tool #1 for trading.
In order to try the indicator performance alone or in the combination with other ones, you can use Forex Tester with the historical data that comes along with the program.
 Develop Stochastic Trading Strategy
 ไทย
ไทย
 Tiếng Việt
 Polski
 Türkçe
 Nederlands
 Română
 한국어
한국어
 Svenska
