When considering alternatives to StockCharts, it’s important to thoroughly evaluate each option to ensure it meets your specific trading and analysis needs.
Charting tools are essential in finance, helping to simplify and analyze complex data for better decision-making. Choosing the right tool can significantly affect how market trends are interpreted and understood.
What is StockCharts used for
StockCharts is a well-known provider of financial charting tools, offering detailed market data and a range of features to support both novice and experienced traders.
StockCharts features a straightforward interface with various chart types such as SharpCharts, Point & Figure, and PerfCharts. It allows users to customize their analysis through features like ChartLists and sector summaries. The platform also includes technical scans and alerts to keep users informed about market changes, supporting effective financial analysis.
Why Look for StockCharts Alternatives
As a trader, looking for alternatives to StockCharts can be driven by several factors related to its features and functionality that may not fully meet your trading needs.
Here are some reasons why you might seek other options:
- Limited customization: If StockCharts does not offer the level of customization you need in terms of chart settings, types, and indicators, it might limit your ability to tailor the analysis to your specific trading strategy.
- Real-time data access: Depending on your subscription level, access to real-time data might be restricted. Real-time data is crucial for day traders or those involved in highly volatile markets where price movements can be sudden and significant.
- Lack of data sources: Some other competitors offer more detailed data sets compared to StockCharts, which is, perhaps, the most important thing for such websites.
- Integration with trading platforms: StockCharts primarily focuses on charting and does not integrate directly with trading platforms for executing trades. Traders might prefer a more seamless experience where they can analyze and trade within the same platform.
- Backtesting tools: Many traders look for backtesting features to not only view the historical data, but to test their trading strategies to make even more informed decisions. Unfortunately, StockCharts is not a good fit for this.
And even if you are generally satisfied with StockCharts, exploring alternatives could provide you with tools that better fit your trading style, offer more value for money, or allow you to make timely and well-informed decisions. So, let’s look at the alternatives.
StockCharts Competitors: Overview
StockCharts is one of several charting tools available to traders and investors. While it provides a range of features suitable for various analytical needs, there are other platforms in the market that offer distinct functionalities, pricing models, and user experiences.
Each of these StockChart competitors offers unique strengths that might be preferable depending on a user’s specific needs such as cost-effectiveness, ease of use, advanced analytical tools, or integration capabilities. In the following sections, these platforms will be compared in detail with StockCharts on these parameters.
This part will introduce the major competitors to StockCharts.
1. StockCharts vs FTO
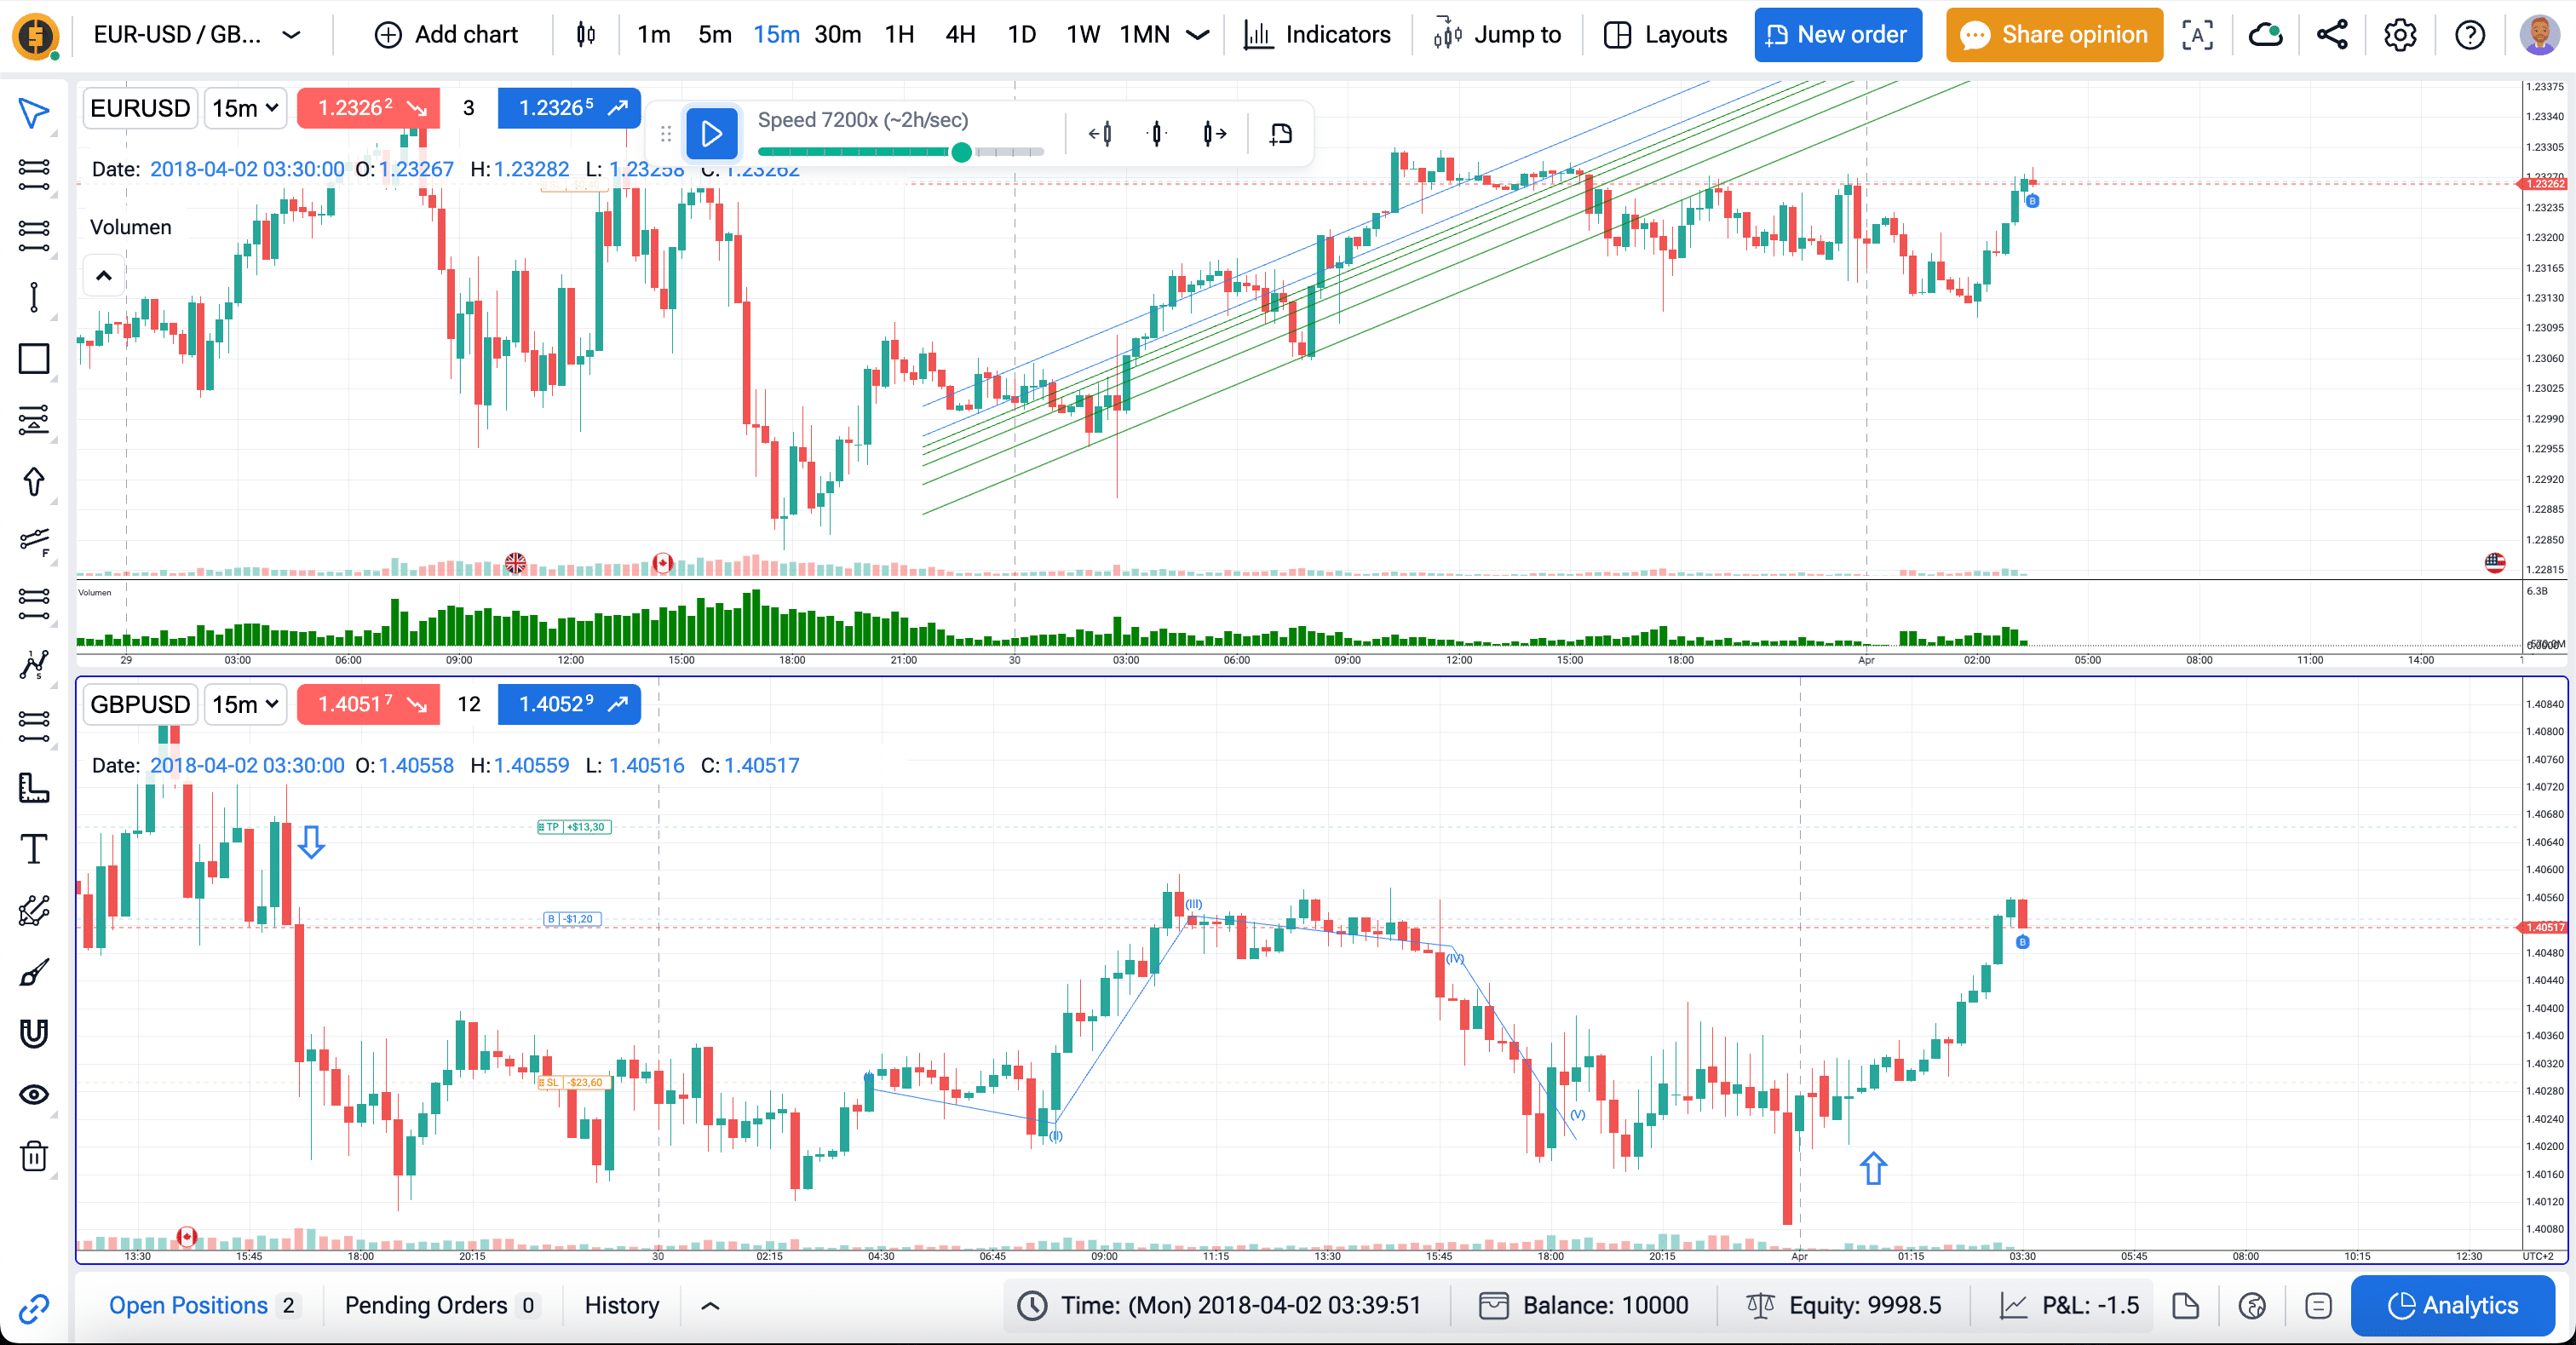
Forex Tester Online (FTO) presents itself as an optimal solution for traders focused on backtesting their trading strategies. Unlike StockCharts, which primarily offers charting tools and real-time data, FTO specializes in simulating trading environments to refine trading tactics without financial risk.
Key Features of FTO
- Web-Based Simulator: FTO operates entirely online, allowing users to access the platform from any device with internet connectivity, including Windows, MacOS, Linux, Android, and iOS. This accessibility is a significant advantage for traders who prefer flexibility and the ability to work from multiple locations.
- Advanced Backtesting Tools: FTO leverages real, high-quality historical data across 50+ symbols with up to 20 years of data. This extensive historical data is essential for accurate backtesting, providing a solid foundation for testing strategies over different market conditions.
- Speed of Testing: One of FTO’s standout features is its ability to speed up the testing process, and teleport to exact dates, events, and prices with “Jump to” feature. It can simulate trading environments at a pace 10 times faster than conventional demo accounts, drastically reducing the time traders spend waiting to see the results of their strategies.
- Risk Management: The platform allows for the setting of stop-loss and take-profit levels, and the tracking of open positions. This functionality helps traders implement and test their risk management strategies in a controlled environment. It also has news integration and custom scenarios for fundamental analysis.
- Cost Efficiency: While StockCharts requires a subscription for full features, Forex Tester Online has a lifetime access option, making it a cost-effective option for traders who are serious about backtestin.
| Feature | FTO | Stockcharts |
|---|---|---|
| Primary Use | Forex backtesting and analysis | Stock and ETF charting and analysis |
| Platfofrm | Web-based | Web-based |
| Device Compatibility | Supports desktop and mobile devices | Supports desktop and mobile devices |
| Key Features | Real-time backtesting | Real-time data |
| Historical data analysis | Technical indicators | |
| Open Market and Pending orders | Chart annotations and overlays | |
| Customizable alerts | Custom ChartLists |
FTO is tailored for traders who need powerful backtesting capabilities that StockCharts does not provide. The emphasis on simulating realistic trading conditions and allowing for rapid progression in strategy testing makes FTO a valuable tool for traders aiming to enhance their trading skills efficiently and safely.
These two programs provide different capabilities, so they complement each other perfectly. You can use one to create and analyze charts, and the other to backtest strategies.
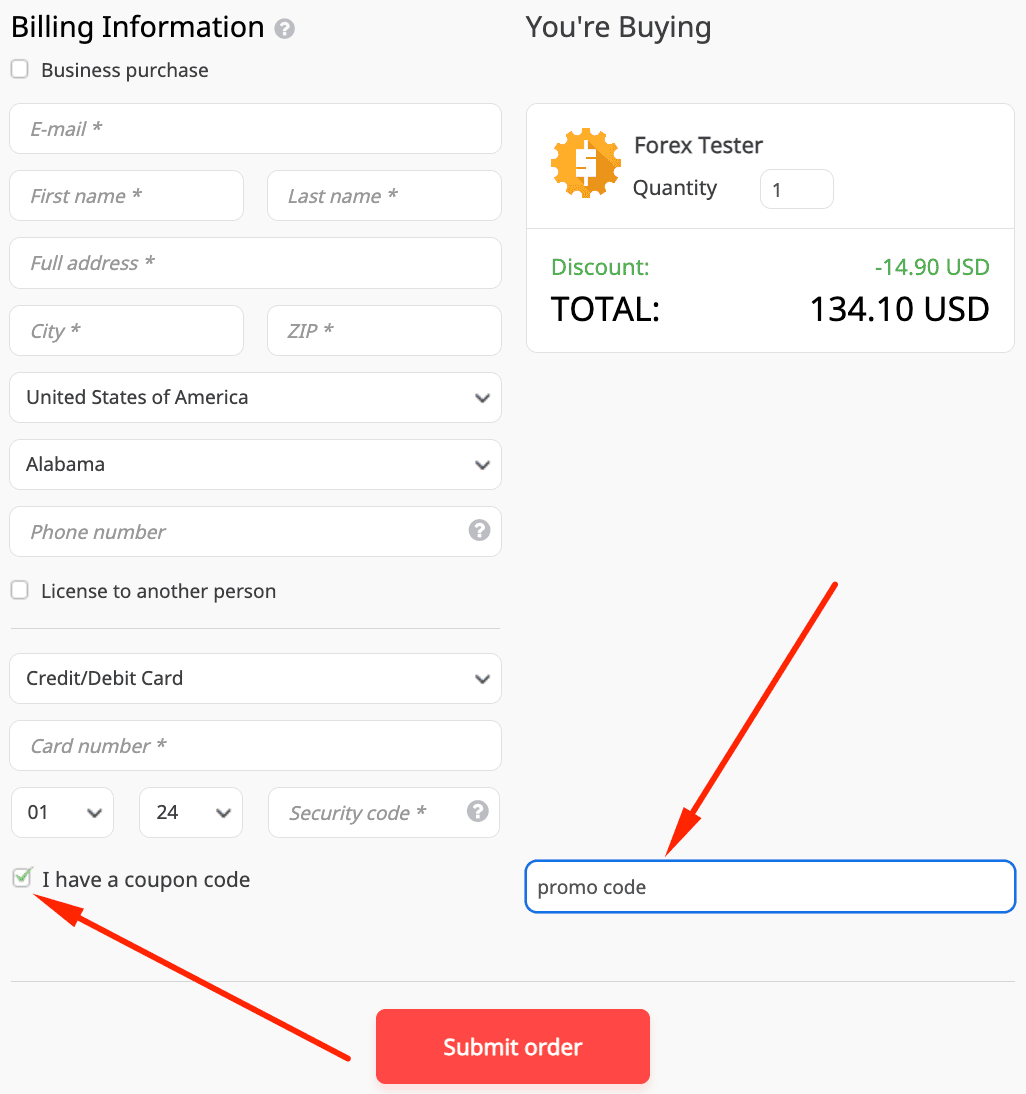
Apply STCK10 promo code to get a 10% discount on Forex Tester:
- Copy the Forex Tester coupon code STCK10.
- Head over to the Forex Tester purchase page.
- Select the Forex Tester package that suits you and click “Buy Forex Tester” or “Buy Forex Tester & Data”
- Paste the copied Forex Tester coupon code in the ‘Coupon Code’ box at the checkout.
- Done.
Now let’s compare other platforms similar to Stockchart.
2. StockCharts vs TradingView
TradingView is a popular platform that combines charting tools with a social network for traders. It is widely used by a variety of financial professionals, offering real-time data, diverse indicators, and a community where users can exchange trading ideas.
| StockCharts | TradingView |
|---|---|
| Mainly focused on providing detailed charts and analysis tools for stocks and ETFs. It is best for users who need deep technical analysis without the need for a social component. | Integrates community feedback with technical tools, making it useful for those who like to combine analysis with insights from other traders. |
| Suitable for a wide audience, including businesses and educational institutions, because of its collaborative features. | It caters more to individual traders and investors who require specific, in-depth market data and analysis tools. |
Although they serve different needs, TradingView and StockCharts can be used together. TradingView can help test ideas and learn from others, while StockCharts provides detailed technical studies for precise trading decisions. Combining both platforms can give traders a more comprehensive understanding of the markets, blending community insights with specialized analysis.
3. StockCharts vs Google Charts
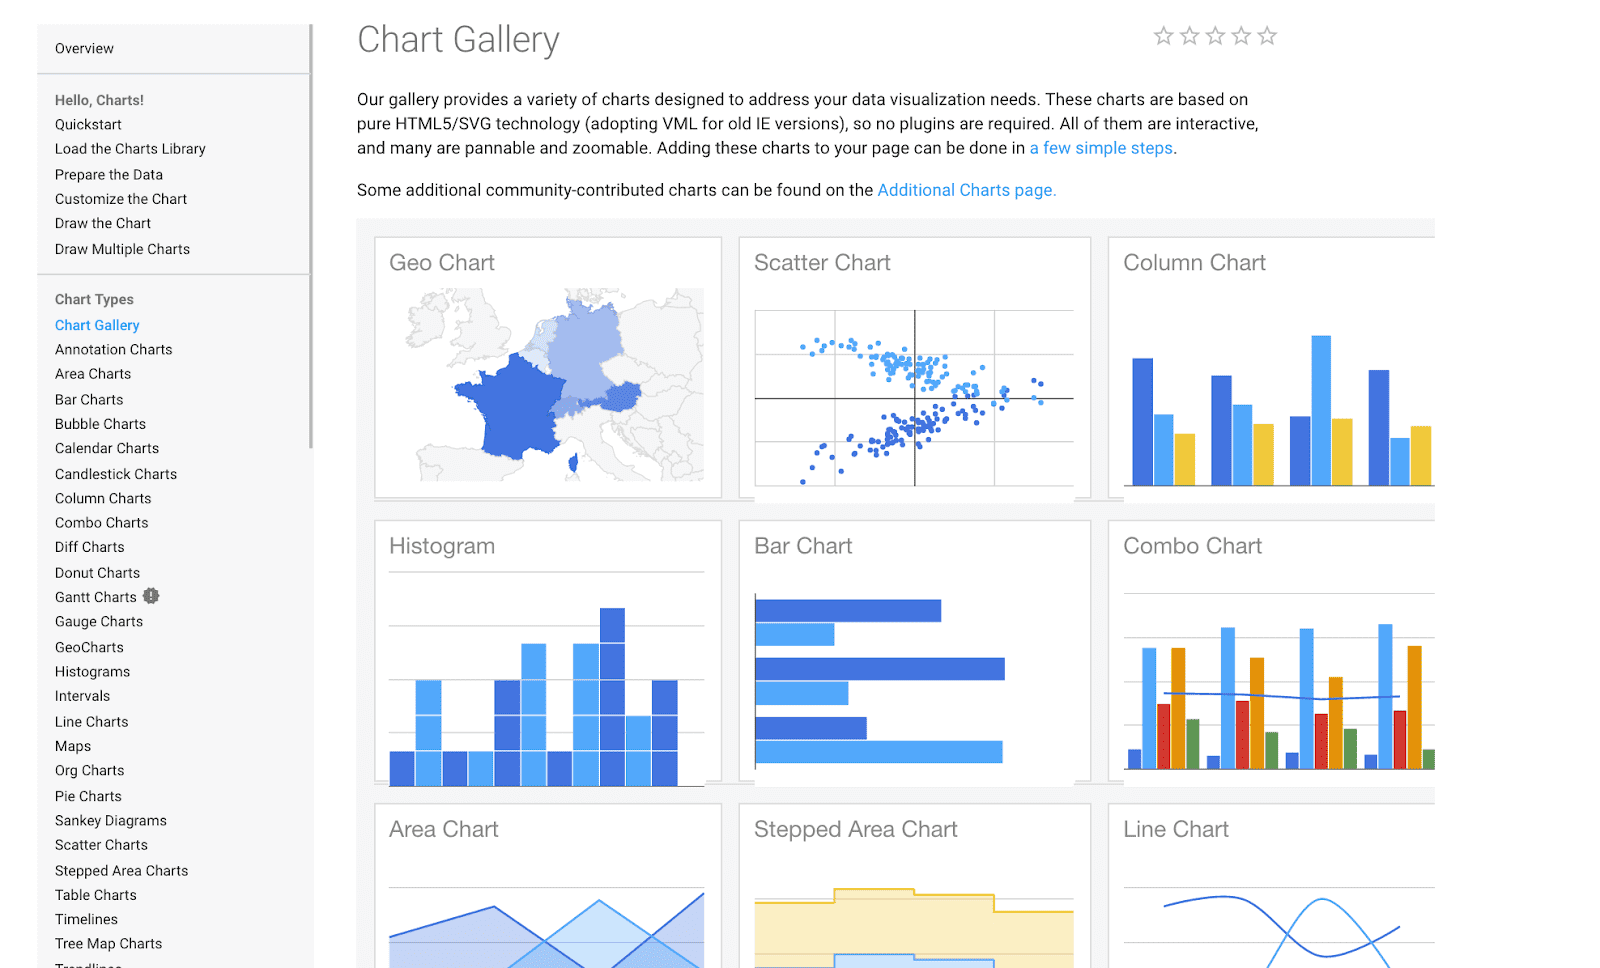
These two are both prominent tools in the Charting Tools and Libraries category, according to 6sense. But they serve distinct user needs and preferences. This section compares the two platforms based on market presence, customer base, and functionality.
Market Presence and Customer Base
Google Charts dominates with a 67.31% market share in the Charting Tools and Libraries category. This vast customer base highlights its widespread acceptance and usage, particularly for its integration capabilities with other Google services and web applications.
StockCharts, on the other hand, has a much smaller footprint with a 0.56% market share. This reflects its more niche positioning, focusing primarily on investors and traders who require in-depth financial charting.
But being more popular doesn’t mean being better, right? So, let’s compare some functions.
Functional Comparison
Accessibility and integration. Google Charts is highly accessible, being a free service that integrates seamlessly with other Google applications, making it ideal for users who require straightforward, customizable charting solutions without extensive financial analytics.
Financial tools and data. StockCharts excels in providing detailed financial data and advanced charting tools that are essential for in-depth market analysis. It offers real-time data and a variety of chart types, which are crucial for traders and financial analysts.
While Google Charts leads in general market share and versatility, StockCharts provides specialized tools for financial markets analysis, which may be more beneficial for serious traders and investors. This difference in focus and functionality makes each tool suitable for different types of users depending on their specific requirements and geographical location. In general, this is for sure one of the best and most obvious StockCharts alternatives.
4. StockCharts vs Infogram
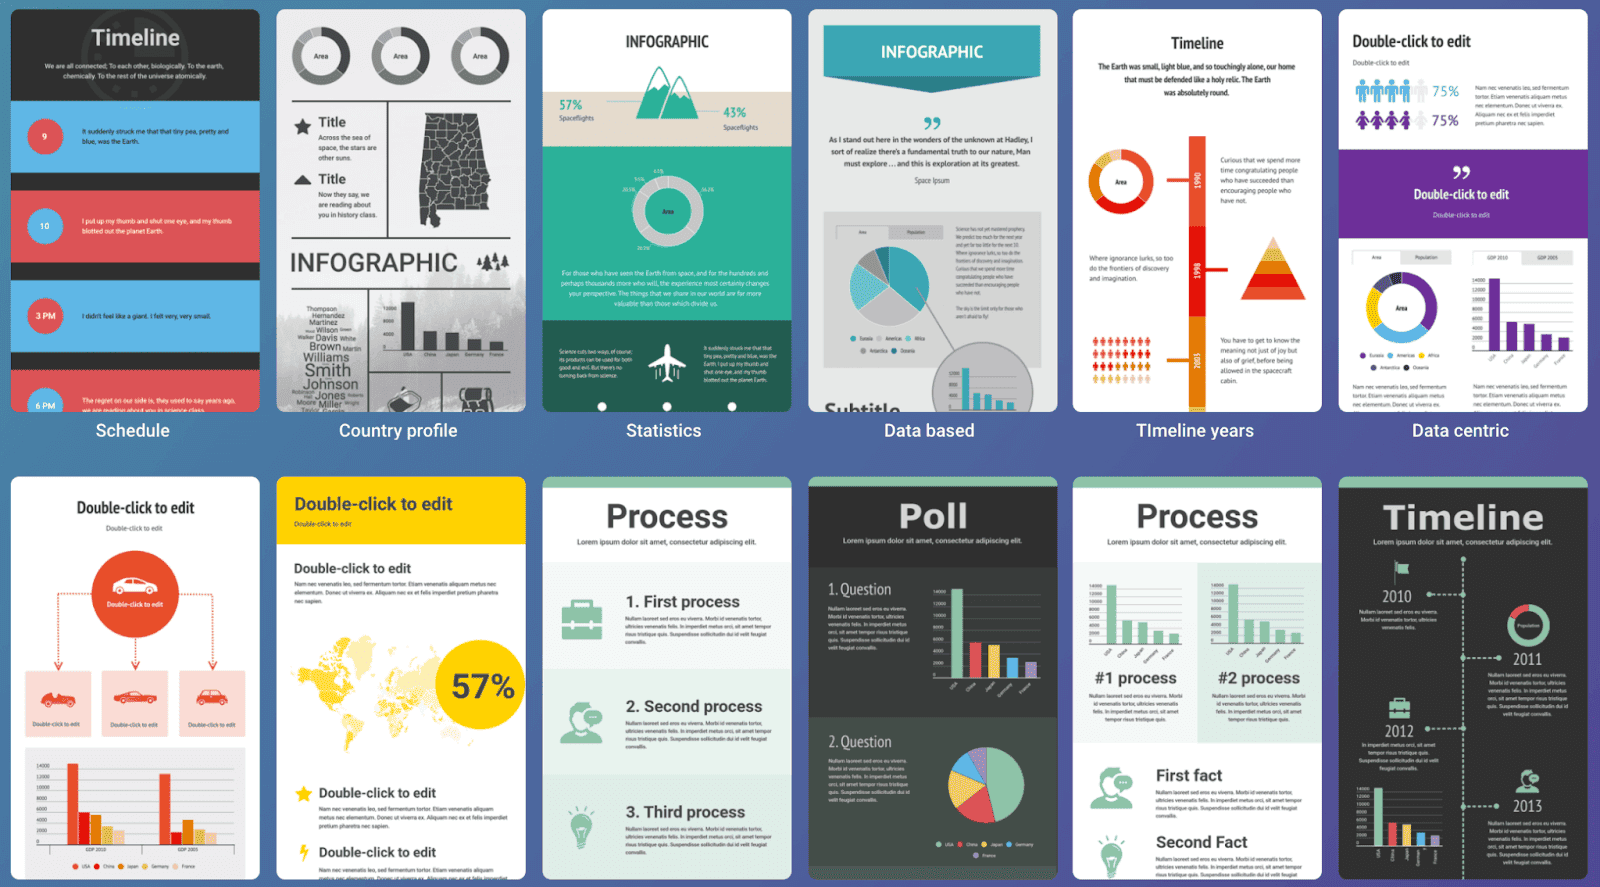
Infogram is a tool primarily designed to create visualizations and infographics that can easily be integrated into reports, presentations, and websites. It supports a variety of charts, maps, and graphics, making it a versatile choice for users looking to present data in visually appealing formats. Infogram has established a strong market presence with a 13.10% share in the Charting Tools and Libraries category.
What are they used for
Infogram, as an indirect StockCharts competitor, excels in creating interactive and static graphics that are suitable for a wide range of applications beyond financial markets, such as marketing, education, and project management. Its ease of use and integration with other platforms make it ideal for users who need to present complex data simply and attractively.
StockCharts is tailored more towards investors and traders who require in-depth analysis and real-time financial data. It offers specialized charting tools, technical indicators, and data analysis features that are essential for making informed investment decisions.
While Infogram provides broad functionality for creating data-driven visual content suitable for various professional and casual applications, StockCharts offers specialized tools for in-depth financial analysis. The choice between these platform.
5. StockCharts vs FusionCharts
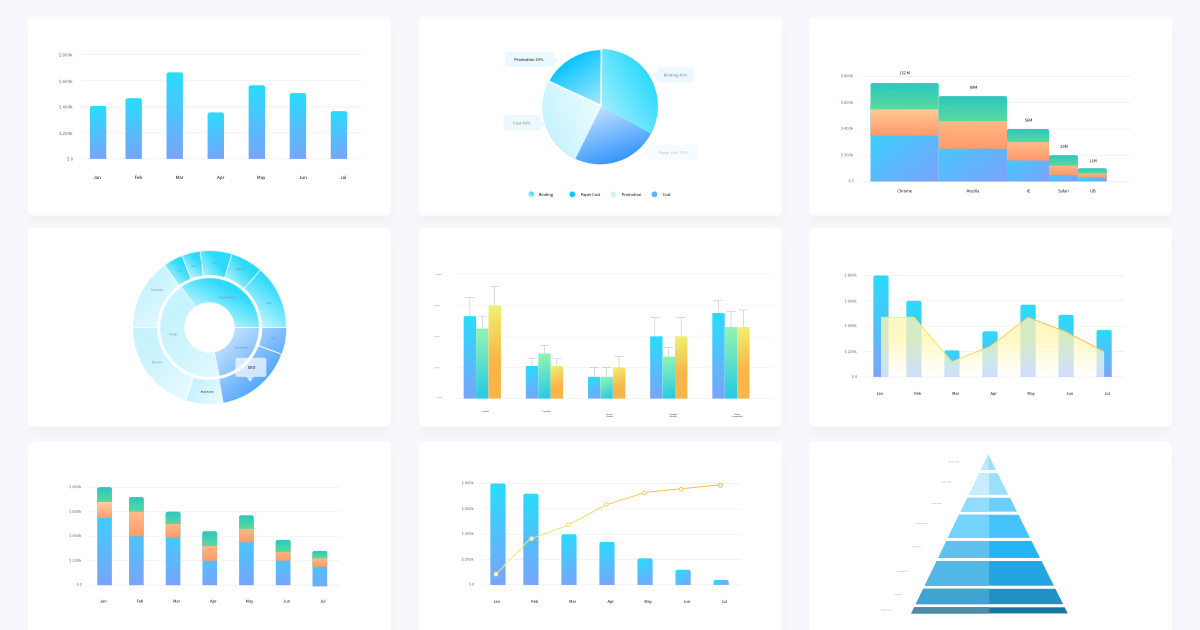
FusionCharts is a charting library used mainly by developers to create detailed charts for websites and apps. It offers a wide variety of chart types and allows for deep customization to fit specific project needs.
Key Differences
Purpose
FusionCharts is designed for developers needing to integrate charts into applications, making it ideal for technical projects and data presentations. StockCharts is tailored for financial market analysis, helping traders make informed decisions.
Customization
StockCharts provides financial charts that are ready to use with less customization, while the StockCharts alternative excels in customizable features, suitable for creating unique chart designs.
User Base
FusionCharts is best for developers and businesses that need embedded charting capabilities. StockCharts is aimed at individual traders and financial analysts.
Other Notable Mentions: Alternatives to StockCharts
In addition to the main StockCharts competitors previously discussed, there are several other charting tools and platforms that offer unique features and capabilities. Here are brief overviews of a few alternatives:
1. AnyChart
Known for its flexibility, AnyChart supports a vast array of chart types and is used across various industries. It’s a good choice for developers looking for a comprehensive charting solution that can handle large data sets. This is a fairly good StockCharts alternative.
2. Vert.x
This tool is a charting library and a tool for building reactive applications on the JVM at the same time. While it includes capabilities for data visualization, its strength lies in building responsive, scalable event-driven applications.
3. Datawrapper
Datawrapper offers simple, straightforward tools for creating charts and maps without the need for programming skills. It’s particularly useful for those who need to publish visual content quickly and easily.
4. FX Replay
Just like Forex Tester Online, FX Replay provides tools for forex traders to backtest trading strategies using historical data. It’s useful for traders who want to validate their forex trading strategies before applying them in live markets.
5. MetaTrader
Widely recognized in the forex trading community, MetaTrader offers advanced charting capabilities, automated trading robots, and tools for technical analysis. It’s particularly suited for those looking for a trading platform.
And more alternatives to StockCharts…
If this is still not enough, you may also try these StockCharts alternatives:
- Forex Tester
- TakeProfit
- StockMarketEye
- Snowball Analytics
- TrendSpider
- YCharts
- MarketSmith
- Chartboard
- Stock Rover
- Profit.com
- Seeking Alpha
- MetaStock
- jForex
- Soft4FX
- Ctrader
Final Thoughts
Each of these alternatives offers unique strengths that can be suitable for different users depending on their specific needs, such as data analysis, publishing, or active trading. We hope you find a tool that you are going to test and implement in you analysis, charting and trading.
- Forex Tester Online (FTO) builds on the established Forex Tester tool, providing advanced backtesting and analytics for Forex traders. FTO suits for traders seeking accessible advanced Forex trading analytics. This is a perfect alternative to StockCharts when it comes to backtesting.
- TradingView is a favorite among more advanced traders due to its comprehensive technical analysis tools, social networking features, and ability to trade directly from charts. It supports a wide range of asset classes including stocks, cryptocurrencies, and Forex.
- Google Charts offers a versatile and free solution for creating customizable and dynamic charts. It is widely used for its integration capabilities with other Google services and web applications, making it suitable for real-time data presentations on accessible platforms. This is the most popular StockChart competitor tool on the market.
- Infogram is another popular tool, especially for those looking to blend charting with infographic capabilities. It provides an easy-to-use interface that is beneficial for presenting data-driven content visually in reports and presentations.
- FusionCharts is well-suited for developers looking to embed charts into applications and websites. It supports extensive customization and has a vast library of chart types which can integrate smoothly with various development frameworks
You can also try other tools that you liked as StockCharts alternatives. Good luck!
 Try Forex Tester Online
 ไทย
ไทย
 Tiếng Việt
 Polski
 Türkçe
 Nederlands
 Română
 한국어
한국어
 Svenska

