English
 Deutsch
 Italiano
 Français
 Português
 ไทย
ไทย
 Tiếng Việt
 Polski
 Türkçe
 Nederlands
 Română
 한국어
한국어
 Svenska
 Español
Experienced traders know something most beginners learn the hard way: price alone is incomplete information. Volume analysis is the discipline of reading what’s behind a move — distinguishing conviction from noise, real breakouts from traps, institutional pressure from random drift.
A candle closing at resistance means very different things depending on whether it printed on 3,000 contracts or 300,000. Volume analysis is how you tell the difference.
By the end of this guide, you’ll have 7 actionable volume trading strategies, each with concrete entry criteria you can immediately start backtesting on historical data.
What Is Volume Analysis in Trading?
Volume analysis is the study of the number of contracts, lots, or shares traded within a given time period to evaluate the strength or weakness behind a price move. The core idea is simple but consequential: volume confirms or refutes price action. It’s the vote count behind the price decision.
| Term | Explanation |
|---|---|
| Volume | Total number of contracts/shares/lots traded in a defined period |
| Tick Volume | Number of price changes (ticks) per bar — used in Forex as a volume proxy |
| Average Volume | Mean volume over a lookback period (typically 20 periods) used as a baseline |
How Volume Differs in Forex, Stocks, and Futures
In stocks, volume is real and centralized. Every share traded on an exchange is counted.
In futures, volume is also real and exchange-reported, with an additional layer of precision: open interest (the number of open contracts) tells you whether new money is entering a trend or old positions are being closed. Expanding open interest in an uptrend confirms new buyers; shrinking open interest suggests the move is running on position-closing, not fresh conviction.
Forex is different. It’s an OTC (over-the-counter) market. There is no centralized exchange here, so true volume data doesn’t exist the way it does in stocks or futures. What Forex platforms display is tick volume: the number of price changes recorded per bar. Research consistently shows tick volume correlates with real volume at roughly 90%+ on liquid pairs like EUR/USD and GBP/USD. It’s a reliable proxy, not a perfect measure. When you read “volume” in the context of Forex trading volume analysis, you’re reading tick volume — and for the strategies below, that’s sufficient.
For futures traders, FTO supports futures backtesting, giving access to real volume and open interest data where available — a meaningful edge over tick-proxy analysis alone.
2. Why Volume Analysis Matters for Technical Analysis
Three foundational principles underpin most of the trading volume analysis:
- Rising price + rising volume = strong, believable trend
- Rising price + falling volume = weak trend, potential reversal ahead
- High volume at key levels = confirmed support or resistance
When price moves on high volume, more participants agreed on that price. When price drifts higher on thinning volume, the buyers are running out of reinforcements.
| Scenario | Volume Condition | Signal Interpretation |
|---|---|---|
| Price breaks resistance | Volume ≥ 1.5× average | High-probability breakout |
| Price breaks resistance | Volume below average | Likely false breakout, caution |
| Price in uptrend | Volume increasing on impulse legs | Trend is healthy, continuation likely |
| Price in uptrend | Volume shrinking on impulse legs | Trend weakening, watch for reversal |
| Price at support/resistance | Heavy volume rejection | Level confirmed, trade the bounce |
Reading Volume Bars on a Chart
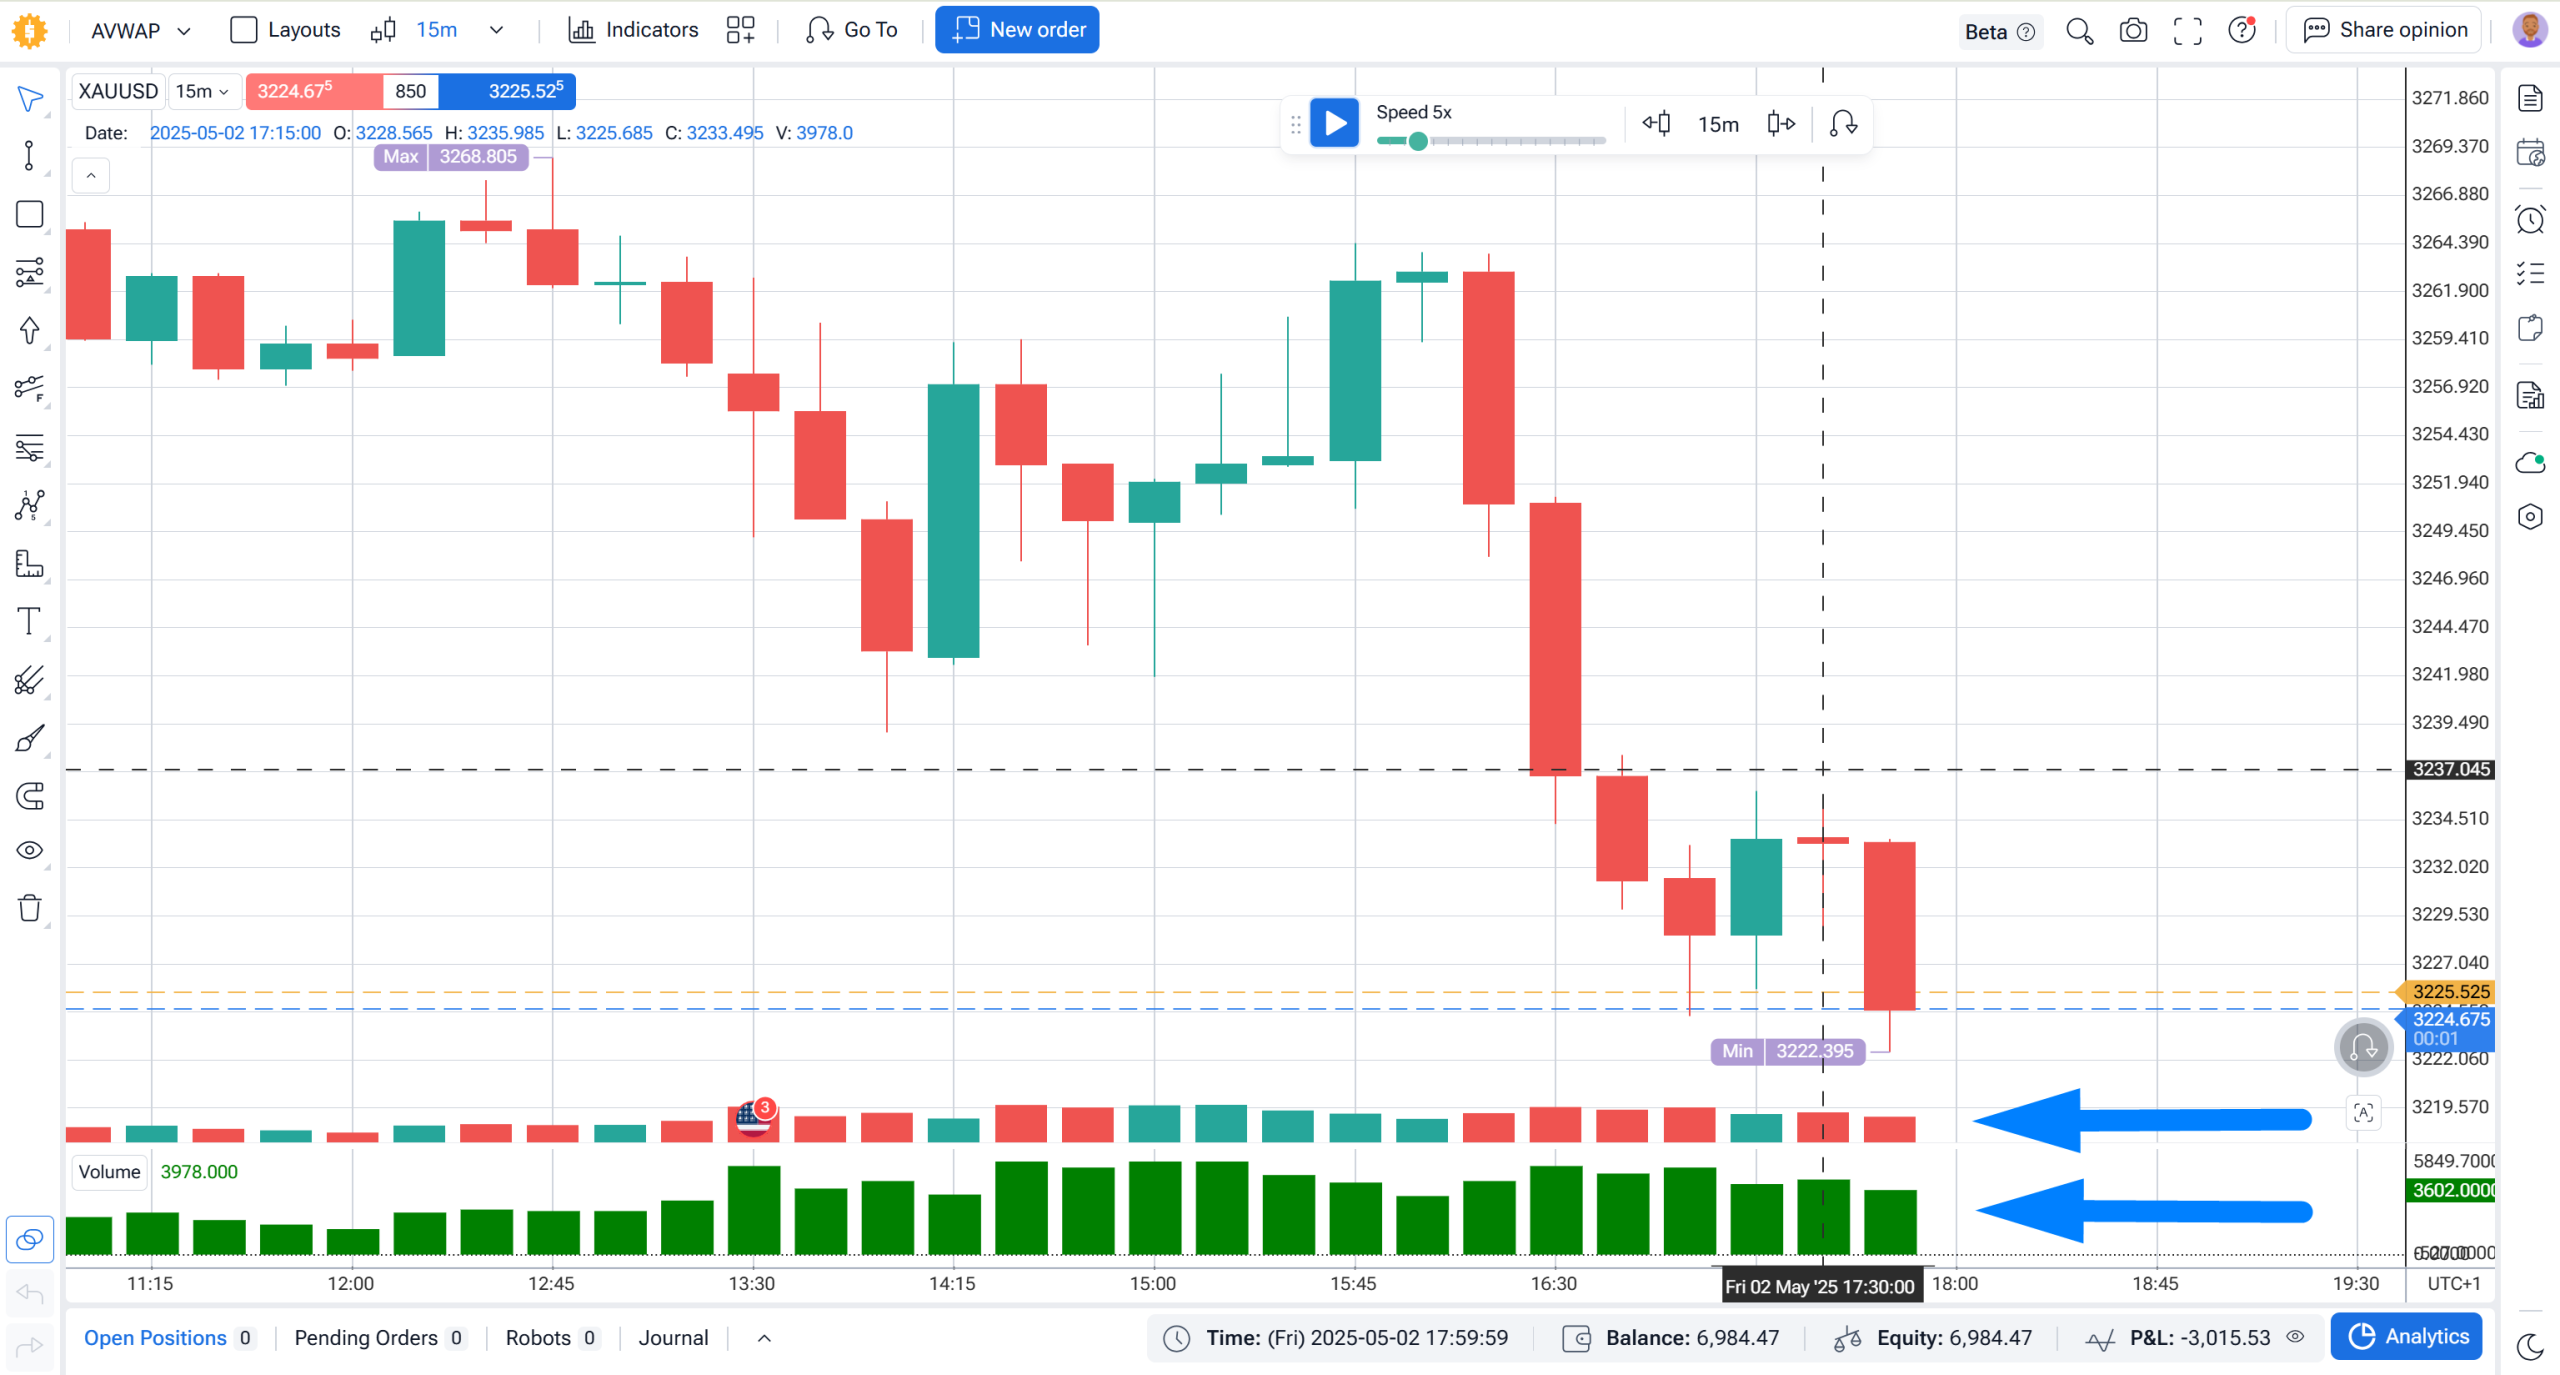
Volume appears as a histogram beneath the price chart. Green bars typically correspond to up-candles, red bars to down-candles. “Above-average volume” is commonly defined as 1.5× the 20-period average — though some traders use 2× for higher-conviction signals.
In Forex Tester Online, the volume histogram is displayed natively on any chart layout, making it straightforward to visually compare current volume to historical averages during backtesting sessions. You can also enable the volume indicator for additional context.
3. The 7 Volume Trading Strategies
Each strategy below includes a specific entry signal, confirmation criteria, and a backtesting note. Volume strategies are inherently context-dependent — how they perform varies by market, timeframe, and instrument. That’s precisely why backtesting each one on your specific setup is non-negotiable before committing real capital.
Strategy 1: Volume Breakout Confirmation
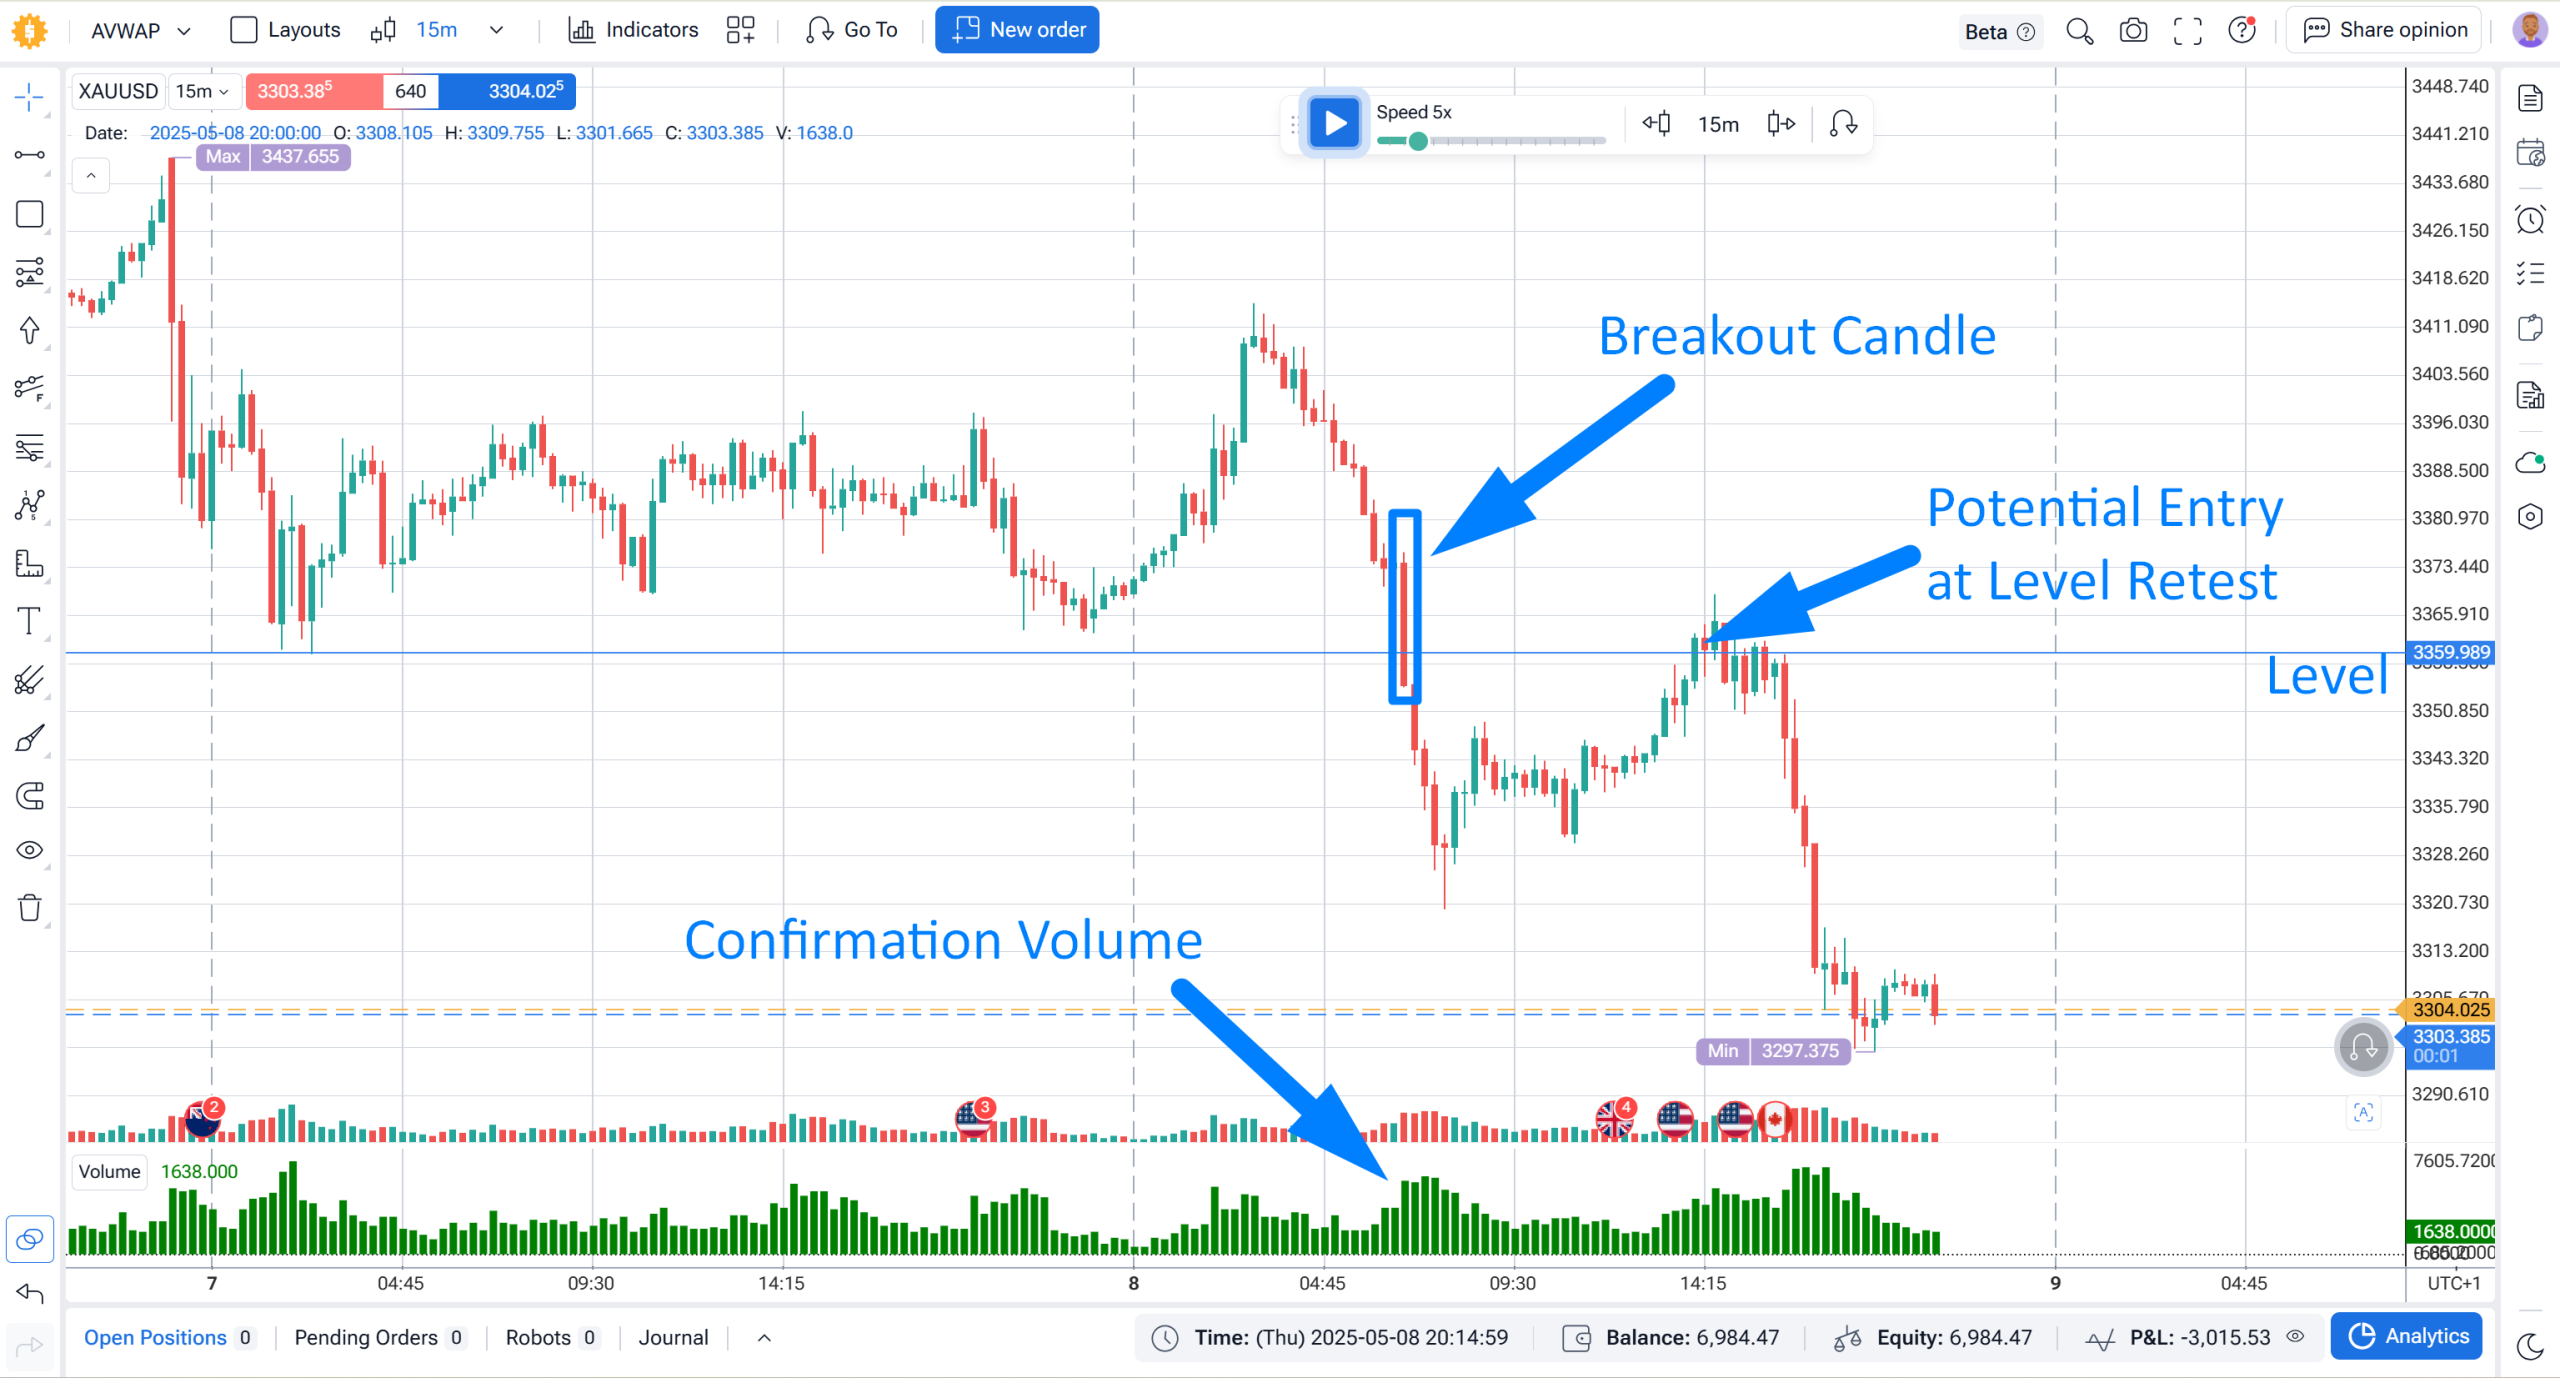
The idea: A price breakout is only as valid as the volume behind it. High volume at a breakout signals genuine market participation; low volume signals a lack of conviction — and a higher probability of a fake-out.
Entry conditions:
| Entry Conditions | Exit / Stop Rules |
|---|---|
| Price closes above resistance | Stop below the breakout candle's low |
| Volume ≥ 1.5× 20-period average | Target: next significant resistance |
| Confirmation candle closes strong (no large upper wick) | Consider trailing stop if volume continues strong |
A special case worth knowing: a volume spike of 500%+ above the recent average at a resistance zone isn’t necessarily bullish — it can signal a reversal. This is climactic volume, the kind that shows up at market tops and bottoms when the last wave of buyers or sellers exhausts itself.
Backtest approach: When replaying sessions in Forex Tester Online, take every breakout setup — don’t pre-filter by eye. Instead, tag each trade at entry using FTO’s trade journal tags: “vol-low”, “vol-avg”, or “vol-high” based on where volume sits relative to the 20-period average. After 50–100 trades, filter your results by tag and compare win rates and R-multiples across the three groups. This gives you actual data on whether volume threshold matters for your specific instrument — rather than assuming it does.
Strategy 2: On-Balance Volume (OBV) Divergence
The idea: OBV is a cumulative indicator — it adds volume on up-days and subtracts on down-days, creating a running total that reflects whether volume is flowing into or out of a market.
Strategy: Bearish divergence — price makes a new high, but OBV fails to confirm (lower high on OBV). This means fewer participants are supporting the new price level. Bullish divergence works in reverse: price makes a new low, OBV holds higher.
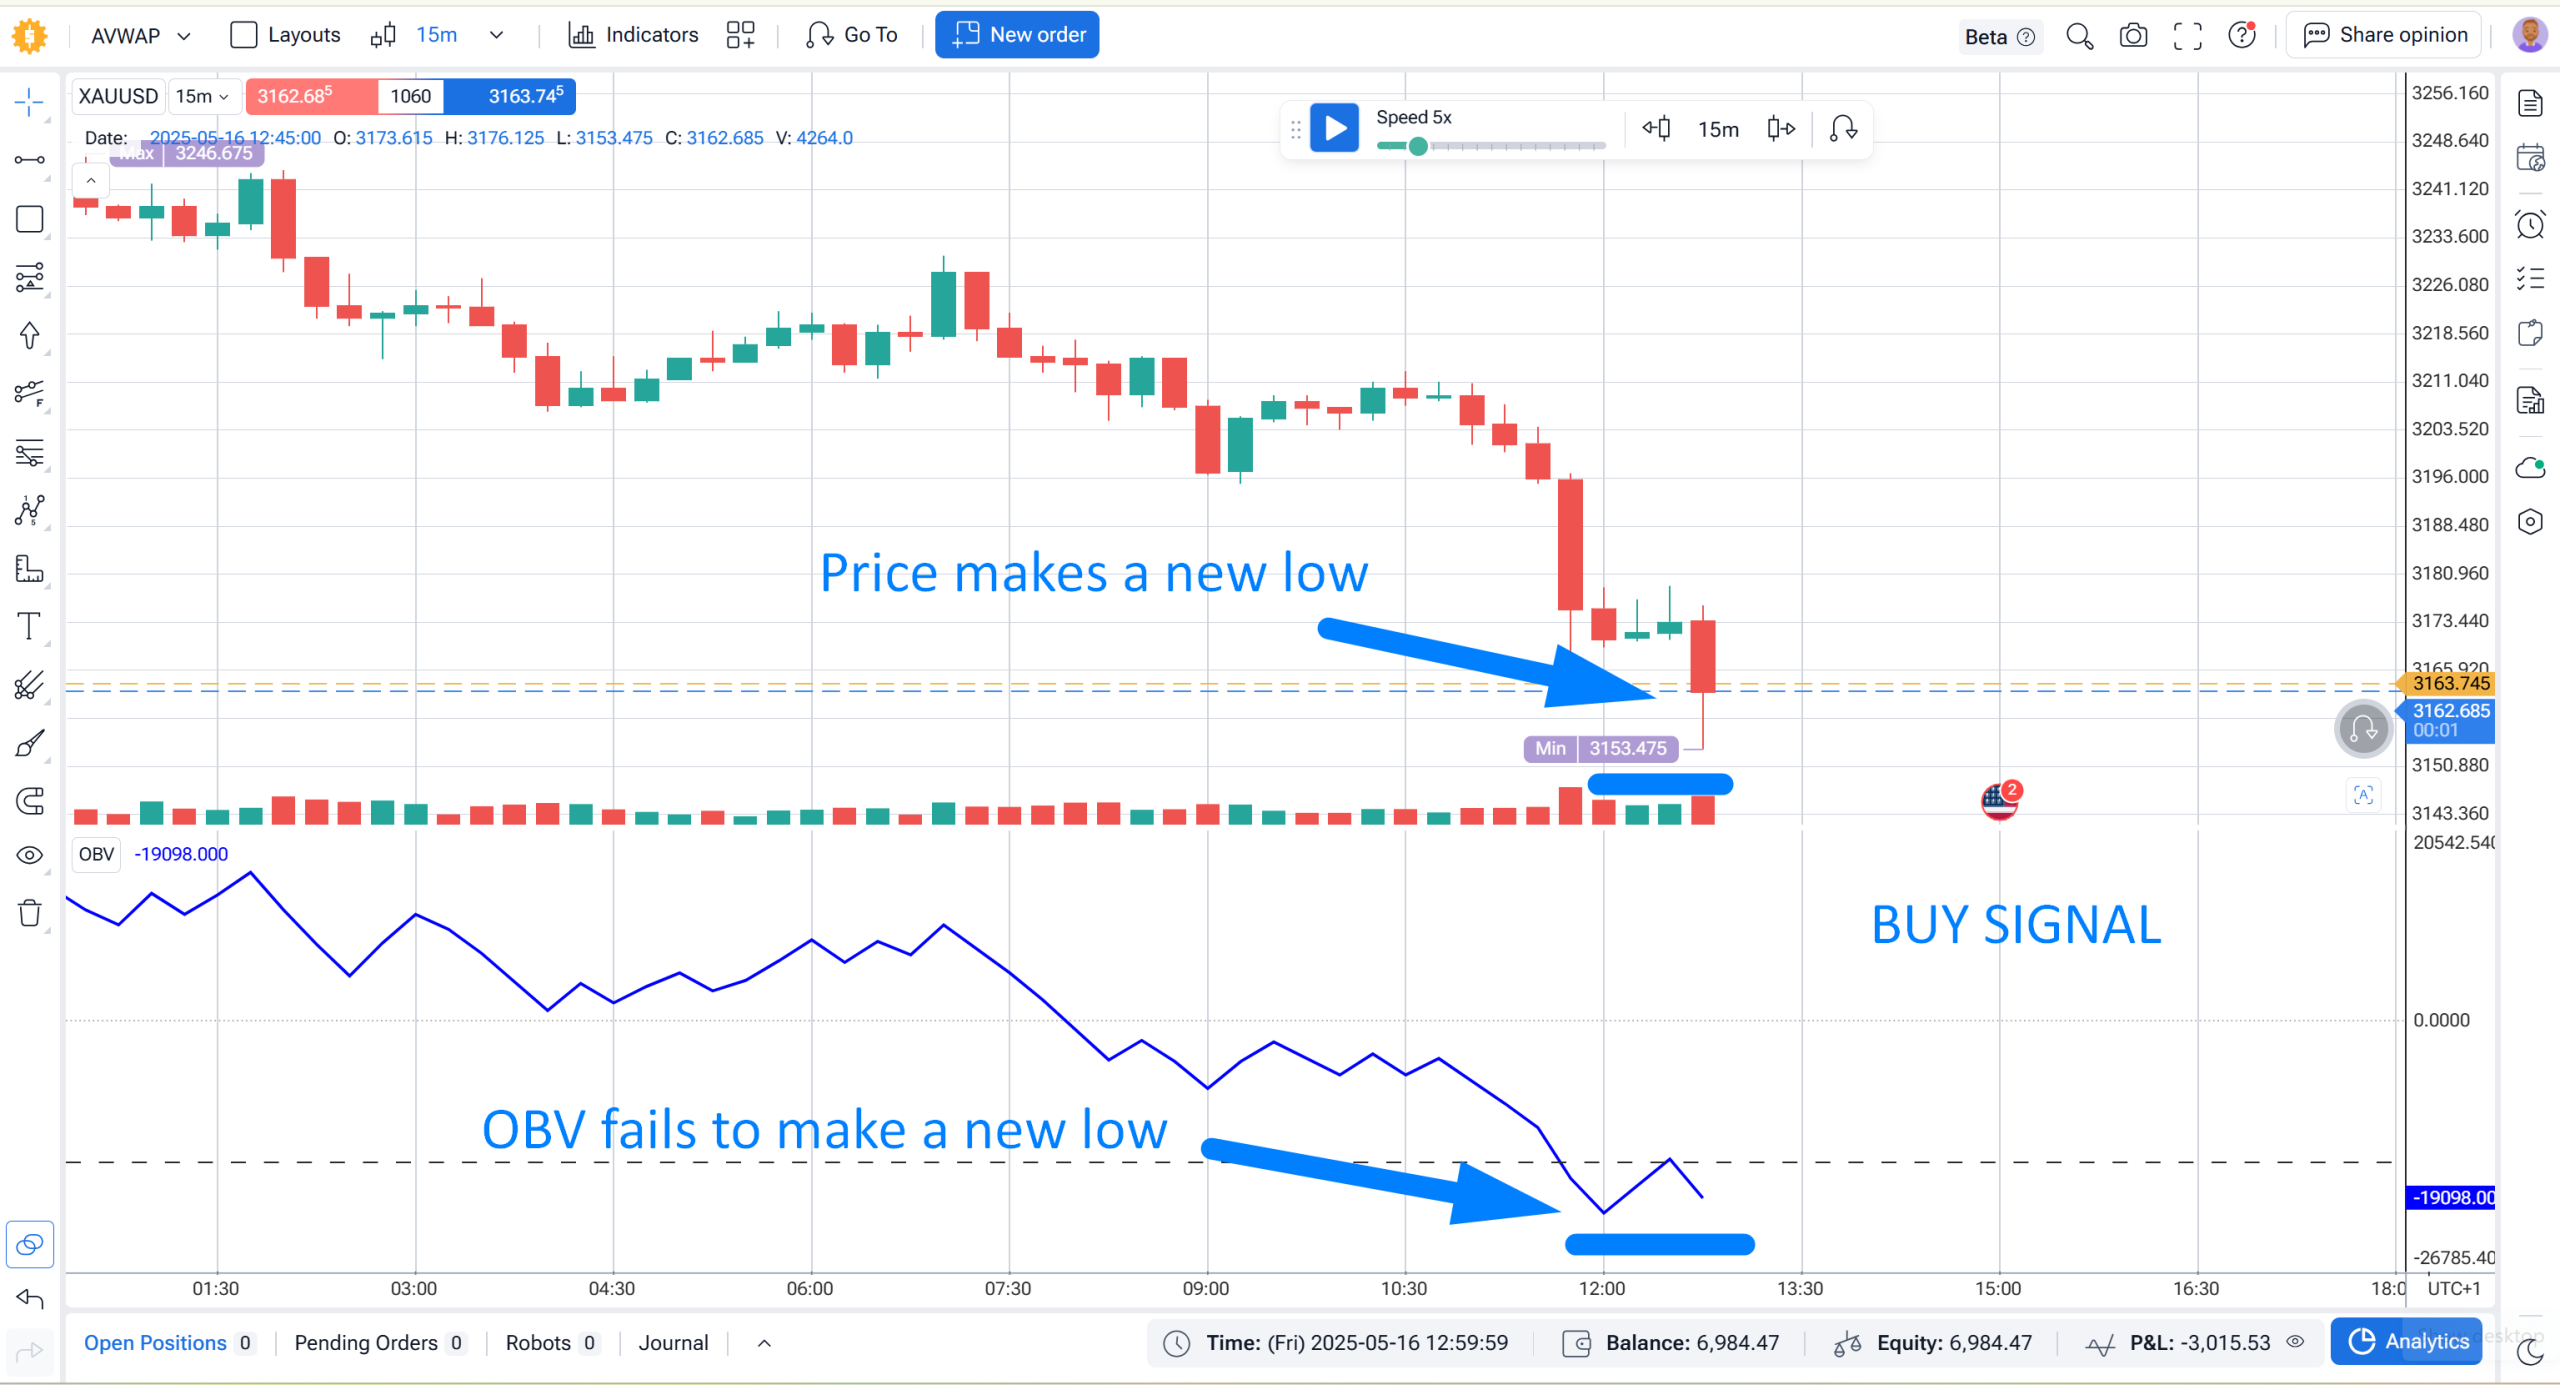
OBV divergence is not an instant entry signal. It flags a weakening trend. Combined with a price pattern — double top, failed breakout, rejection candle at resistance — it creates a higher-conviction reversal setup worth running on the backtesting replay.
For detailed OBV mechanics and usage, see the FTO blog on the OBV indicator and OBV strategy guide.
Strategy 3: MFI Divergence
The idea: The Money Flow Index (MFI) is a volume-weighted RSI — it measures buying and selling pressure by factoring in both price direction and volume. Unlike OBV, which is cumulative and directional, MFI oscillates between 0 and 100, making divergences easy to spot visually.
The signal: When price makes a new high but MFI forms a lower high, fewer participants are backing the move with real volume — bearish divergence. When price makes a new low but MFI holds higher, selling pressure is drying up — bullish divergence.
The difference between MFI and OBV divergence (Strategy 2): OBV tracks cumulative flow direction; MFI weights each bar by both price range and volume, making it more sensitive to sudden shifts in buying/selling pressure. Using both together strengthens the signal — when OBV and MFI show divergence simultaneously, the case for a reversal is considerably more robust.
Backtesting note: Tag divergence trades by how many bars the divergence spans — short divergences (3–5 bars) vs. extended ones (10+ bars). Filter results by tag to find which divergence length has better predictive value on your instrument. As with OBV, combine with a price confirmation trigger (rejection candle, failed breakout) before entering.
Strategy 4: VWAP, Anchored VWAP & Rolling VWAP as Volume-Weighted Support/Resistance
The idea: VWAP (Volume-Weighted Average Price) is the average price paid per unit, weighted by volume, across the trading session. Institutional traders use it as a benchmark — which gives it genuine significance as a dynamic intraday support/resistance level.
Price above VWAP signals a bullish institutional bias for the session; below signals bearish.
| Setup | Long Entry | Short Entry |
|---|---|---|
| Intraday pullback to VWAP | Price pulls back to VWAP on declining volume, then shows rejection (long wick, engulfing) | — |
| Intraday rally to VWAP (in downtrend) | — | Price rallies to VWAP on declining volume, then shows rejection |
| VWAP break and retest | Enter long on confirmed retest from above | Enter short on confirmed retest from below |
The declining volume on the approach is key: it indicates the counter-trend move is losing momentum before reaching VWAP. When volume picks up on the rejection, that’s confirmation.
Anchored VWAP extends the concept beyond a single session. Instead of resetting at midnight or market open, you anchor it to a significant price event — a major swing high or low, a gap, an earnings release, a key news candle. The resulting VWAP line shows the average entry price of all participants who traded since that event, making it a meaningful level for tracking institutional positioning over days or weeks. If price is above the VWAP anchored to a major low, the average buyer from that point is in profit — a structural tailwind. See the FTO Anchored VWAP guide for setup details.
Rolling VWAP takes a different approach: instead of anchoring to a fixed event or resetting daily, it calculates VWAP over a rolling window (e.g., 20 sessions). The result behaves like a volume-weighted moving average — smoother than a simple MA, more responsive to price levels where actual trading activity concentrated. Swing traders use it as a dynamic support/resistance reference that accounts for where the market actually traded, not just where it passed through.
FTO includes session VWAP, Anchored VWAP, and Rolling VWAP natively — covering intraday, event-based, and swing-timeframe volume-weighted analysis in a single platform. For a full breakdown of session VWAP mechanics, see the FTO VWAP guide.
Strategy 5: Volume Profile — Point of Control & Value Area
The idea: Volume Profile distributes volume across price levels (not time), revealing where the most and least trading activity occurred. It answers a question that standard volume bars can’t: at what price level did all that volume transact?
Key concepts:
| Term | Definition | Tradeable Implication |
|---|---|---|
| POC (Point of Control) | Price level with the highest traded volume | Strong magnet — price tends to revisit it |
| VAH (Value Area High) | Upper boundary of the top 70% of volume | Resistance from above, target from below |
| VAL (Value Area Low) | Lower boundary of the top 70% of volume | Support from above, target from below |
| HVN (High Volume Node) | Price level with above-average volume | Acts like support/resistance |
| LVN (Low Volume Node) | Price level with below-average volume | Price moves quickly through these zones |
Two core trades: Buy bounces from HVN support (high volume = conviction at that level); fade breakdowns into LVN zones where price historically moves fast because there’s little opposing volume to absorb the move.
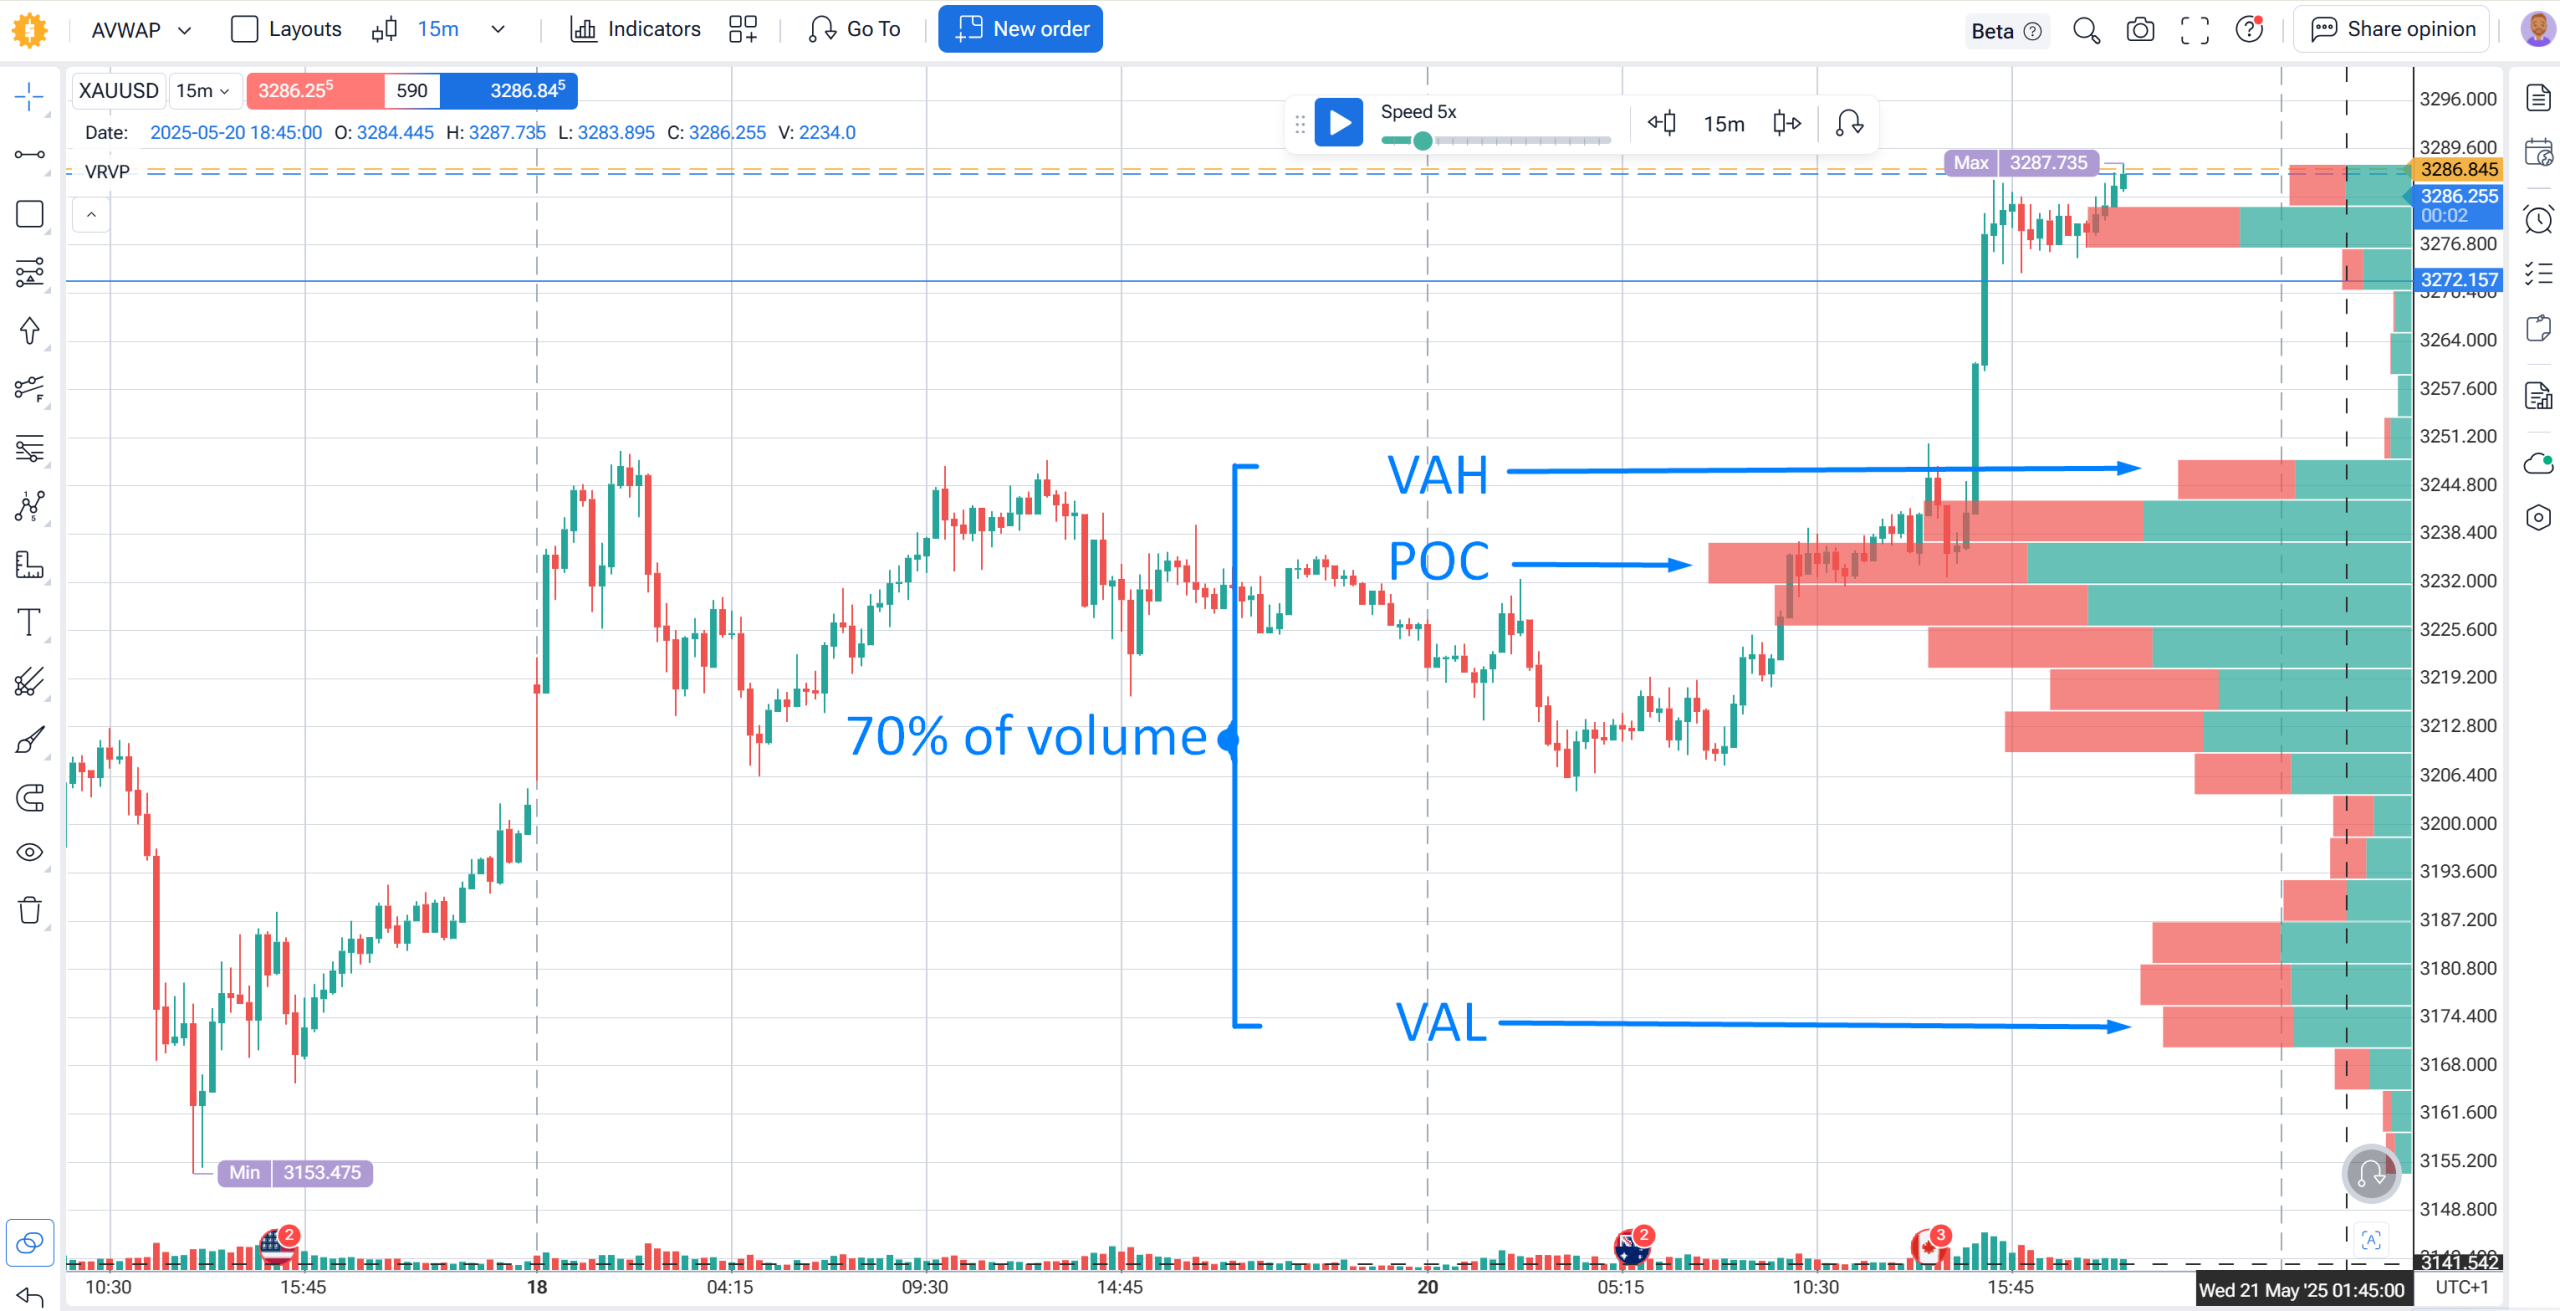
FTO offers two Volume Profile tools: Fixed Range Volume Profile (applied to a user-defined historical range) and Visible Range Volume Profile (automatically calculated for the visible chart area, updating as you scroll). Both are available for backtesting. The visible range version is particularly useful during replay sessions — it recalculates in real-time as the chart advances, giving you a current-conditions volume map rather than a static historical snapshot.
See: FTO Fixed Range Volume Profile and Visible Range Volume Profile.

STOP GUESSING WHICH BREAKOUTS ARE REAL. Test your volume strategies on 23+ years of tick data — try Forex Tester Online free
Strategy 6: Relative Volume — Reading the Market’s Enthusiasm Level
The idea: Absolute volume tells you how much traded. Relative volume tells you how much traded compared to what’s normal — and that context is what makes volume readings actionable.
A volume bar twice the average is meaningful. Whether it’s bullish or bearish depends on price. Whether it’s actually unusual depends on the baseline — which varies by session, instrument, and time of day.
How to apply this without a dedicated RVOL indicator:
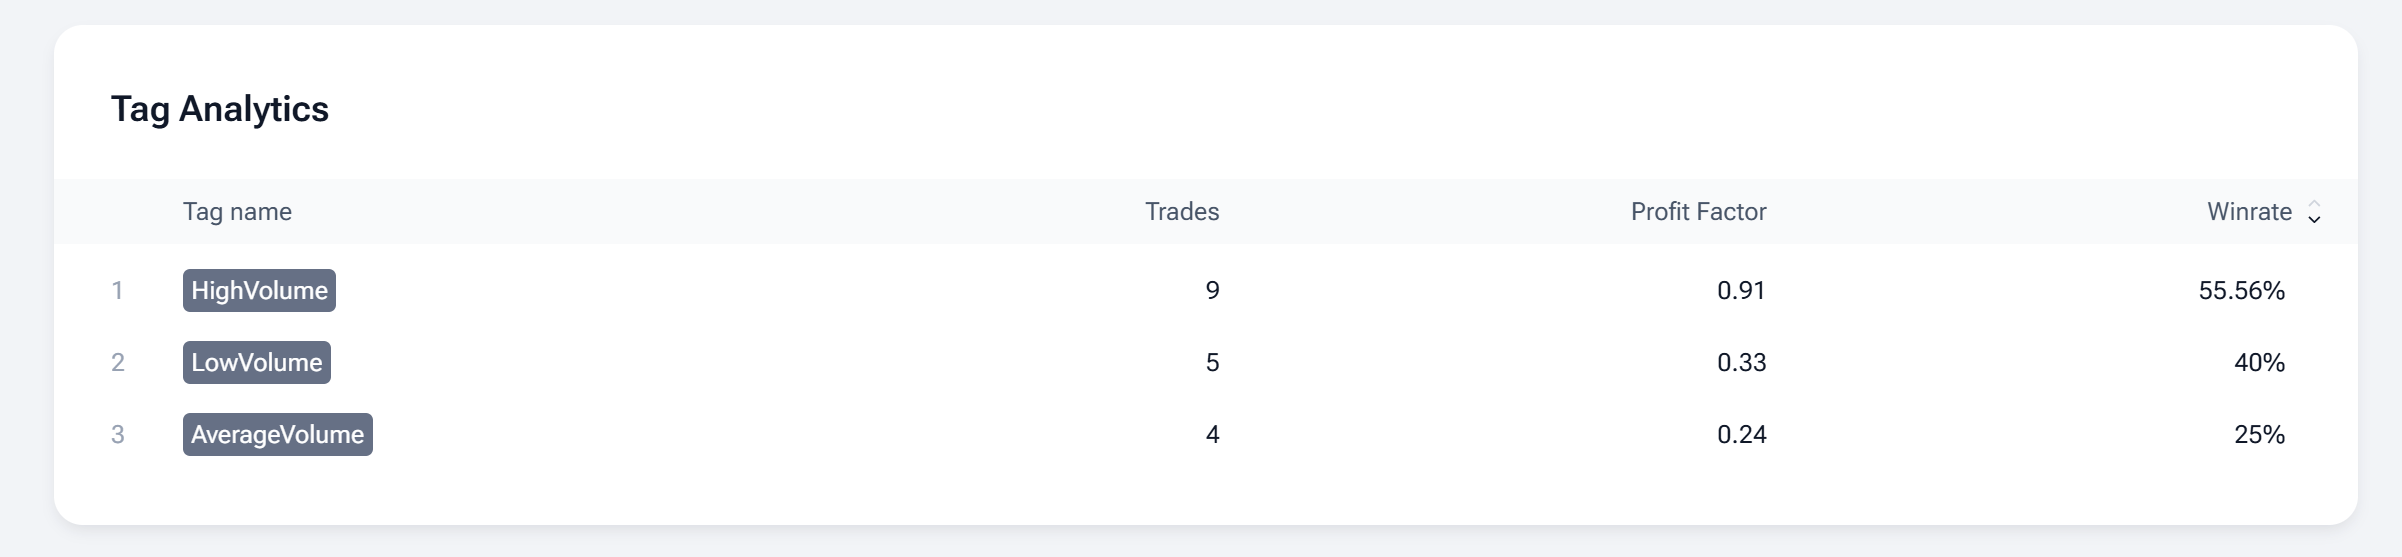
The most practical method is to build this tracking directly into your trade journal via tags. When entering any trade, assign a volume tag:
- vol-low — current bar volume clearly below the 20-period average (visually obvious on the histogram)
- vol-avg — current bar volume within normal range
- vol-high — current bar volume clearly above the 20-period average (1.5×+ or higher)
After accumulating 50–100 tagged trades, filter by tag in FTO’s analytics. The data will tell you, for your specific strategy and instrument, whether vol-high entries outperform vol-low entries, by how much, and in what conditions. That’s more useful than any rule of thumb — including this one.
What to expect: High relative volume environments tend to produce cleaner follow-through on breakouts and trend trades. Low volume sessions produce more false signals, erratic fills, and stop-hunt behavior. Many experienced traders become very selective — or step back entirely — when volume is persistently below baseline.
Strategy 7: Volume Divergence & Wyckoff Volume Spread Analysis
The idea: Volume divergence means price continues in a direction but volume is shrinking — the trend is moving on fumes. At the other extreme is climactic volume: a massive spike at a trend extreme signals exhaustion. The last wave of participants has entered, and there’s no one left to push price further.
| Trend Direction | Volume Expanding | Volume Contracting |
|---|---|---|
| Uptrend | Strong continuation likely | Trend weakening, potential reversal |
| Downtrend | Strong continuation likely | Trend weakening, potential reversal |
Ease of movement is a related concept: when a trend accelerates on low volume, it can indicate institutional accumulation or distribution happening with little opposing pressure. The move continues precisely because there’s no fight.
Wyckoff Volume Spread Analysis (VSA) formalizes these observations into a structured framework. VSA examines three elements simultaneously on every bar:
- Bar spread (range from high to low)
- Close position within the bar (upper, middle, lower)
- Volume (relative to recent average)
Specific combinations signal accumulation, distribution, markup, or markdown phases. For example: wide spread up-bar, close near the high, above-average volume = genuine buying strength. Narrow spread up-bar, close in the middle, above-average volume = potential distribution (supply absorbing demand).
FTO doesn’t include a dedicated VSA indicator, but the methodology only requires what’s already on screen: price bars and volume histogram. Read them together, bar by bar. The reading improves significantly with practice on replay — because you see conditions develop in real time, not with hindsight.
4. Key Volume Indicators to Use
| Indicator | What It Measures | Best Used For | Available in FTO? |
|---|---|---|---|
| OBV (On-Balance Volume) | Cumulative volume flow direction | Trend confirmation, divergence signals | Yes |
| VWAP / Anchored VWAP / Rolling VWAP | Volume-weighted average price (session, event-anchored, or rolling) | Intraday and swing support/resistance, institutional bias | Yes |
| Volume Profile (Fixed + Visible Range) | Volume distribution across price levels | Key price zones, POC, Value Area | Yes |
| MFI (Money Flow Index) | Buying vs. selling pressure combining price and volume | Overbought/oversold with volume confirmation | Yes |
MFI (Money Flow Index) is a volume-weighted RSI — it measures whether money is flowing into or out of an instrument by factoring in both price direction and volume. Unlike OBV, which is purely cumulative, MFI oscillates between 0 and 100, making it easier to read overbought (above 80) and oversold (below 20) conditions with volume context. It pairs well with OBV: when both show divergence against price, the signal carries more weight.
On futures data, volume analysis gains an additional dimension: cluster analysis and large-trade detection. These tools — showing exactly where big orders printed at specific price levels within a bar — are part of footprint charting, standard in professional futures trading environments. FTO’s futures data support includes volume-based analytics to leverage this level of granularity for futures instruments.
YOUR VOLUME STRATEGY NEEDS DATA. Replay 23 years of tick history with live volume histograms — start free on Forex Tester Online
5. How to Backtest Volume Trading Strategies
Volume strategies require backtesting. A setup that looks compelling on paper may perform very differently across different sessions, instruments, and market regimes. The only honest way to know is to run it through historical data.
Step 1: Choose one strategy and define explicit, measurable rules. Don’t start with “buy on high volume at support.” Start with: “Buy when price closes above the 20-period high, volume is visually ≥1.5× the recent average, and the close is in the upper 25% of the candle’s range.” Vague rules produce uninterpretable results.
Step 2: Open FTO and configure your chart with the right indicators. Select your instrument and timeframe. Then add your volume tools — for most strategies, start with the volume histogram (built-in) and OBV. For VWAP strategies, add the VWAP indicator from the indicator panel. For Volume Profile work, add Fixed Range or Visible Range Volume Profile. Take a screenshot of your configured setup so you’re consistent across sessions.
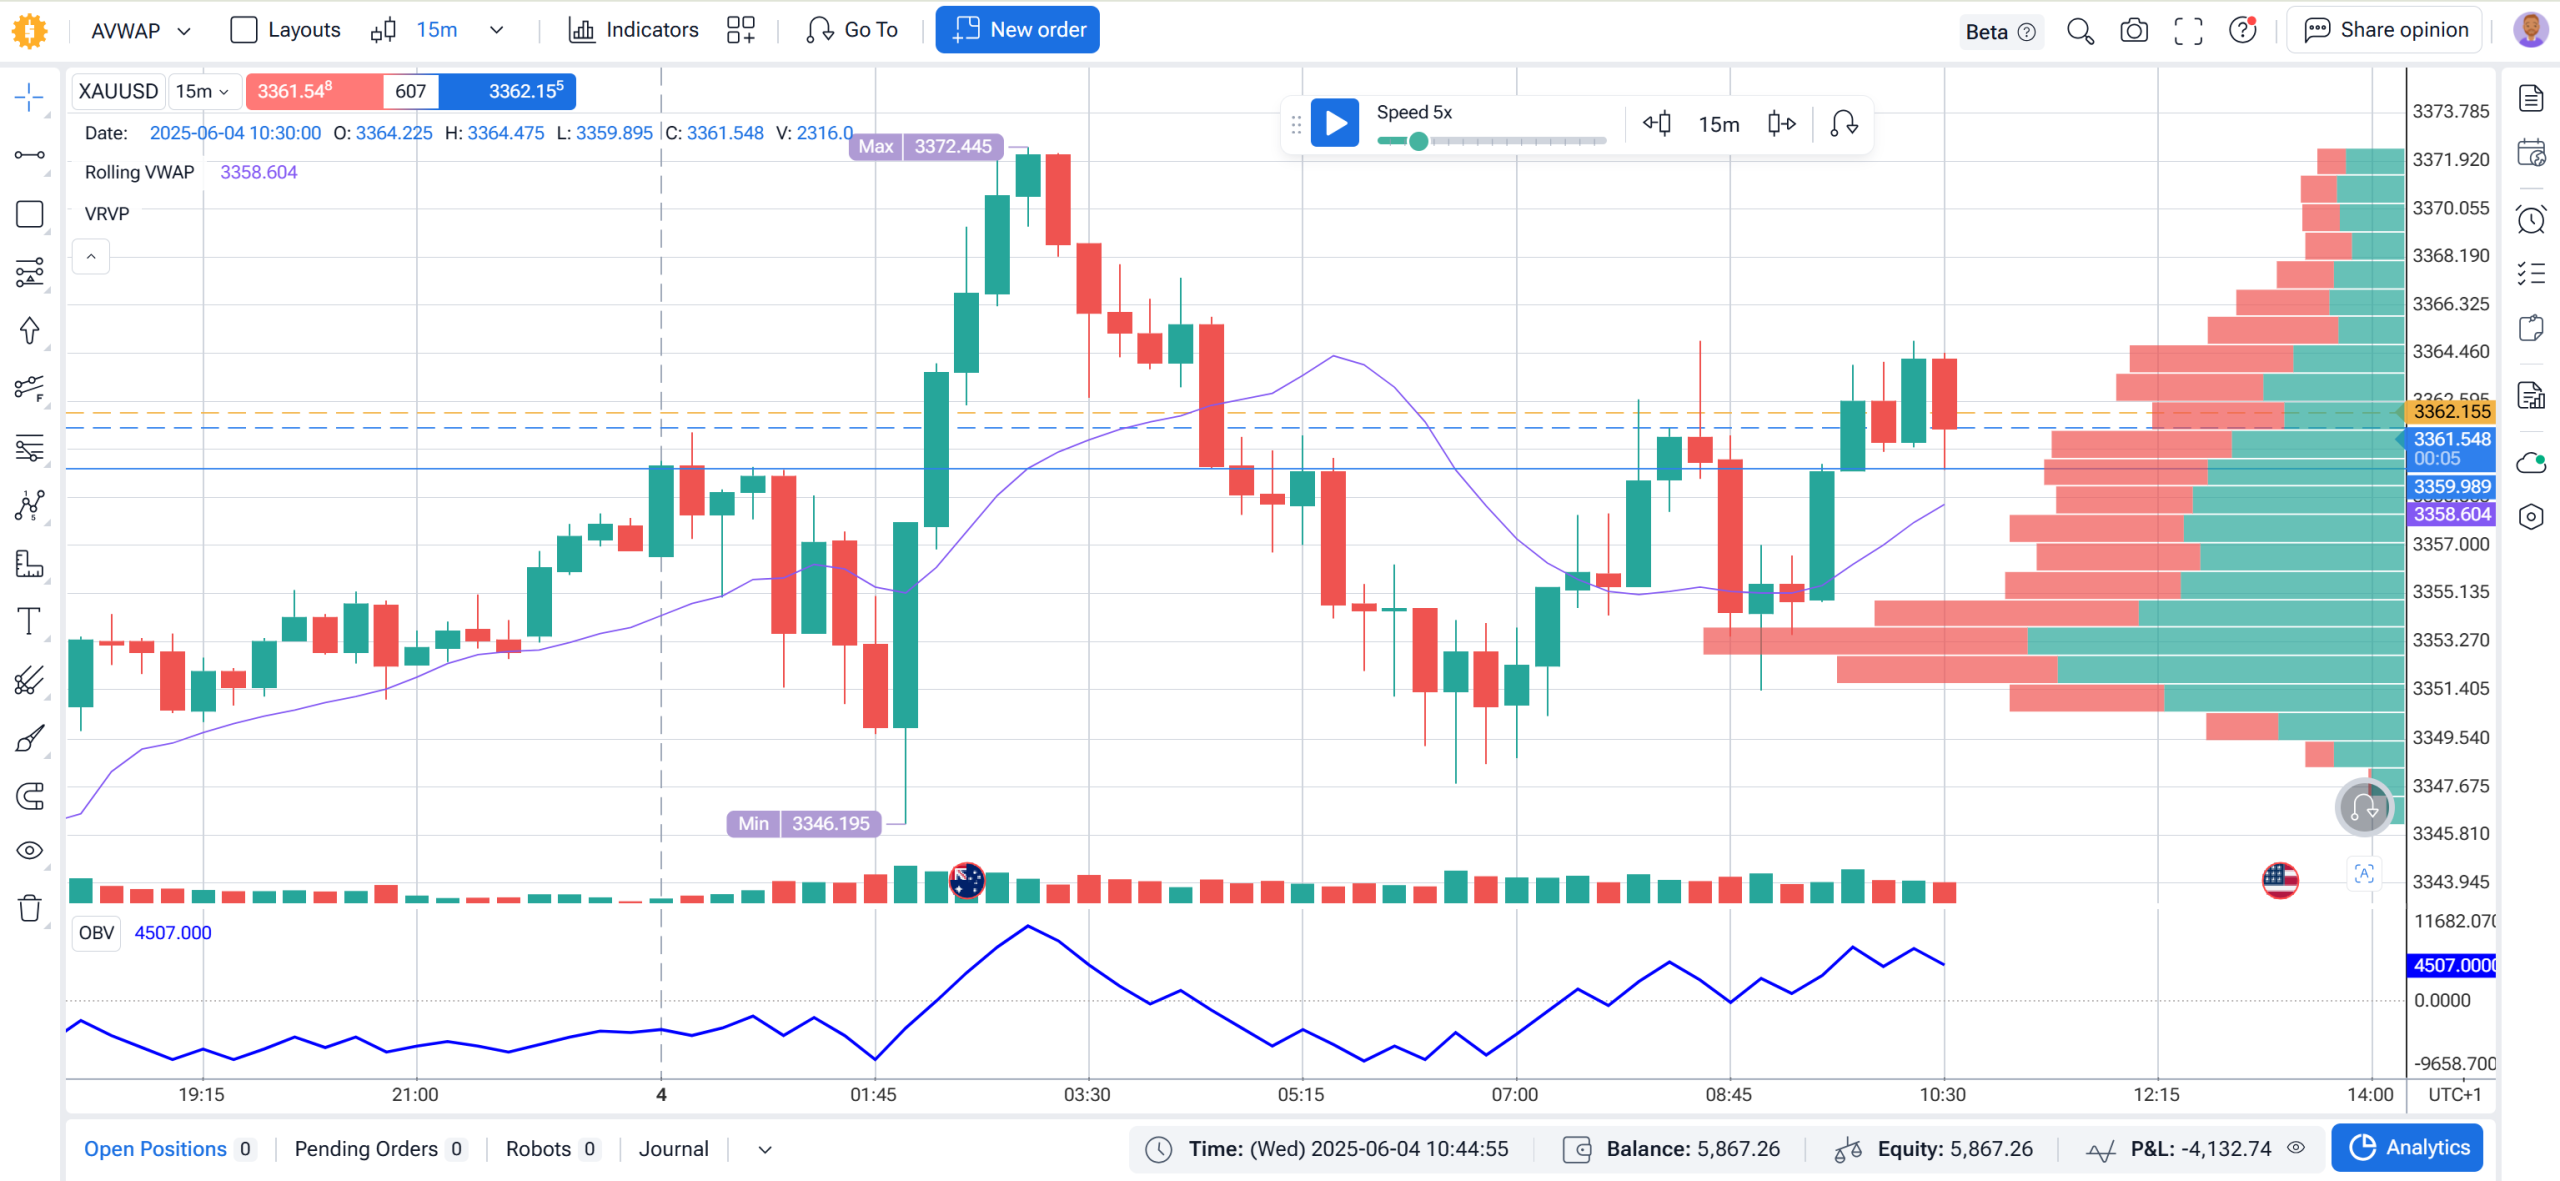
Step 3: Replay historical sessions forward-only. FTO’s tick-by-tick replay simulates how the market actually developed — you can’t see what’s coming next. This is critical for volume strategies specifically: it’s easy to rationalize a volume bar as “above average” with hindsight. Forward-only mode removes that bias.
Step 4: Tag every trade at entry using FTO’s journal tagging system. Beyond the basic entry/exit log, assign volume condition tags (vol-low / vol-avg / vol-high) and optionally session tags (london-open / ny-open / asian). This turns your trade log into a filterable dataset.
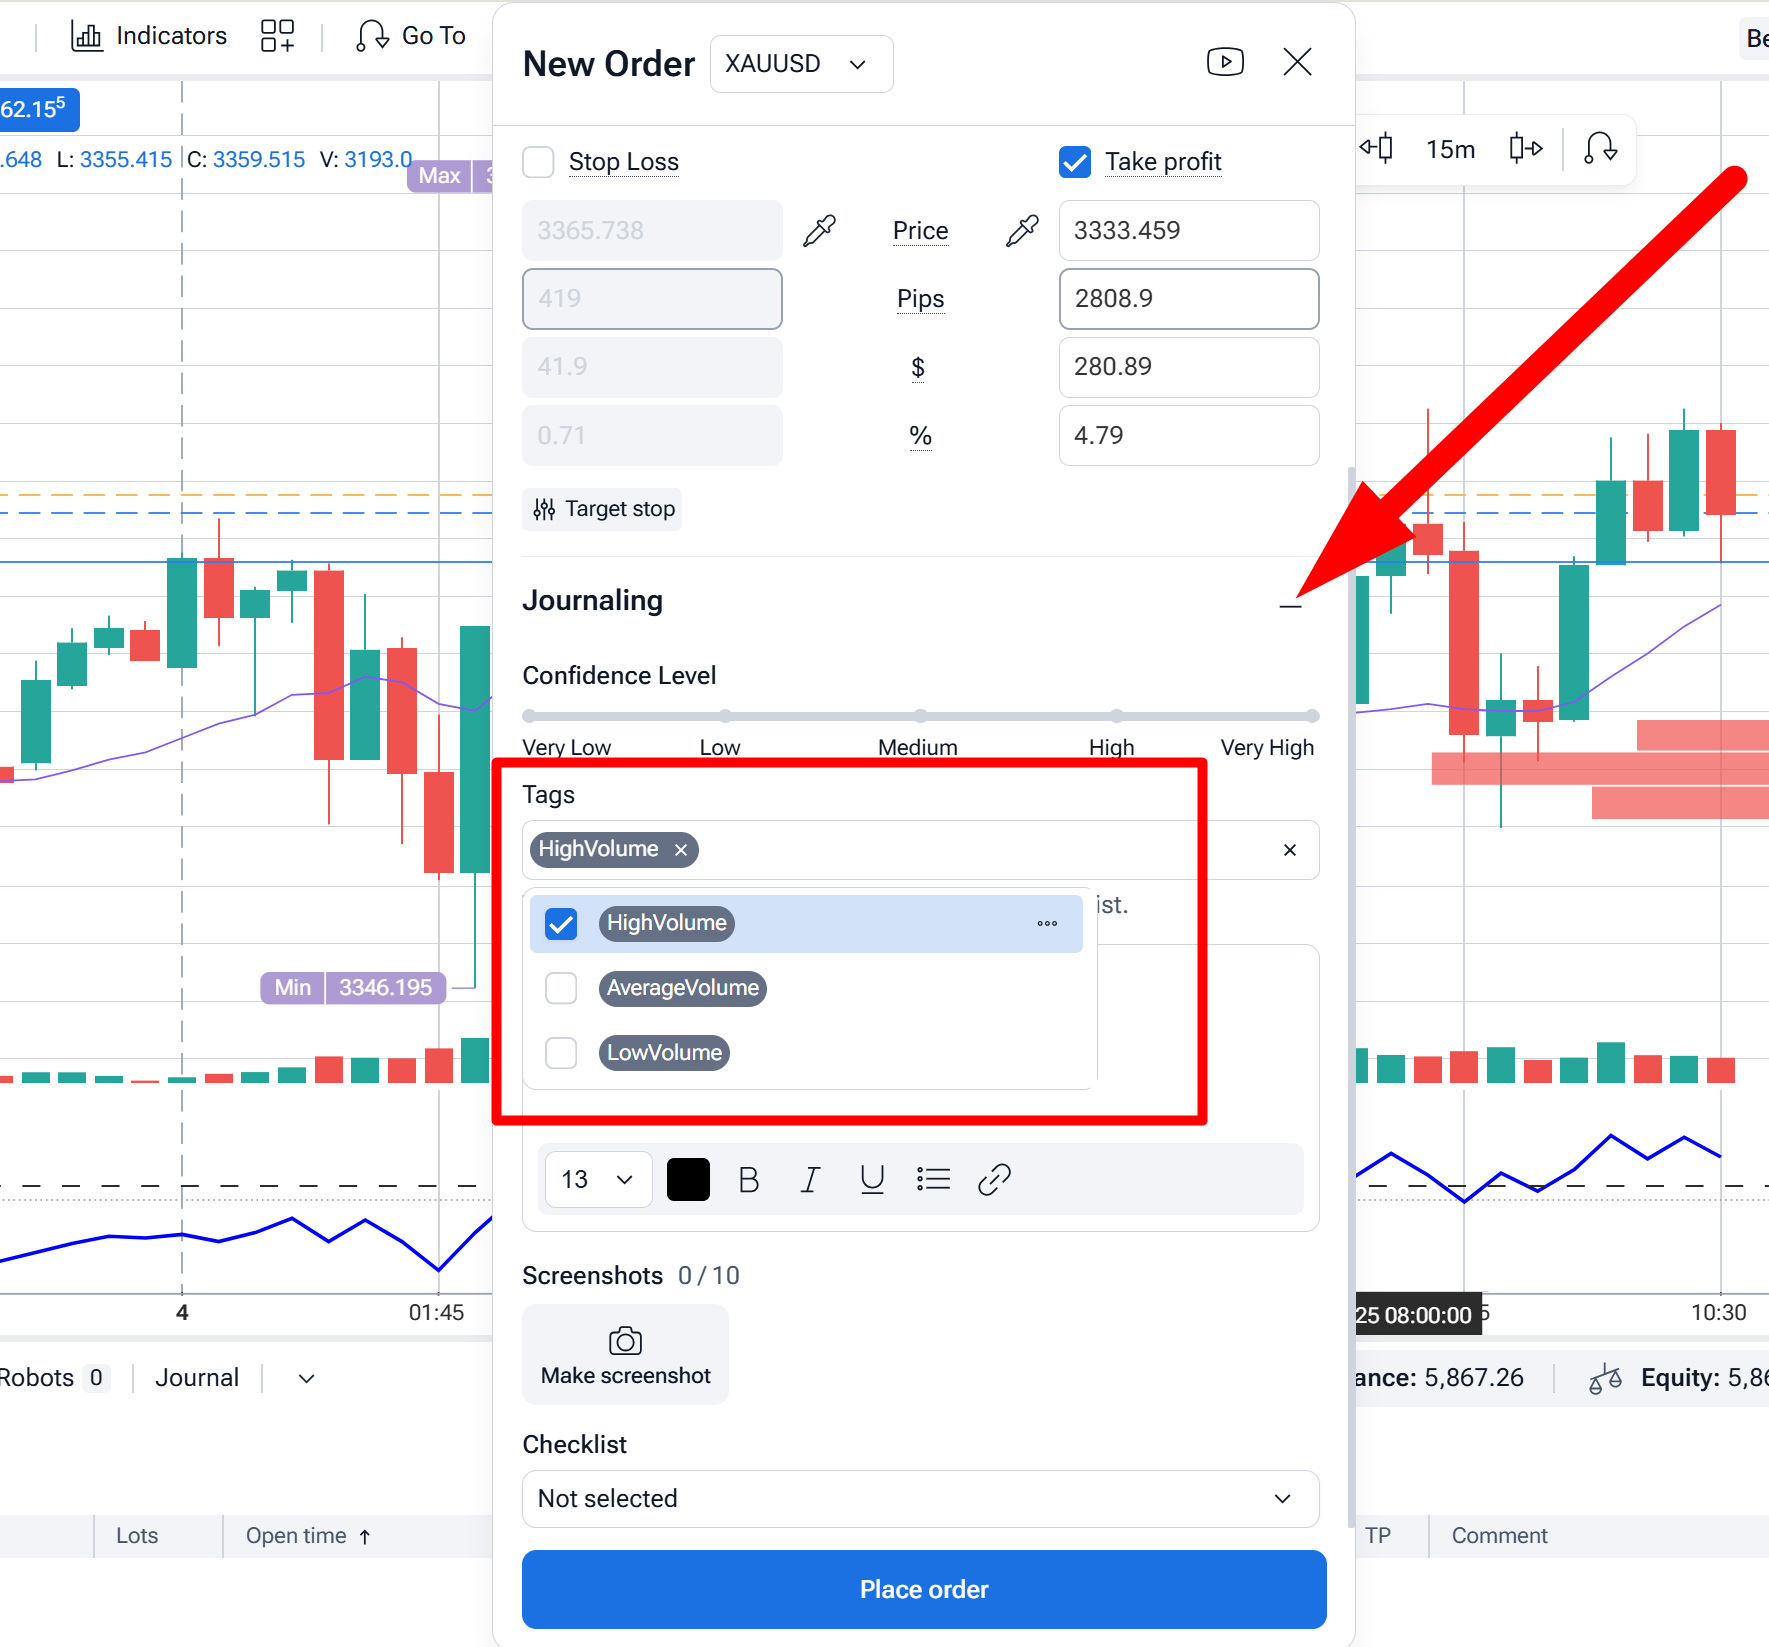
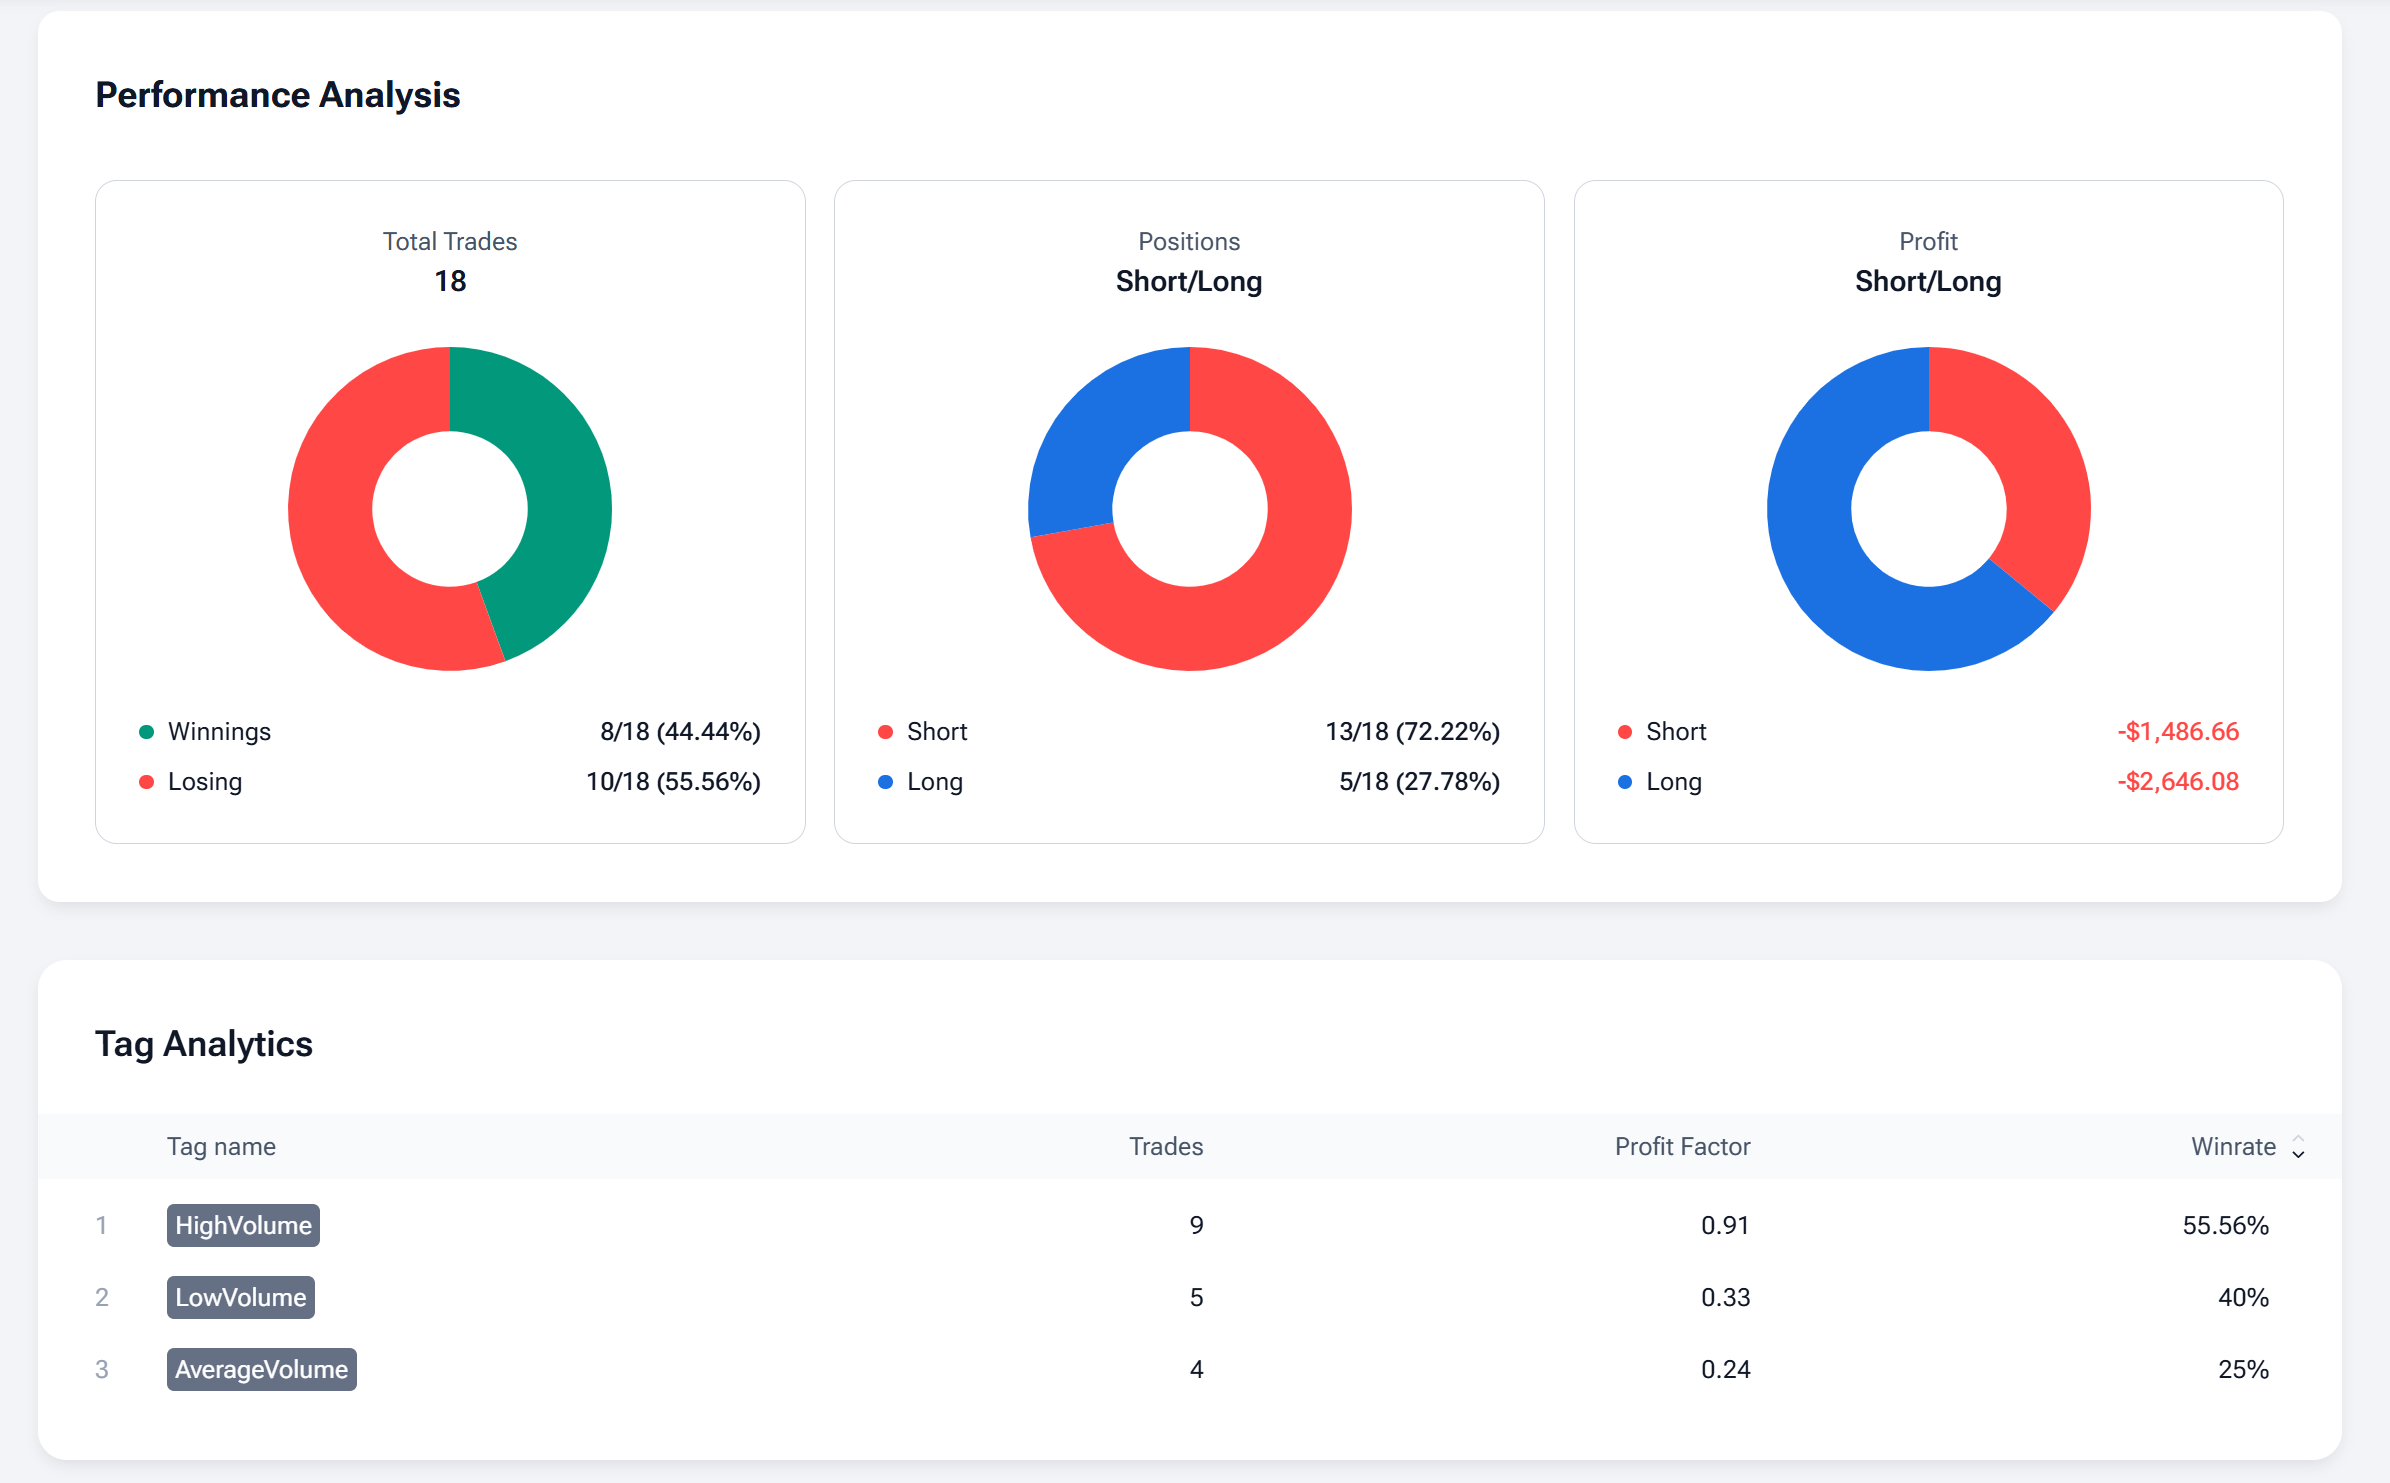
Step 5: After 50+ trades, filter by tag and analyze. Open FTO’s analytics and filter results by your volume tags. Compare win rate, average R, and profit factor across vol-low vs. vol-high groups. This is where the strategy either proves itself or doesn’t. The Exit Optimizer in the Analytics section is also useful here — run it on your sample to find statistically optimal stop and target parameters for the volume conditions where your strategy performs best.
6. Common Mistakes in Volume Analysis
- Trading breakouts on low volume. A breakout without volume confirmation has a meaningfully higher failure rate. If volume isn’t showing up, the move lacks conviction.
- Applying stock or futures volume logic to Forex. In stocks and futures, volume is real and exchange-reported. In Forex, tick volume is a proxy. It’s highly correlated on liquid pairs, but less reliable on exotic or illiquid pairs — especially during low-liquidity sessions.
- Ignoring market context. Volume means very different things in a trend versus a range. A large volume bar at support in a range is potentially significant. The same bar in the middle of a trending move is often just normal activity.
- Relying on a single volume indicator. OBV divergence is more meaningful when confirmed by a VWAP rejection. Volume Profile levels carry more weight when volume is above average at the test. Use indicators in combination, not isolation.
- Confusing absolute volume with relative volume. High absolute volume means nothing without knowing the baseline. What looks like a volume spike at 3 AM may be normal for the European open. Always compare volume to the same time-of-day average for readings that actually mean something.
Disclaimer
Trading involves risk. The indicators in this article are for educational purposes only and are not financial advice. Past performance does not guarantee future results. Always test strategies before using real money.
Conclusion
Volume analysis is a filter, not a crystal ball. It doesn’t tell you where price will go — it tells you whether to believe the move that’s already happening. Combine it with price action, use it to confirm or dismiss signals from other tools, and you’ll make meaningfully fewer bad trades.
The 7 strategies above each have edge in the right conditions. The key phrase is “right conditions.” Without backtesting, you’re assuming conditions that may not apply to your instrument, session, or strategy. Volume analysis without systematic testing is still just intuition with extra steps.
Forex Tester Online gives you 23+ years of historical tick data, a native volume histogram, Volume Profile (Fixed + Visible Range), VWAP, Anchored VWAP, Rolling VWAP, OBV, MFI, and a full analytics suite — including tag filtering and Exit Optimizer — to verify which of these volume trading strategies actually performs for your specific setup. Start with one strategy, define explicit rules, and run at least 50 trades before drawing conclusions.
VOLUME STRATEGY WITHOUT DATA IS JUST A THEORY. Put yours to the test — try Forex Tester Online free
FAQ: Volume Analysis in Trading
What does trading volume tell you?
Volume reveals the conviction behind a price move. High volume at a breakout suggests genuine supply and demand; low volume signals weak participation and a higher probability of failure. In Forex, tick volume — the number of price changes per bar — acts as a reliable proxy, showing roughly 90%+ correlation with real volume on major pairs. Volume doesn’t predict price; it grades it.
What is a good volume level for a trade?
A commonly used threshold is 1.5× the 20-period average at the moment of entry. Some traders require 2× for higher-conviction signals. Rather than applying a single rule, the more useful approach is to tag your trades by volume condition during backtesting and let the data tell you what threshold actually matters for your specific setup and instrument.
Does volume analysis work in Forex?
Yes, with the important caveat that true volume doesn’t exist in OTC Forex. Tick volume, which measures the frequency of price changes per bar, serves as the proxy — and studies show it correlates with real volume at 90%+ on liquid pairs like EUR/USD and GBP/USD. On exotic or illiquid pairs, the correlation is weaker. The volume trading strategies in this guide work with tick volume; interpret readings with that context in mind.
What is the Volume Profile 80% rule?
The 80% rule comes from Market Profile methodology: if price enters the Value Area and holds for two consecutive 30-minute bars, there is approximately an 80% probability that price will traverse the entire Value Area. This makes the VAL-to-VAH range (or vice versa) a common volume profile trading strategy target when the condition triggers.
How do I backtest a volume trading strategy?
Define explicit, measurable entry rules first. Then use a backtesting simulator with historical volume data to replay sessions forward-only — without seeing future price. Tag each trade by volume condition (low/avg/high), log at least 50 trades, then filter by tag in your analytics. Forex Tester Online supports this full workflow natively: tick data going back 23 years, built-in volume indicators, trade journal with tag filtering, and Trade Analyzer to evaluate results by condition.
Forex Tester Online
Master volume analysis trading: 7 proven strategies using OBV, VWAP, Volume Profile & more. Confirm breakouts, spot reversals, backtest rules.