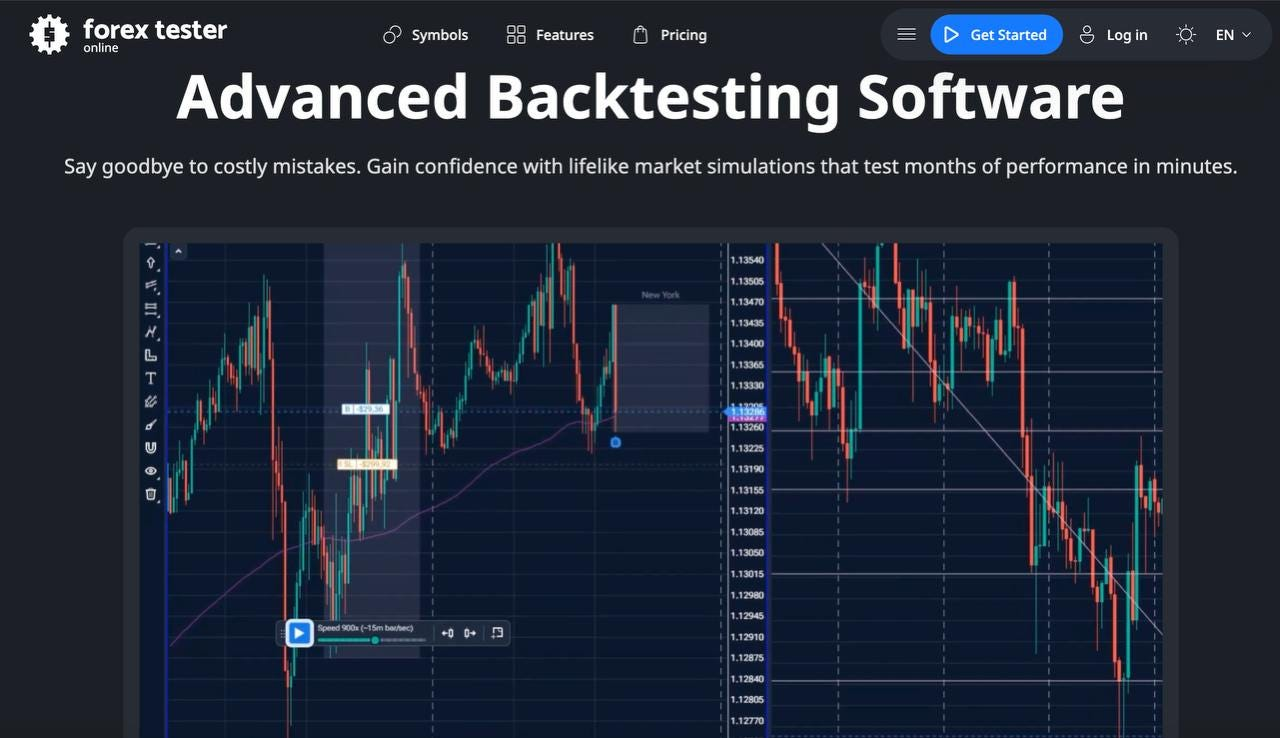
VWAP (Volume Weighted Average Price) is the average price of a session, weighted by volume. It resets every intraday open. This is not the most popular indicator, but still very important for some strategies. We mostly use this indicator as a live benchmark and a dynamic support/resistance line. Funds track it to judge execution quality; retail traders read it for trend and mean reversion. In this guide we cover the calculation, why volume weighting matters, stops and targets, pros and cons, and how to test VWAP “in the field”.
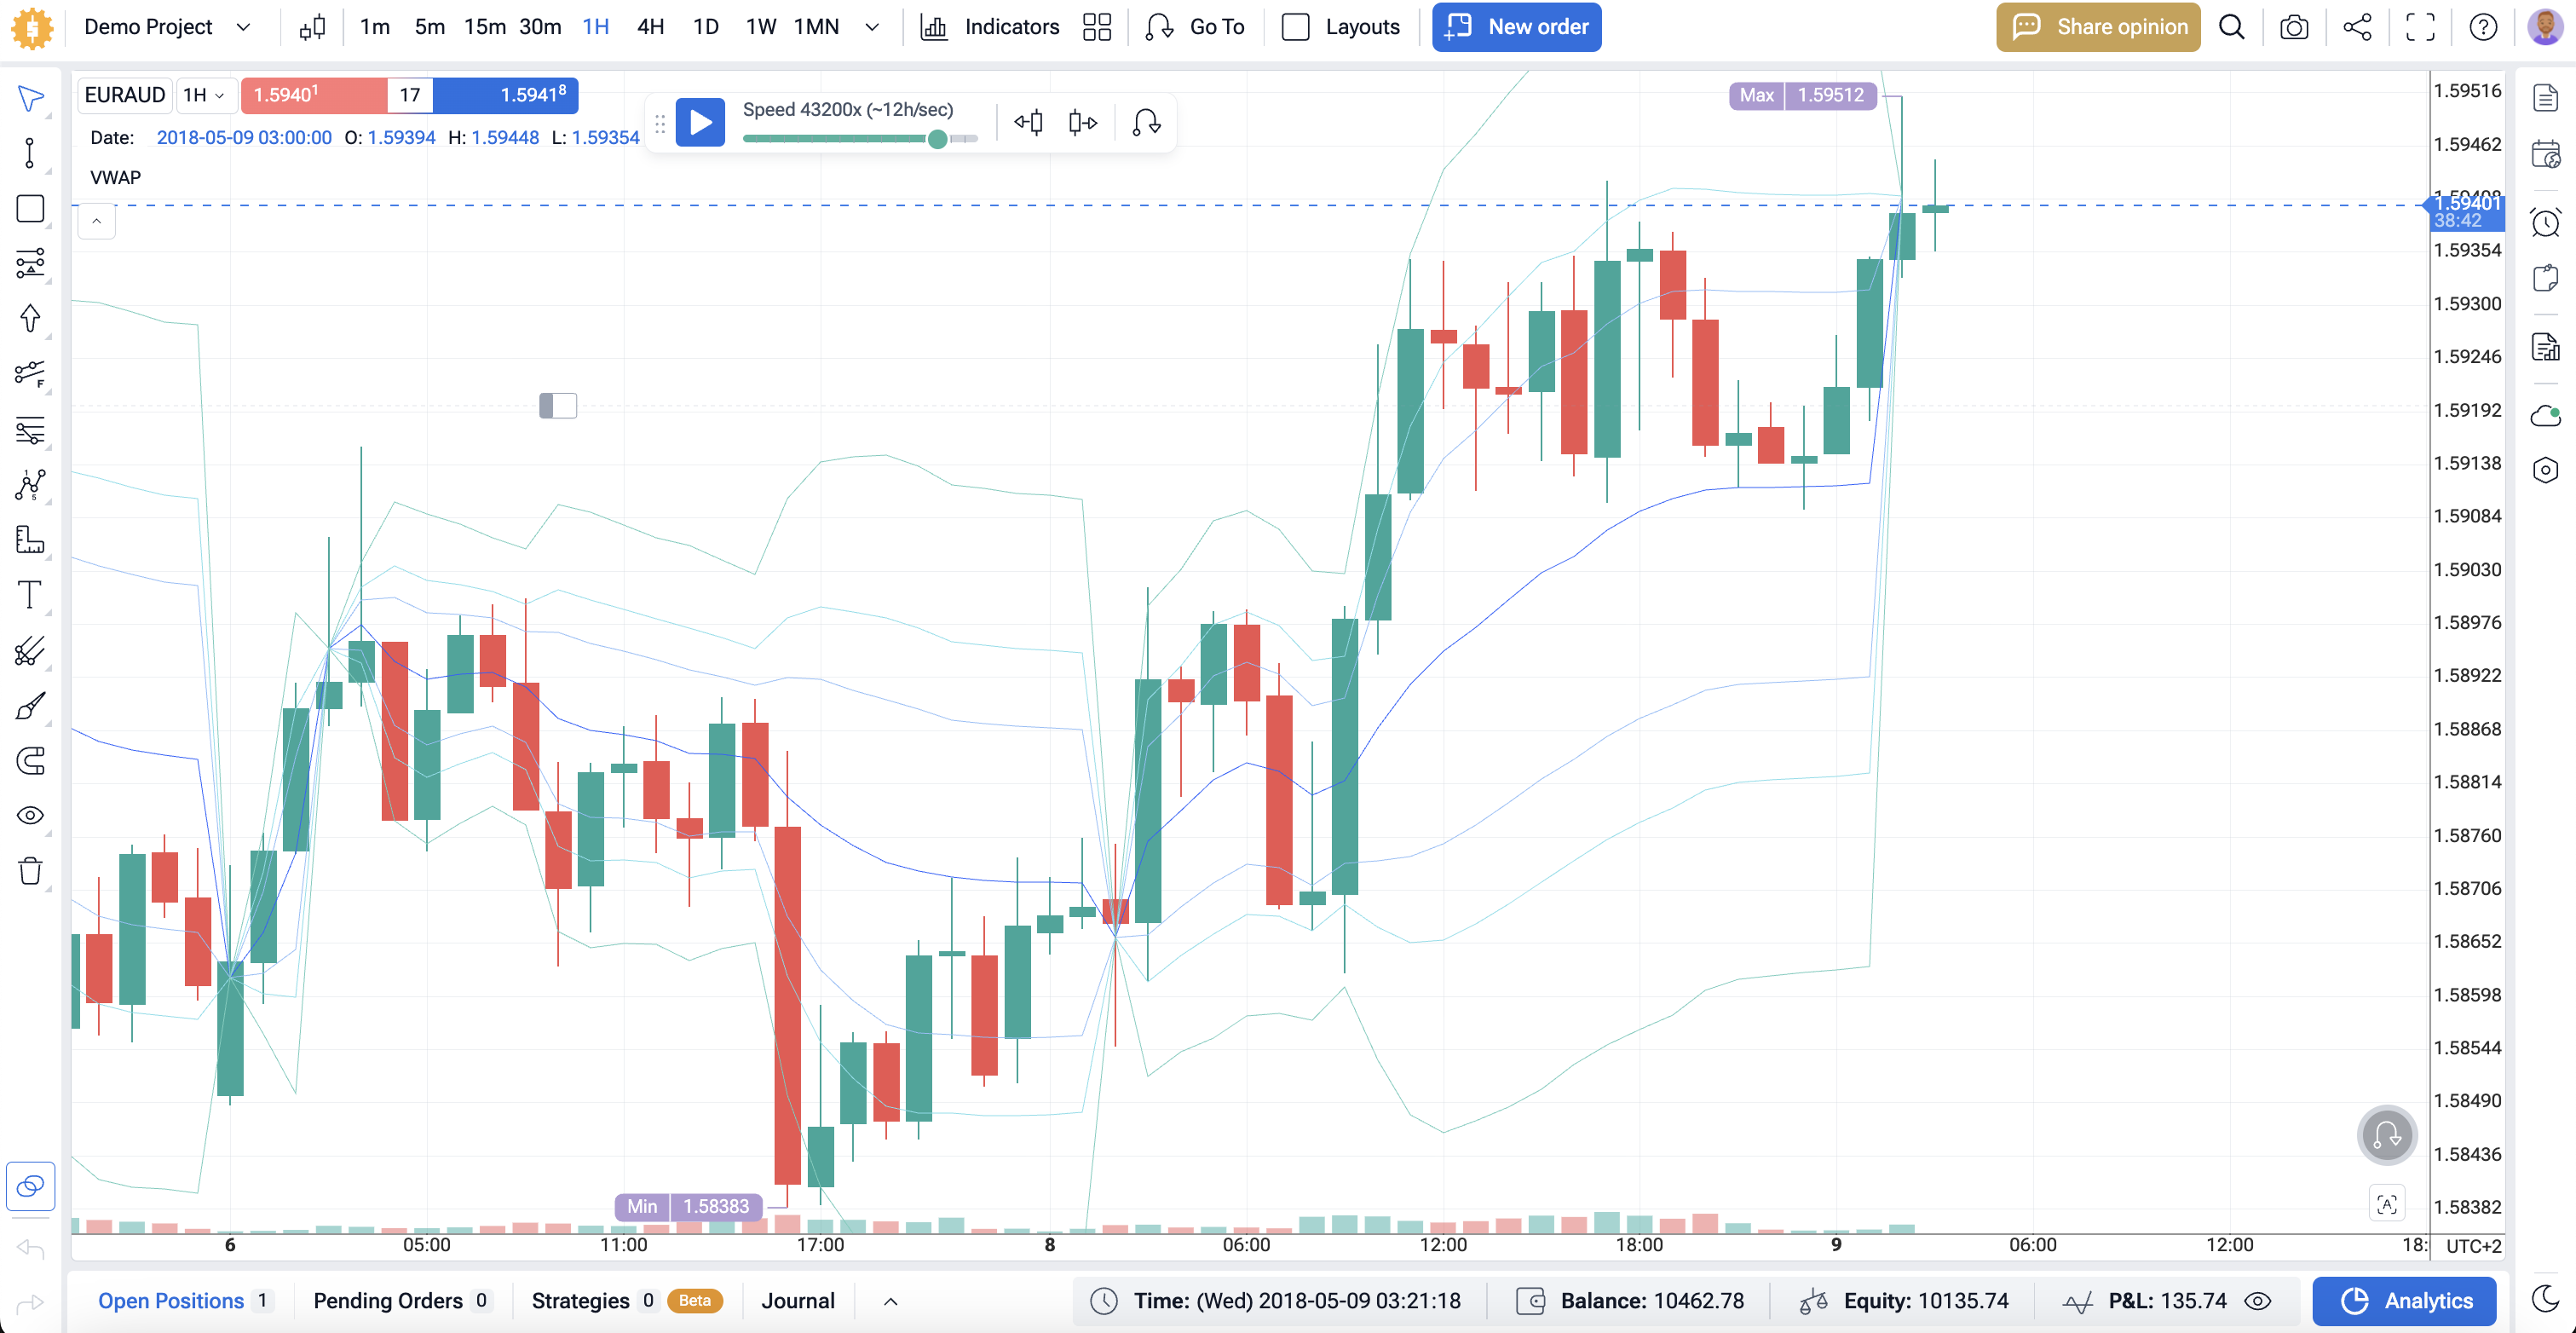
Image source: Forex Tester Online
What is VWAP (Volume-Weighted Average Price)?
VWAP is an intraday moving average that weights each trade by its volume. In simple terms: it’s the average price paid today, not just the midpoint of highs and lows. The line starts at the session open, updates with every new trade, and resets at the next open. That makes VWAP a session benchmark, not a rolling multi-day indicator.
How it differs from SMA/EMA:
| SMA / EMA | VWAP |
|---|---|
| display average price only | blends price and volume |
| roll forward across days | restarts each session |
| show trend smoothness | shows where most volume traded today |
Why traders even care:
- If the price is above VWAP, buyers control the session bias. Below it, sellers do.
- Many desks measure execution quality against Volume Weighted Average Price. Buying under VWAP or selling above it is often seen as good execution.
- Because big orders shape volume, this indicator often acts as dynamic support or resistance on intraday charts.
Use cases across markets:
- Day trading stocks: read the morning trend and pullbacks to VWAP.
- Forex and crypto: gauge session balance on liquid pairs and coins.
- Futures: align entries with the session’s fair price zone.
So, the bottom line is: this indicator is an intraday, volume-aware moving average that helps us judge trend, mean reversion, and trade location in real time.
VWAP calculation
Here is the formula:
VWAP = (sum of Typical Price × Volume) ÷ (sum of Volume) from the session open.
Typical Price = (High + Low + Close) ÷ 3.
You don’t need to remember the whole formula. You just need to understand how it works so that you know what you are doing.
The indicator updates tick by tick. Each new trade adds price × volume to the numerator and volume to the denominator. The line resets at the next session open. Because big prints add more weight, the Volume Weighted Average Price reacts more to heavy trading than to thin spikes.
Key points:
- Intraday only. New day, new VWAP.
- Volume weighting matters. A 1,000-share trade moves more than a 10-share trade.
- You can add standard-deviation bands around VWAP to gauge stretch.
How traders use VWAP
Think of it as the “fair” intraday price.
Price above = bullish bias. Buyers paid up. Many read this as trend support.
Price below = bearish bias. Sellers dominate. VWAP often acts as resistance.
Common uses:
- Dynamic support/resistance. Pullback to VWAP in an uptrend is a classic entry.
- Trend confirmation. Stay with longs while price holds above the line.
- Mean reversion. Fade a quick spike back toward the banded VWAP.
- Execution quality. Many desks compare fills to VWAP as a benchmark.
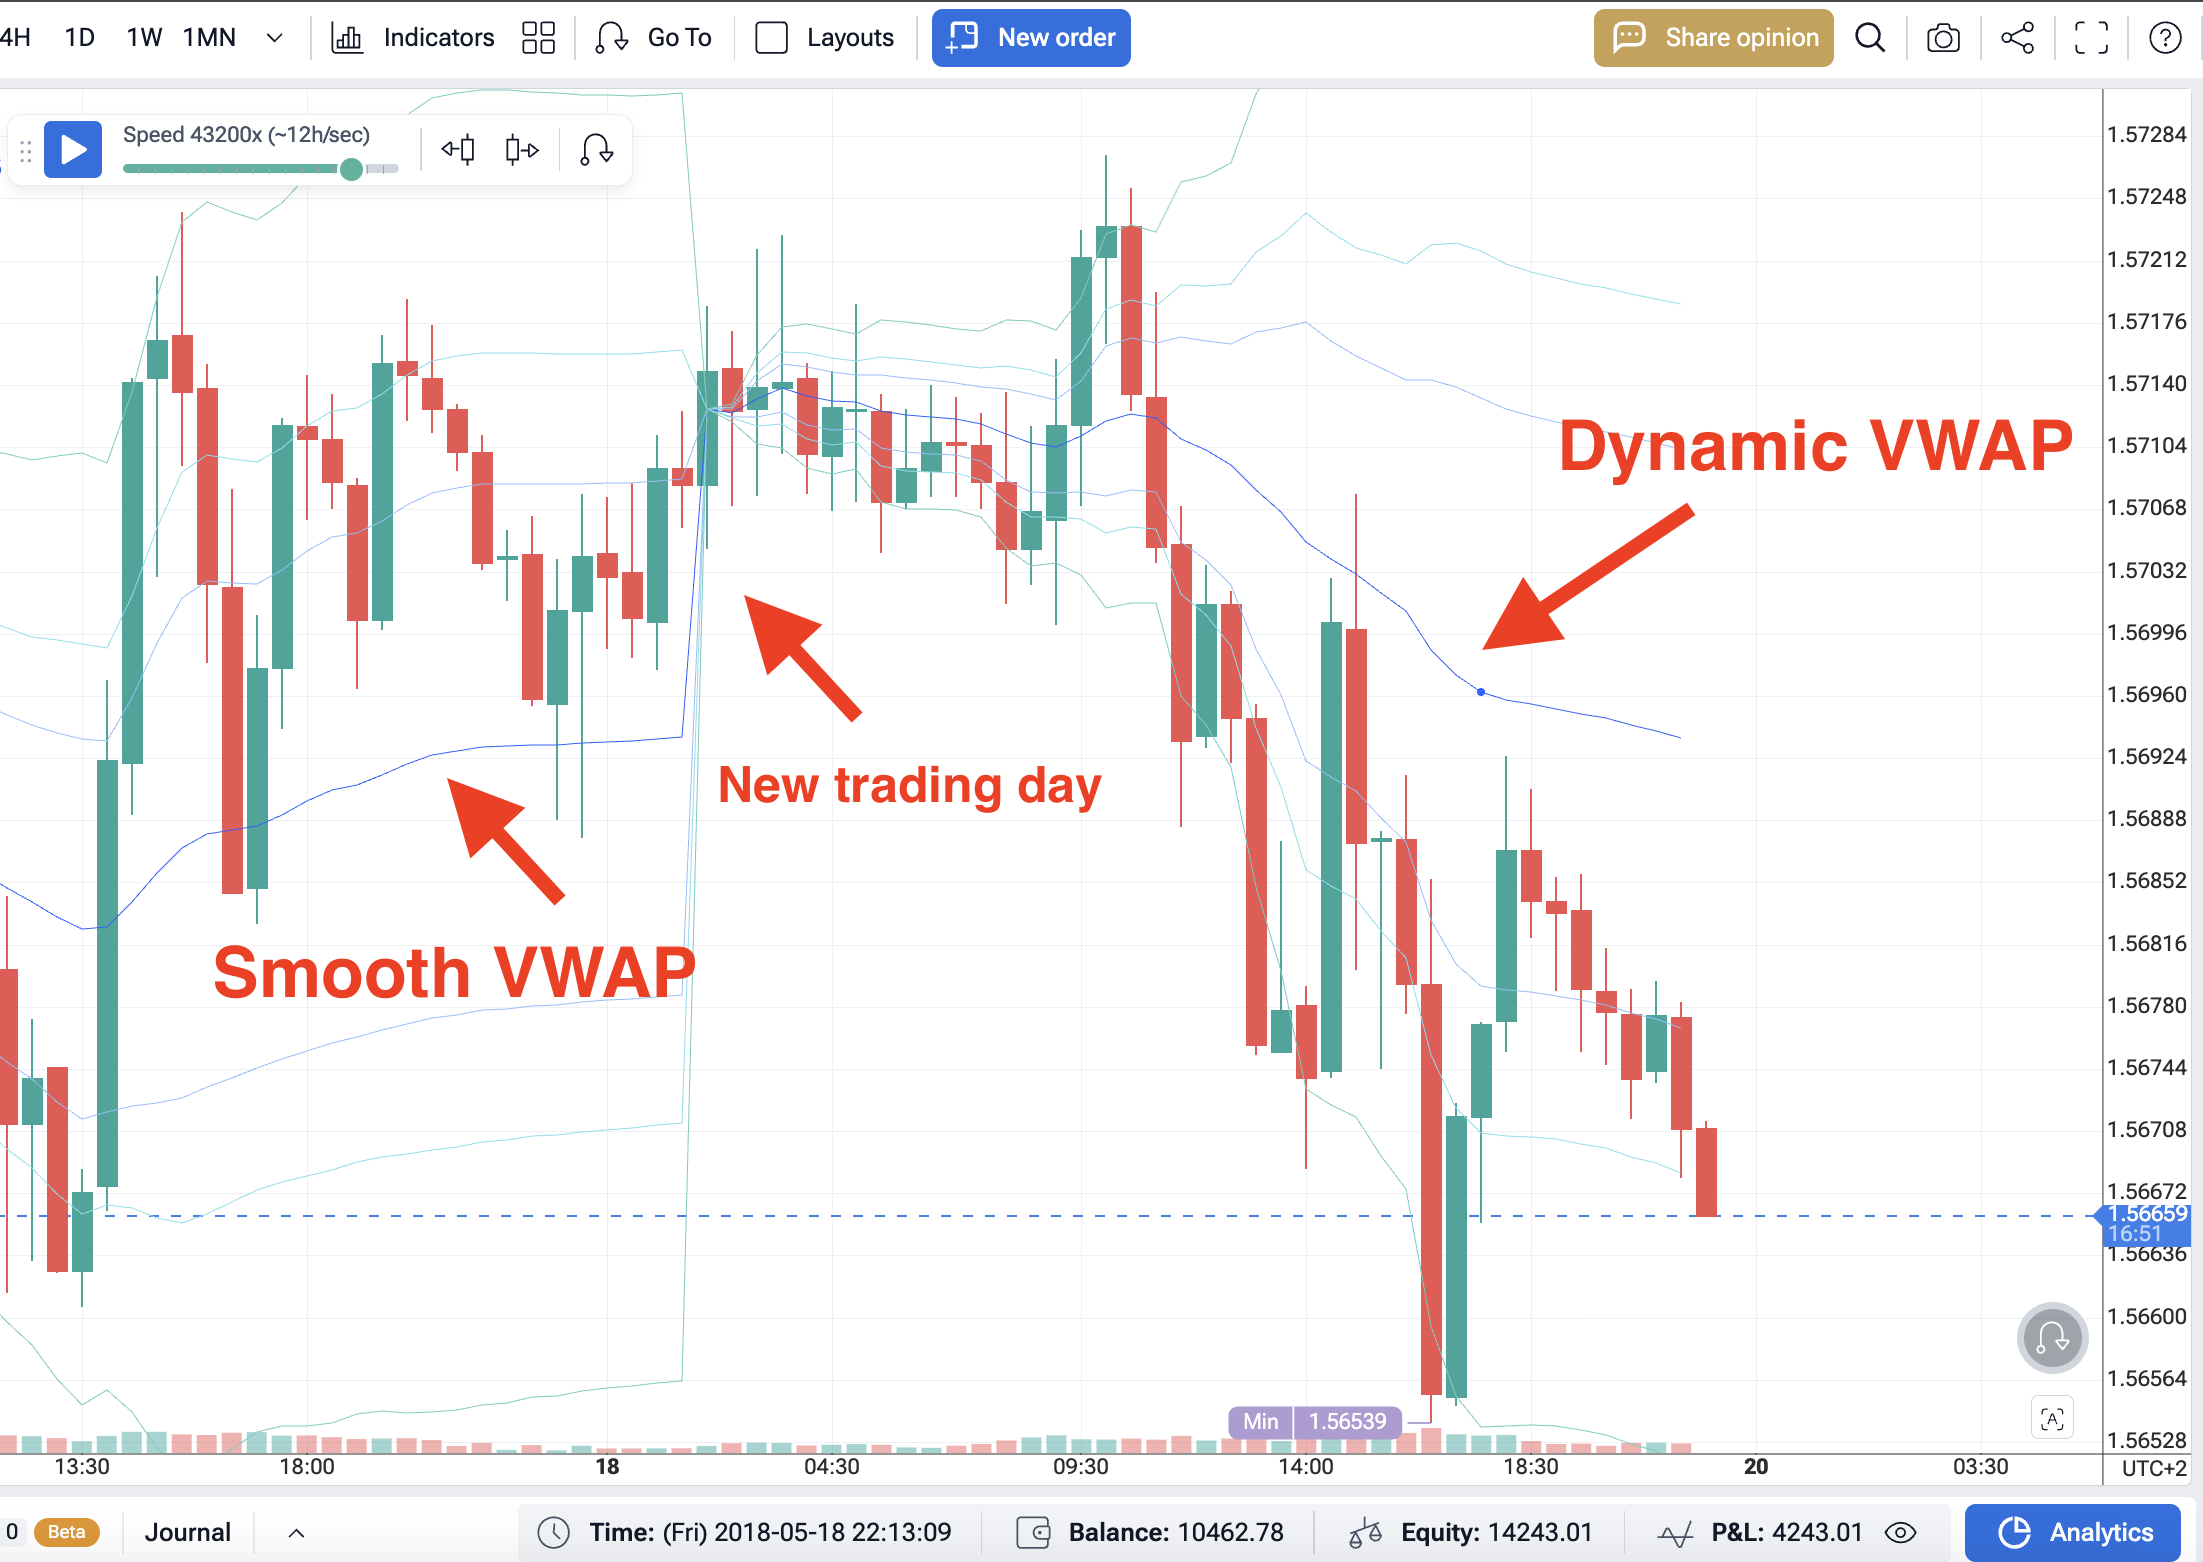
Smooth VWAP = VWAP smoothed with a moving average; Dynamic (anchored) VWAP = VWAP restarted from any chosen bar or event. A new trading day is the session open when VWAP resets.
This works for day trading in stocks, futures, forex, and crypto. On a trading platform, overlay VWAP on a 1-, 5-, or 15-minute chart for clear context.
VWAP trading strategies
Related: 40 Best Forex Trading Strategies
1) Pullback to VWAP (trend continuation)
Context: intraday uptrend. Price rides above a rising Volume Weighted Average Price.
Entry: wait for a clean retrace to the VWAP line. Look for a small bullish candle or RSI > 50.
Stop: a few ticks below the recent swing low or below the lower VWAP band (-1σ).
Exit: partial at the prior high; runner trails under VWAP or an ATR stop.
Flip for shorts when the trend is below.
Note: please use backtesting software to test every strategy before going live.
2) VWAP crossover (breakout filter)
Context: opening range set. Volume is strong.
Entry: go long on a 1-bar close above VWAP with rising volume and MACD > 0. For shorts, close below Volume Weighted Average Price with volume.
Stop: beyond the opposite band or last micro swing.
Exit: scale at R=1; final when price loses VWAP or RSI rolls under 50.
3) Mean reversion with VWAP bands
Add ±1σ and ±2σ standard-deviation bands.
Entry: fade a tag of the outer band back toward VWAP only when tape is range-bound (flat).
Stop: outside the outer band by 0.5×ATR.
Exit: base at VWAP; optional second target at the opposite inner band.
4) Anchored VWAP (event-based)
Anchor the AVWAP to a key bar: the day’s open, earnings gap, FOMC bar, or a swing high/low.
Entry: buy pullbacks to the anchored line in an up move; sell rallies to it in a down move.
Stop: beyond the anchor line plus 1×ATR.
Exit: prior high/low, or trail with the anchored line.
VWAP vs other indicators
Volume Weighted Average Price is a volume-weighted moving average that resets each session. It shows the average price paid today, weighted by volume. Because heavy prints move it more, it tracks real intraday flow and often acts as dynamic support or resistance.
SMA and EMA are classic moving averages. They use price only, roll across days, and smooth noise for broader trend reads. EMA reacts faster than SMA because it weights recent bars more, but neither knows about volume.
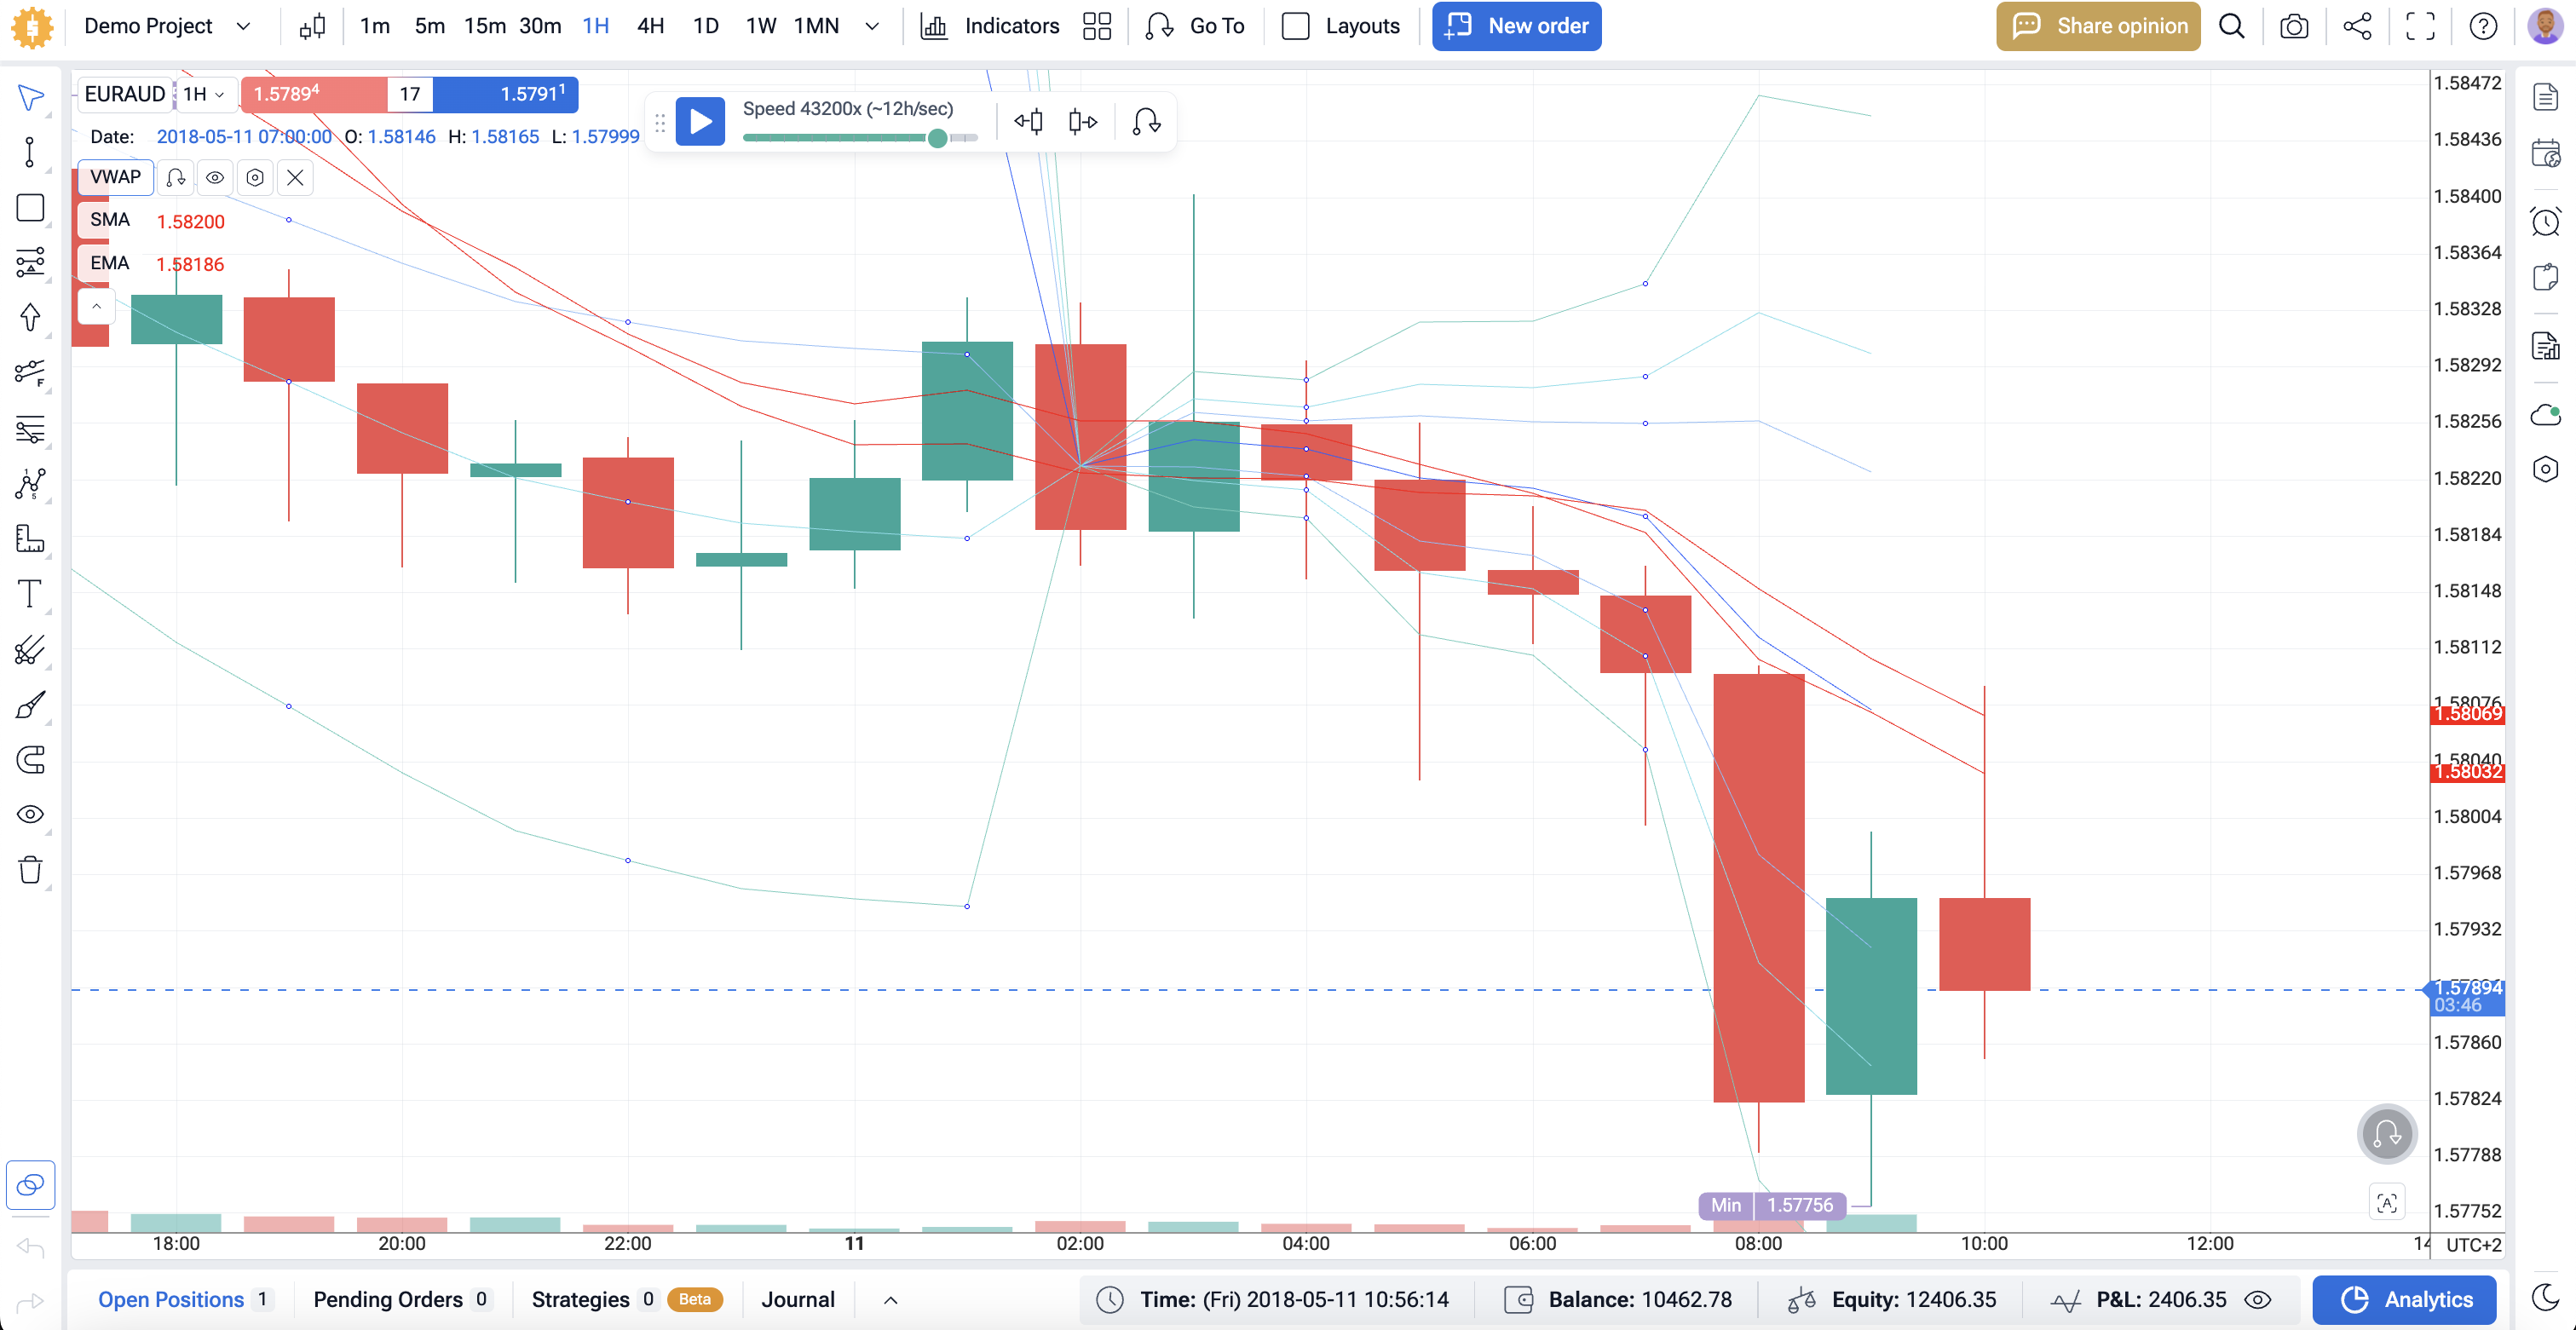
VWAP vs SMA vs EMA
When to prefer each on a trading platform:
- Use Volume Weighted Average Price for intraday execution, pullback entries to the line, and as a fair-value guide during the session. It helps filter breakout traps and plan entry/exit around where most trading happened.
- Use SMA/EMA for bigger trend context, swing bias, and trailing stops outside the day’s flow. For example, price above 50-EMA and holding above VWAP intraday = strong alignment.
VWAP with other tools
Pair the indicator with simple technical indicators to improve entry and exit quality:
- RSI for momentum. In an up-session, wait for RSI > 50 and a pullback to VWAP for a cleaner long. In a fade, look for RSI to roll under 50 on a loss of VWAP.
- Bollinger Bands for stretch. Price tagging the outer band while VWAP is flat suggests mean reversion back. If bands expand and VWAP slopes hard, favor trend trades, not fades.
- ATR for risk. Set stop distance with ATR (e.g., 1–2× ATR beyond or its bands). Size positions so one loss fits your plan.
- SMA/EMA + VWAP for regime check. MA up and VWAP up = trend day; buy pullbacks to VWAP. Flat MA and flat = range; fade band extremes back to VWAP. MA down and price under VWAP = look for short setups.
- Anchored VWAP for events. Anchor from the open, a gap, or a swing high/low. Trade reactions at the anchored line as moving support/resistance with clear entry and exit rules.
Used together, Volume Weighted Average Price gives the intraday “fair price,” while RSI, ATR, Bollinger Bands, and moving averages add momentum, risk, volatility, and trend context. This mix keeps signals simple and your trading rules clear.
Improve Your Trading Results with the VWAP Indicator through FTO
Backtesting lets you learn it without risking money. In Forex Tester Online you replay intraday data, watch the Volume Weighted Average Price reset each session, and practice entry and exit rules until they are clear.
Step-by-step: testing in FTO
1) Get access
Go to the FTO site, click Get Started, create an account, pick a plan, and sign in.
2) Create a project
Click + New Project. Select symbols (Forex majors, US stocks, crypto, or indices). Set start/end dates and your time zone. Choose tick or 1-min data for realistic VWAP behavior.
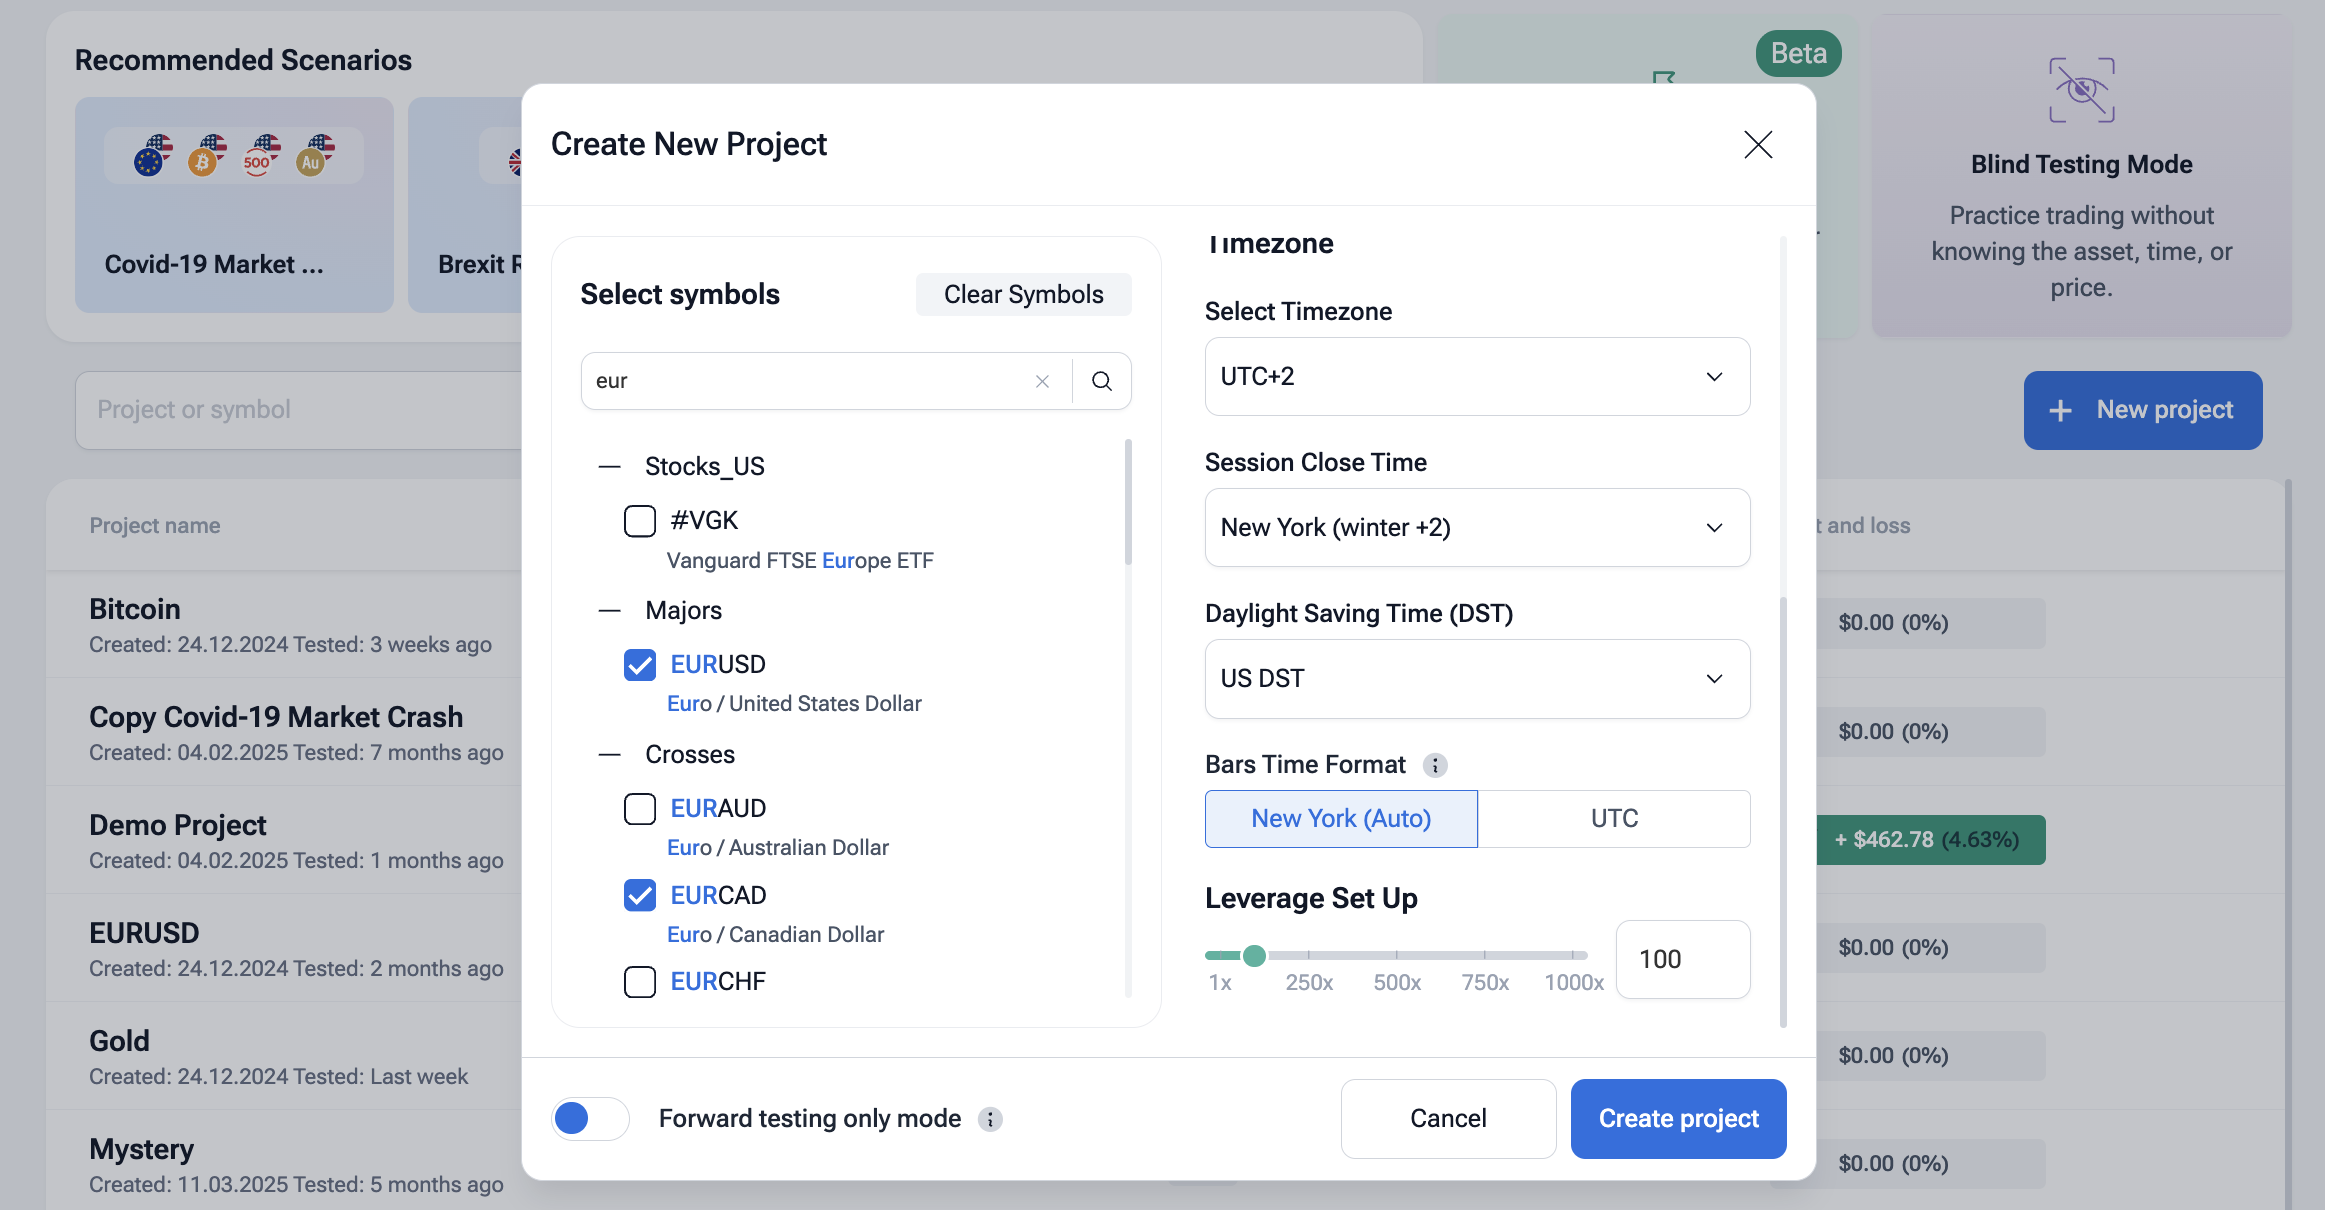
Add spread, commission, and slippage so fills look real. For VWAP, pick the correct session: regular hours for stocks; a fixed reset time for forex; a chosen UTC reset for crypto.
3) Add indicators
Open Indicators.
Turn on VWAP (session Volume Weighted Average Price). If available, add VWAP bands (standard deviations).
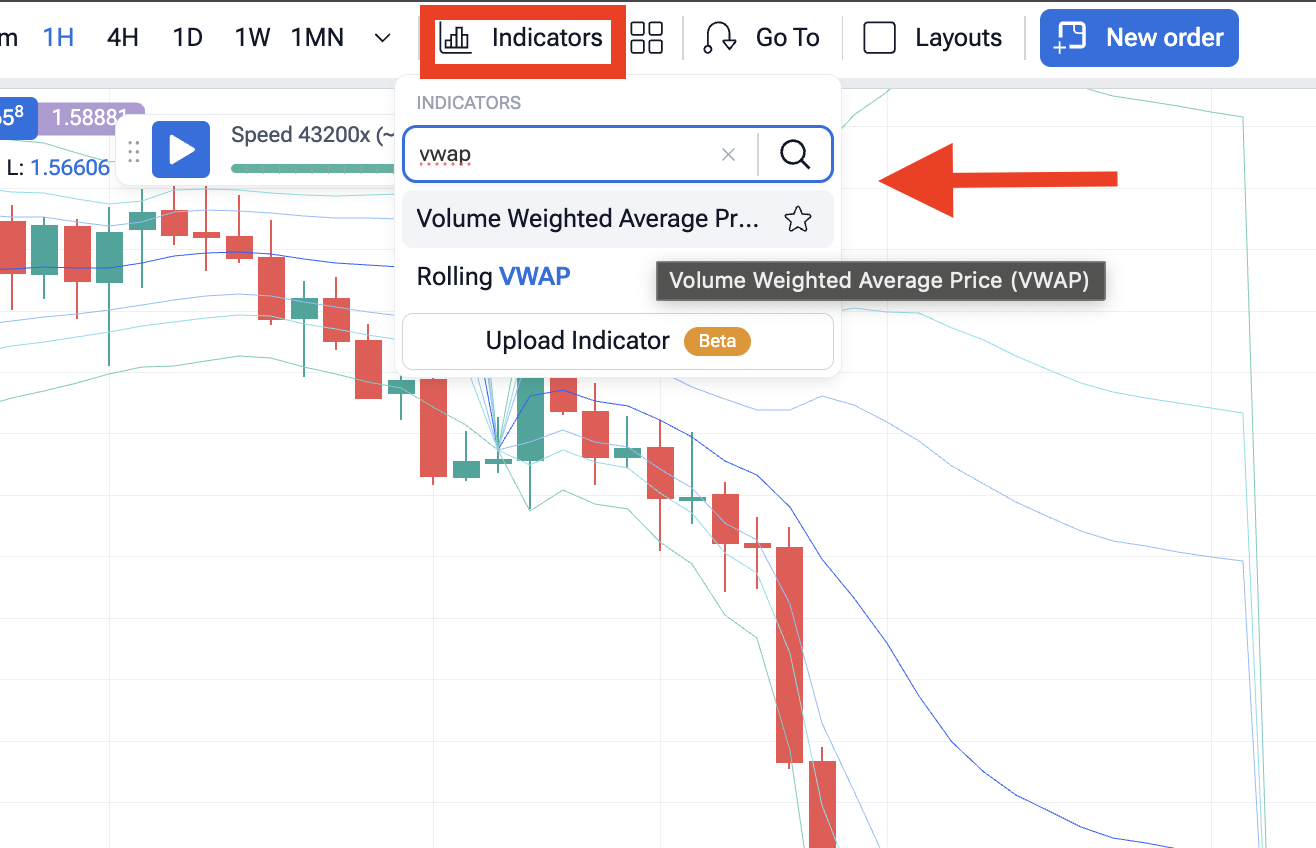
Add Anchored VWAP and choose anchors (session open, swing high/low, gap bar). Then add a 50-EMA (trend filter), RSI, ATR, Bollinger Bands, and Volume. Save the template so you can reuse it on any chart.
4) Define your trading rules
Write simple rules before you click Play. Examples:
- VWAP pullback: price above 50-EMA; wait for a pullback; RSI > 50; enter on a bullish candle back above VWAP; stop = 1.5× ATR under VWAP; take partial at prior high; trail under the indicator.
- VWAP breakout: price bases below VWAP; enter on a close back above it with volume ≥ 120% of 20-bar average; stop under the last swing; target the day’s range or the upper VWAP band. Keep all entry/exit and stop loss rules in one note. No guessing mid-test.
5) Replay and trade
Click Play to start the simulation. Use the speed slider for bar-by-bar or fast ticks. Place orders with New Order as your signal appears.
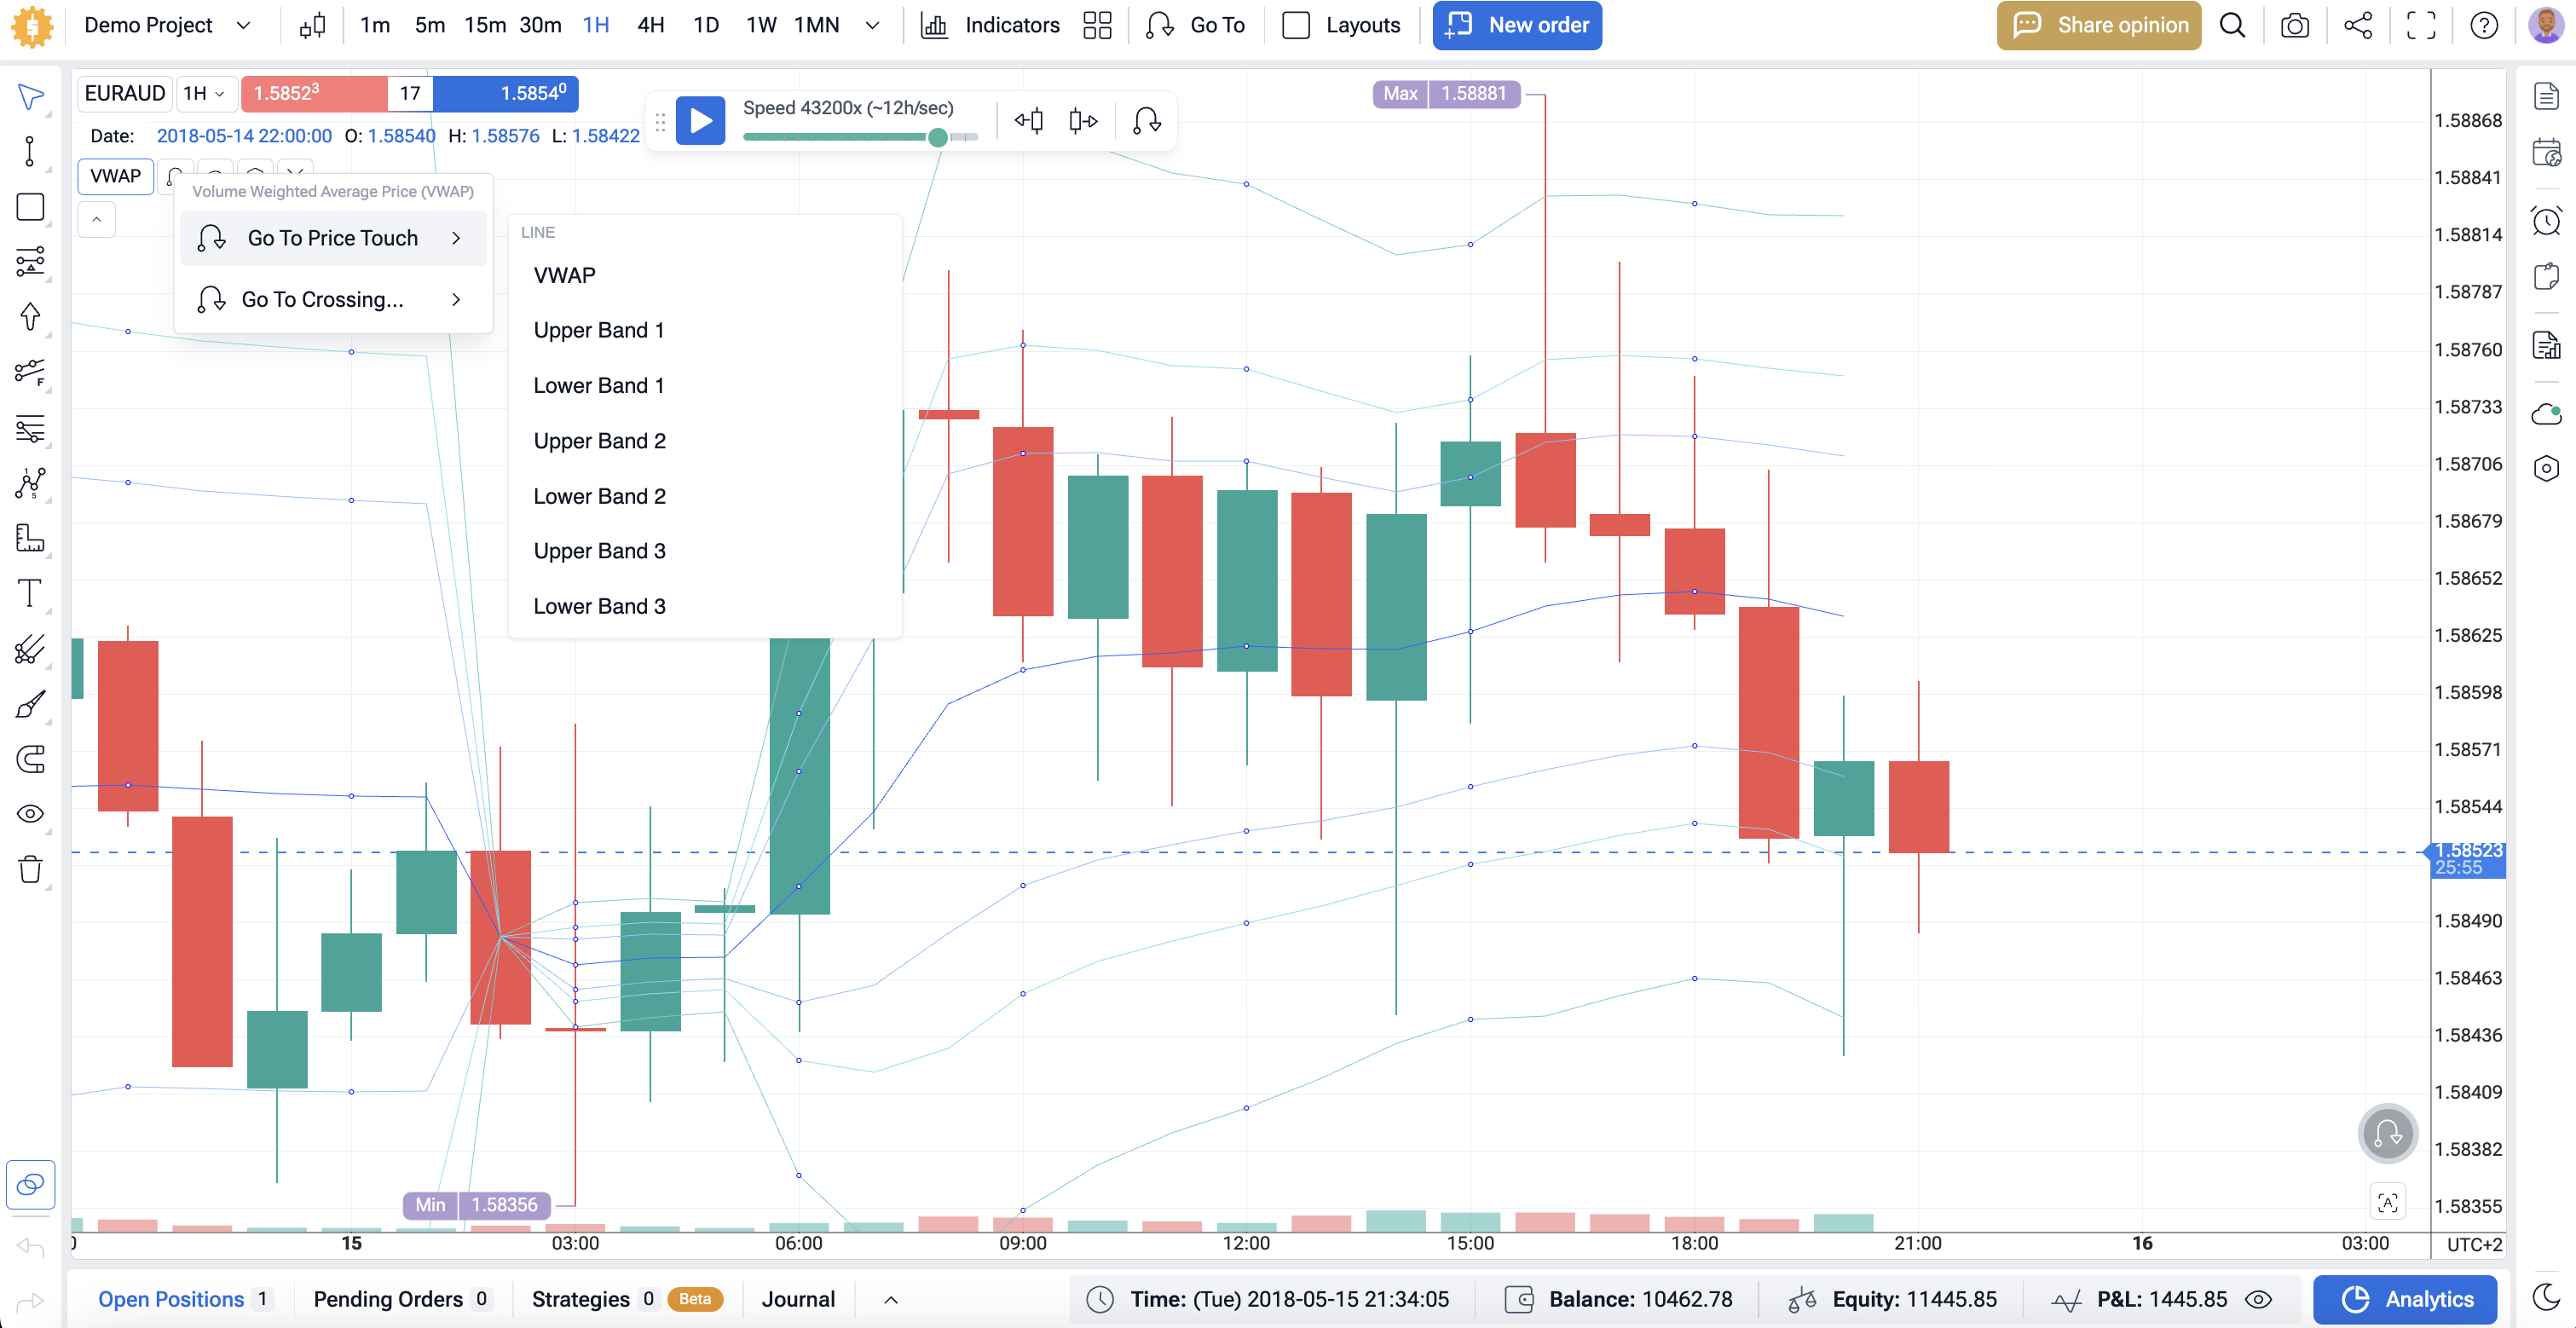
Use Jump To to move between sessions and news days. On Forex Tester Online, you can even instantly jump to the exact VWAP price touch.
6) Review analytics
Open Analytics after each run.
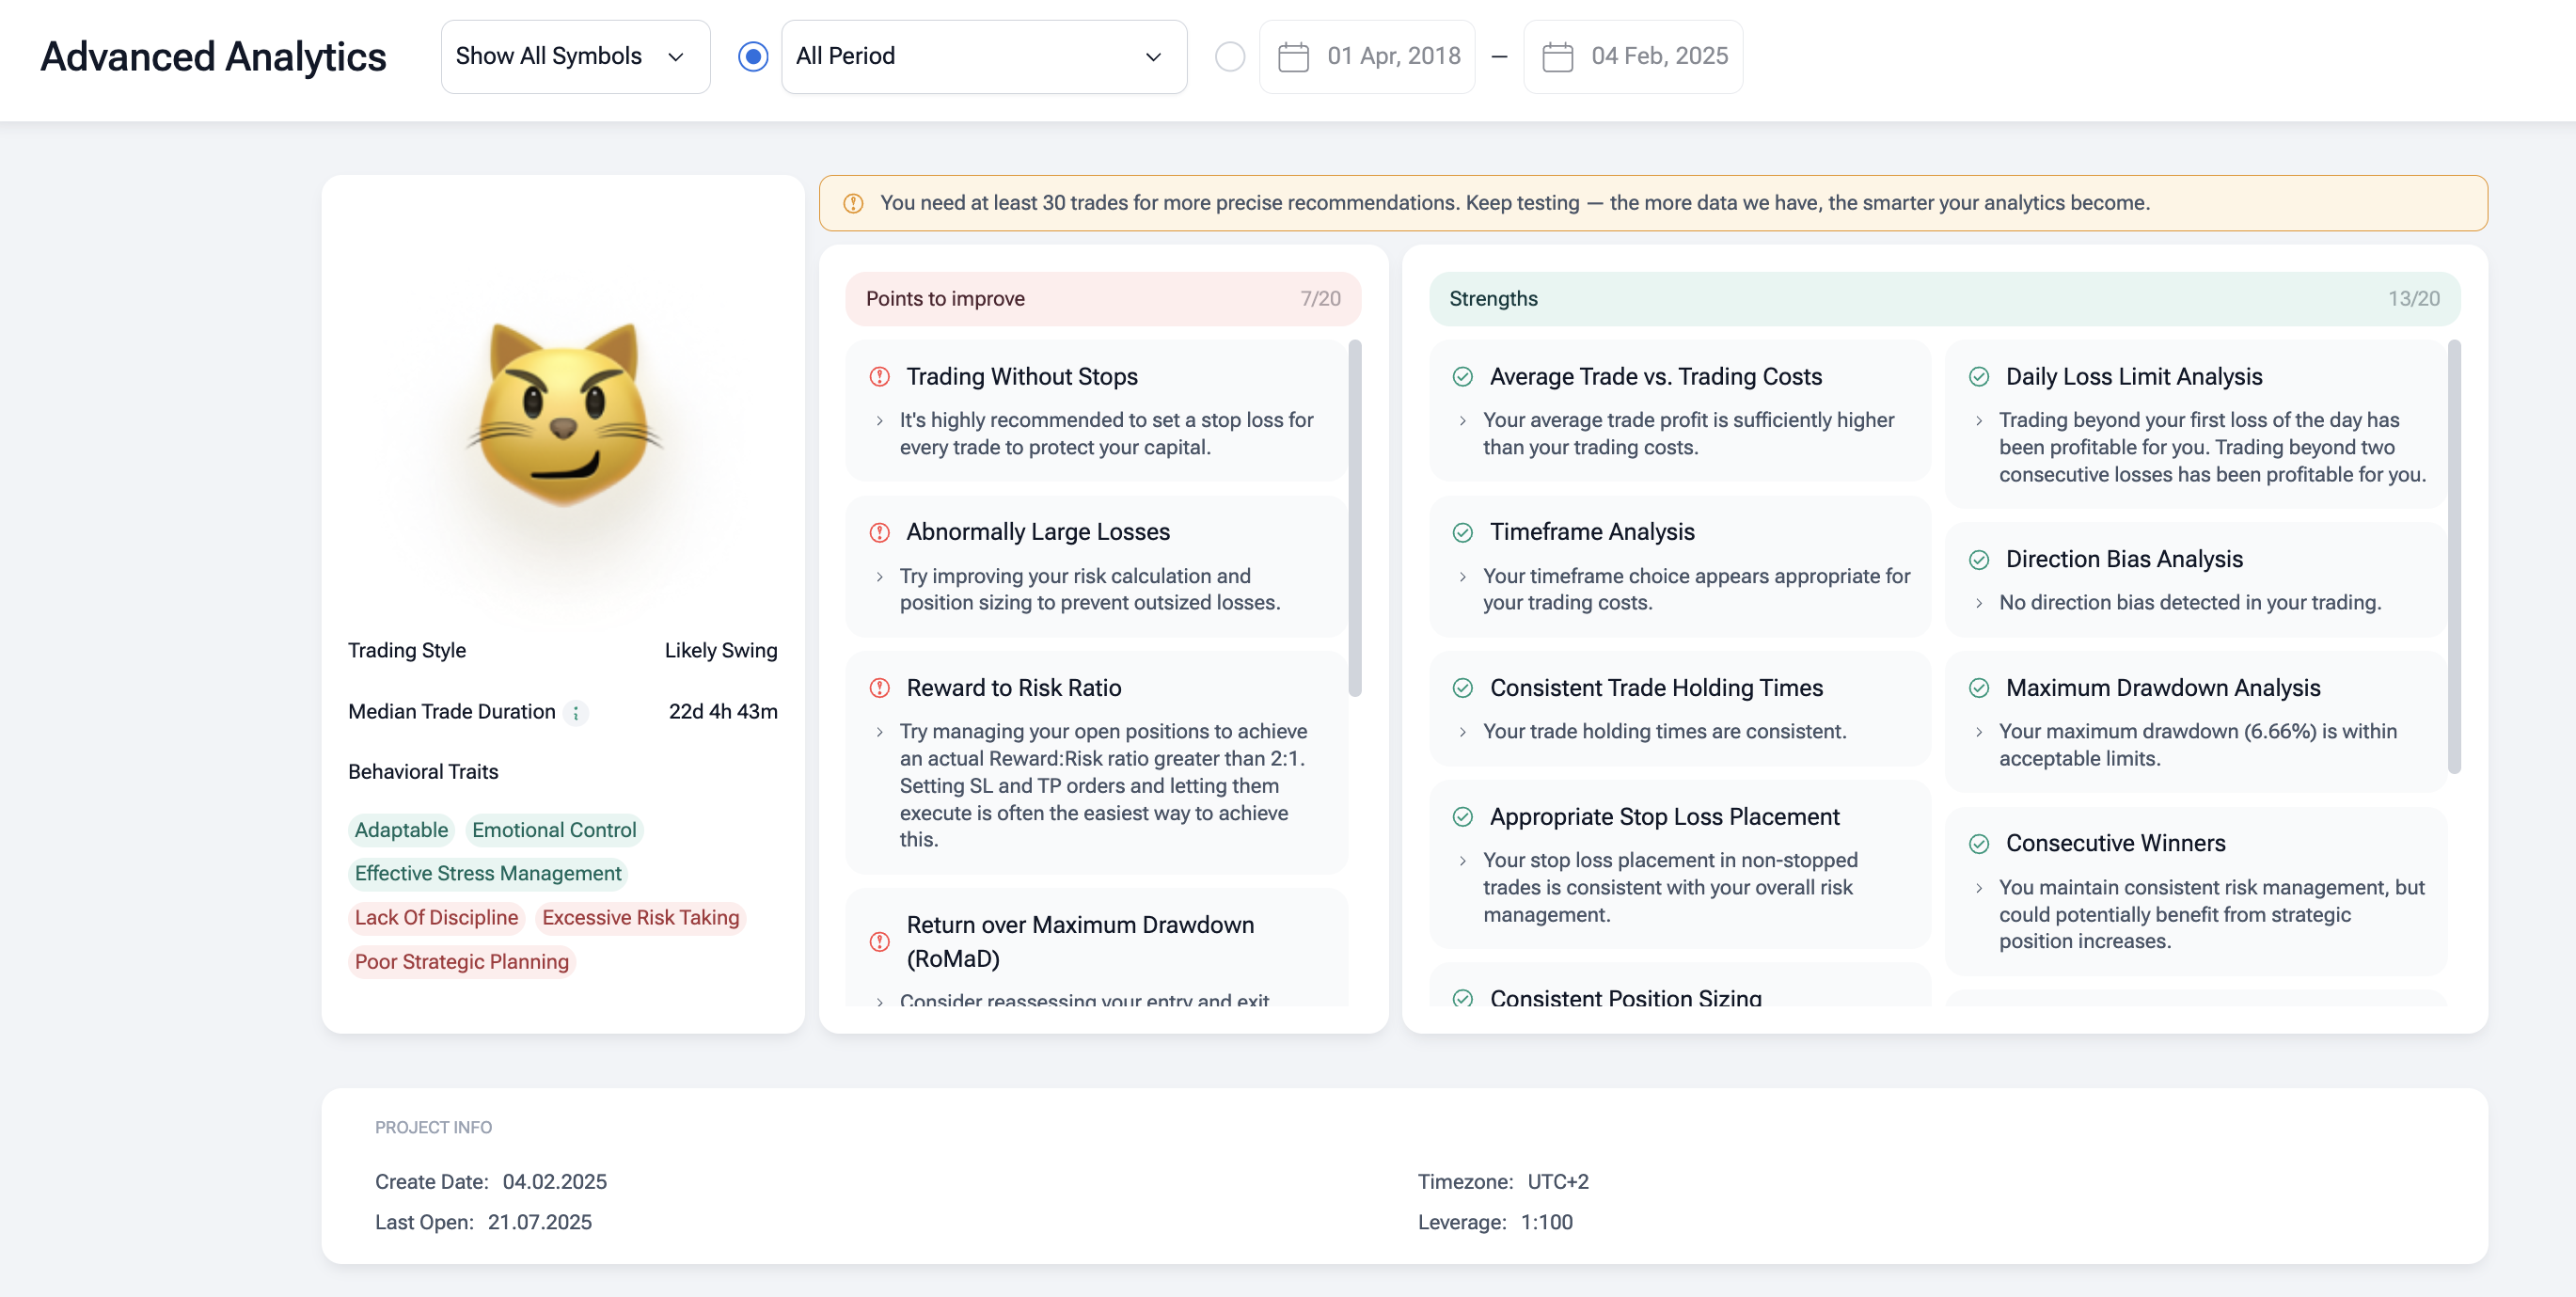
Note win rate, average trade, and drawdown.
Check MAE/MFE to see if stops are too tight or too loose.
The Advanced Analytics on FTO will also show your strengths and points to improve which is very useful to gain skills.
Tag results by time of day (first hour, lunch, power hour). VWAP acts differently in each window. Export trades to CSV and review “above vs below ” outcomes.
7) Iterate and refine
Change one thing at a time. Optimize it as many times as needed until you are happy with the performance.
Conclusion
The indicator gives a clear, volume-weighted view of fair intraday price. Because it resets each session, it works as a live benchmark and a dynamic support and resistance line. Use Volume Weighted Average Price for clean entry and exit logic in breakout, pullback, and mean reversion setups. Add context with a moving average, RSI or MACD, Bollinger Bands, and ATR for stops. For key events, anchor an Anchored VWAP to the open, a swing, or news. Backtest every strategy on a trading platform first. Forex Tester Online lets you practice rules, refine risk, and learn the tape without risking money.
Disclaimer
Trading involves risk. This article is for education only and is not financial advice. Past results do not guarantee future returns. Always test strategies on demo data, use defined stop losses and position sizing, and account for spreads, commissions, and slippage before trading live.
FAQ
Is VWAP better for day trading or swing trading?
It is built for intraday use. It resets each session. That makes it great for day trading. For multi-day ideas, use Anchored VWAP from a key event, or re-anchor each day.
How does the calculation work in practice?
It tracks the running total of Typical Price × Volume divided by total Volume. Typical Price is (High + Low + Close) ÷ 3. The indicator updates tick-by-tick, so the Volume Weighted Average Price reflects live order flow.
Can I use it in forex and crypto?
Yes, with care. In forex, brokers show tick volume, not centralized volume. Treat VWAP as a proxy. In crypto, VWAP is exchange-specific. Use the same venue for signal and execution. Thin pairs can distort the line.
What entry and exit rules work well with VWAP?
Three simple ideas: a breakout above Volume Weighted Average Price for a long, a pullback in a trend, and mean reversion from a deviation band back to the line. Plan the exit at prior support or resistance, or trail with ATR. Always define the stop before entry.
How does Anchored VWAP help my strategy?
Anchored VWAP ties the Volume Weighted Average Price to a start point you choose: the open, a swing high/low, earnings, or news. In a trend, it acts like a moving average with real volume context. Price above an anchored line shows buyers in control.
What volume weighted indicators pair well?
Try VWMA (Volume-Weighted Moving Average) for a rolling view, On-Balance Volume for flow direction, and Money Flow Index for momentum with volume. Together they confirm pressure behind price, not just the print.
What should a trading platform offer for VWAP?
You want clean intraday charts, Anchored VWAP, standard-deviation bands, and price/volume overlays. Alerts on cross or band touch help. For testing, a simulator like Forex Tester Online lets you backtest strategies before risking money.
Forex Tester Online
Run VWAP Indicator backtest with historical data!
 ไทย
ไทย
 Tiếng Việt
 Polski
 Türkçe
 Nederlands
 Română
 한국어
한국어
 Svenska
