Summarize at:
Have you ever wished you could go back in time and prepare for some unexpected conditions? Well, in trading, you can at some point. Technically, it’s more like a super-realistic rehearsal before risking real money on your live account. Backtesting is like a flight simulator for traders – it lets us test a strategy on past historical data before risking real money.
We can see how our rules would have worked, measure results, and fix weak points. It’s the middle step in the trading cycle: idea, then backtest, validation, and finally live trading. By reviewing win rate, drawdown, and profit factor, we reduce risk and gain confidence. Backtesting helps us turn theory into numbers and understand whether a strategy truly works under different market regimes before it faces live charts.
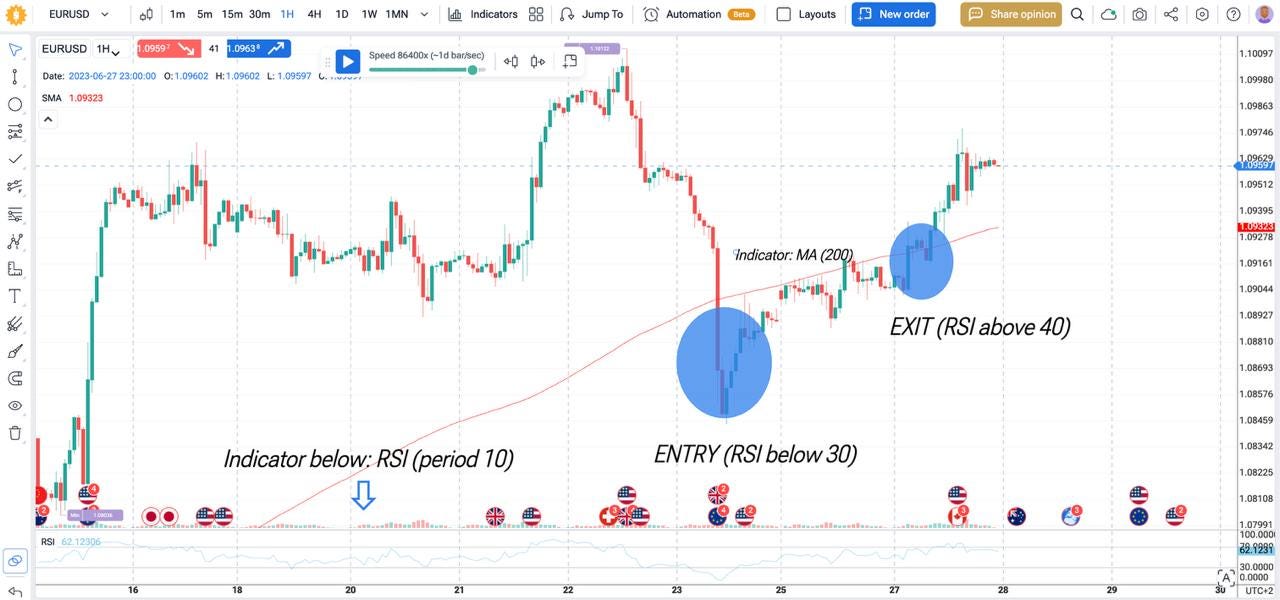
In this article, we will examine the concept of backtesting, its role in trading, how it can enhance your performance, and what kinds of simulation techniques and resources are available to traders in their pursuit of success.
How Backtesting Works
We replay markets using historical data and a trading simulation. Your rules fire on past prices as if they were live.
- Manual backtesting: we click through charts, log trades by hand. Good for learning, slow, more bias.
- Semi-automated: software triggers signals; we confirm entries/exits. Faster, still under control.
- Fully automated (algorithmic) backtesting: code runs everything. Best for speed and large samples.
Keep limits in mind: overfitting, look-ahead bias, poor data quality, ignored slippage and transaction costs can fake results. Backtesting is a filter, not a crystal ball. Validate with forward testing and out-of-sample testing before going live.
Step-by-Step Guide to Backtesting Your Trading Strategy
Define clear rules, use clean historical data, run a trading simulation, read the stats, then refine. Keep it simple and repeatable.
Key Inputs (before you start)
- Rules: entries, exits, stop-loss, targets, size. No gray areas.
- Data: tick for precision; bar/minute for speed. Check data quality, gaps, and time zones.
- Scope: timeframe (M5/H1/D1), instrument (FX pair, stocks, crypto), market regimes you care about.
Key Outputs (what to read)
- Win rate, risk-reward ratio, profit factor, Sharpe ratio
- Drawdown / maximum drawdown, equity curve, volatility of returns
- Costs: slippage and transaction costs
How to Backtest a Trading Strategy via Forex Tester Online (FTO)
Forex Tester Online is a trading strategy backtesting tool that lets retail investors turn an idea into numbers fast.
It includes:
✅ 20 + years tick data for
✅ 700+ trading pairs for Forex, crypto, stocks, commodities, futures, indices, and ETFs
✅ News integration on the chart
✅ Custom technical indicators
✅ Blind testing mode to hide future bars if needed
✅ Ready‑made market scenarios (for example, Covid market crash)
✅ Detailed analytics and latency logs
✅ Automation tab for Python or no‑code rules
✅ Online, on any device (including Windows, macOS, Android, and iOS).
Here is a step-by-step guide on how to properly backtest your trading strategy.
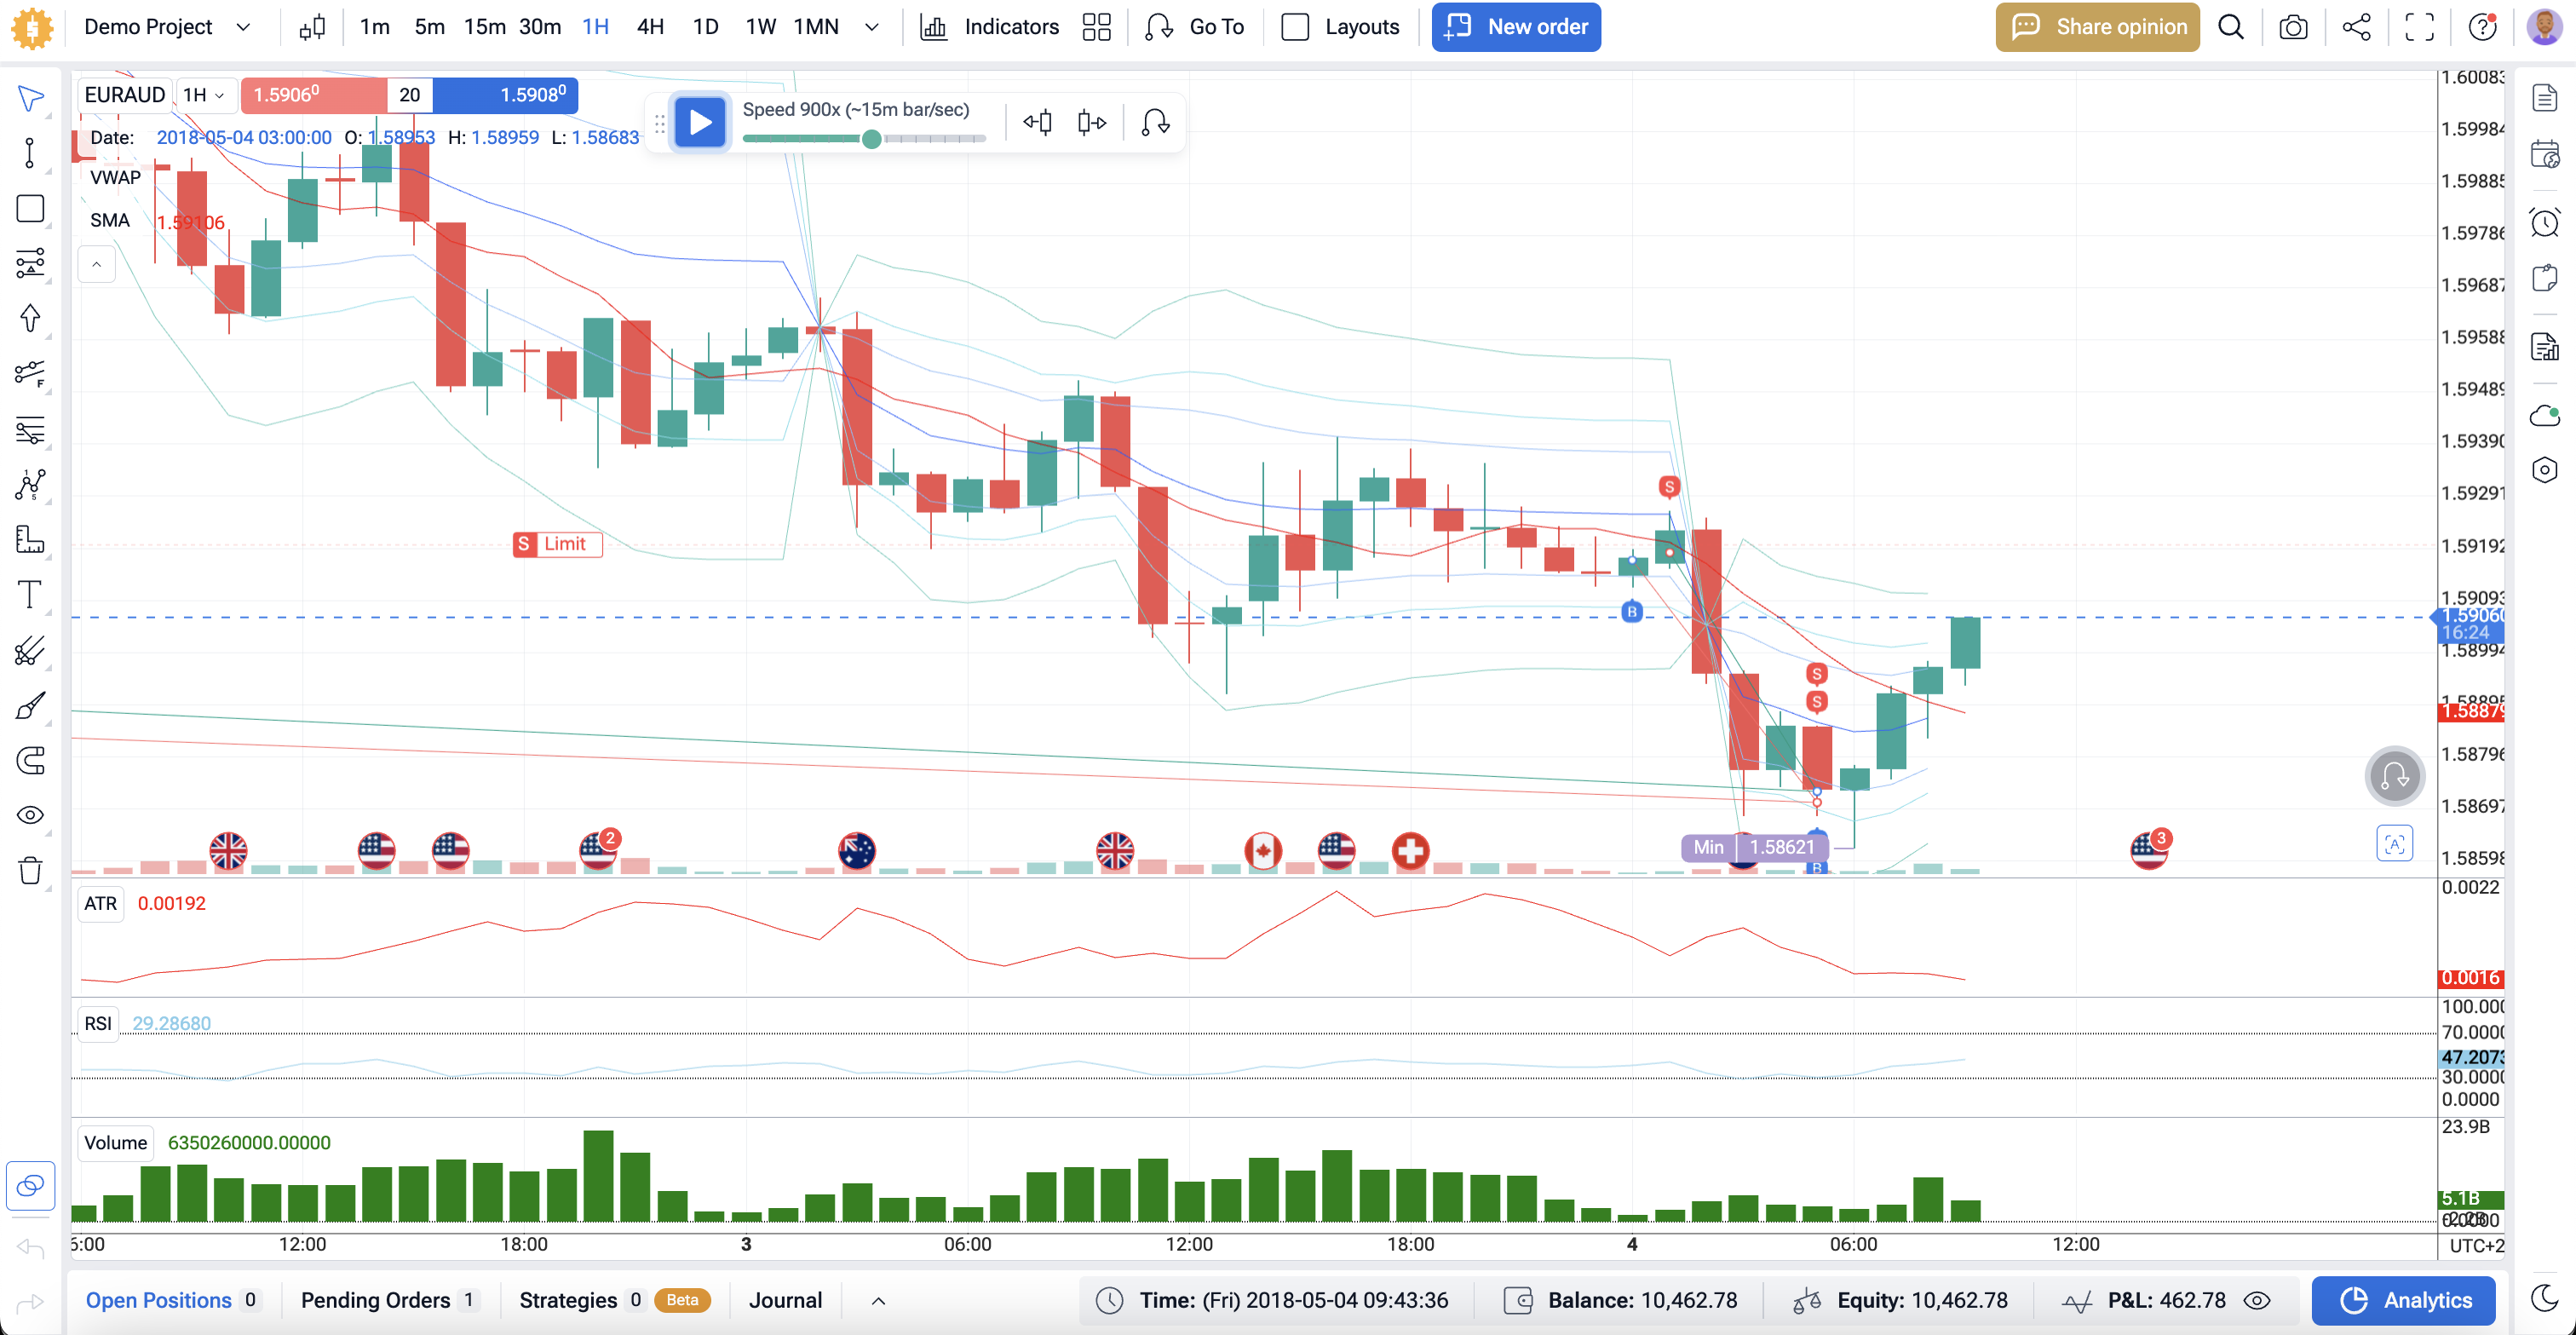
1) Get Access. Log in to FTO. Choose a plan with tick or 1-min data.
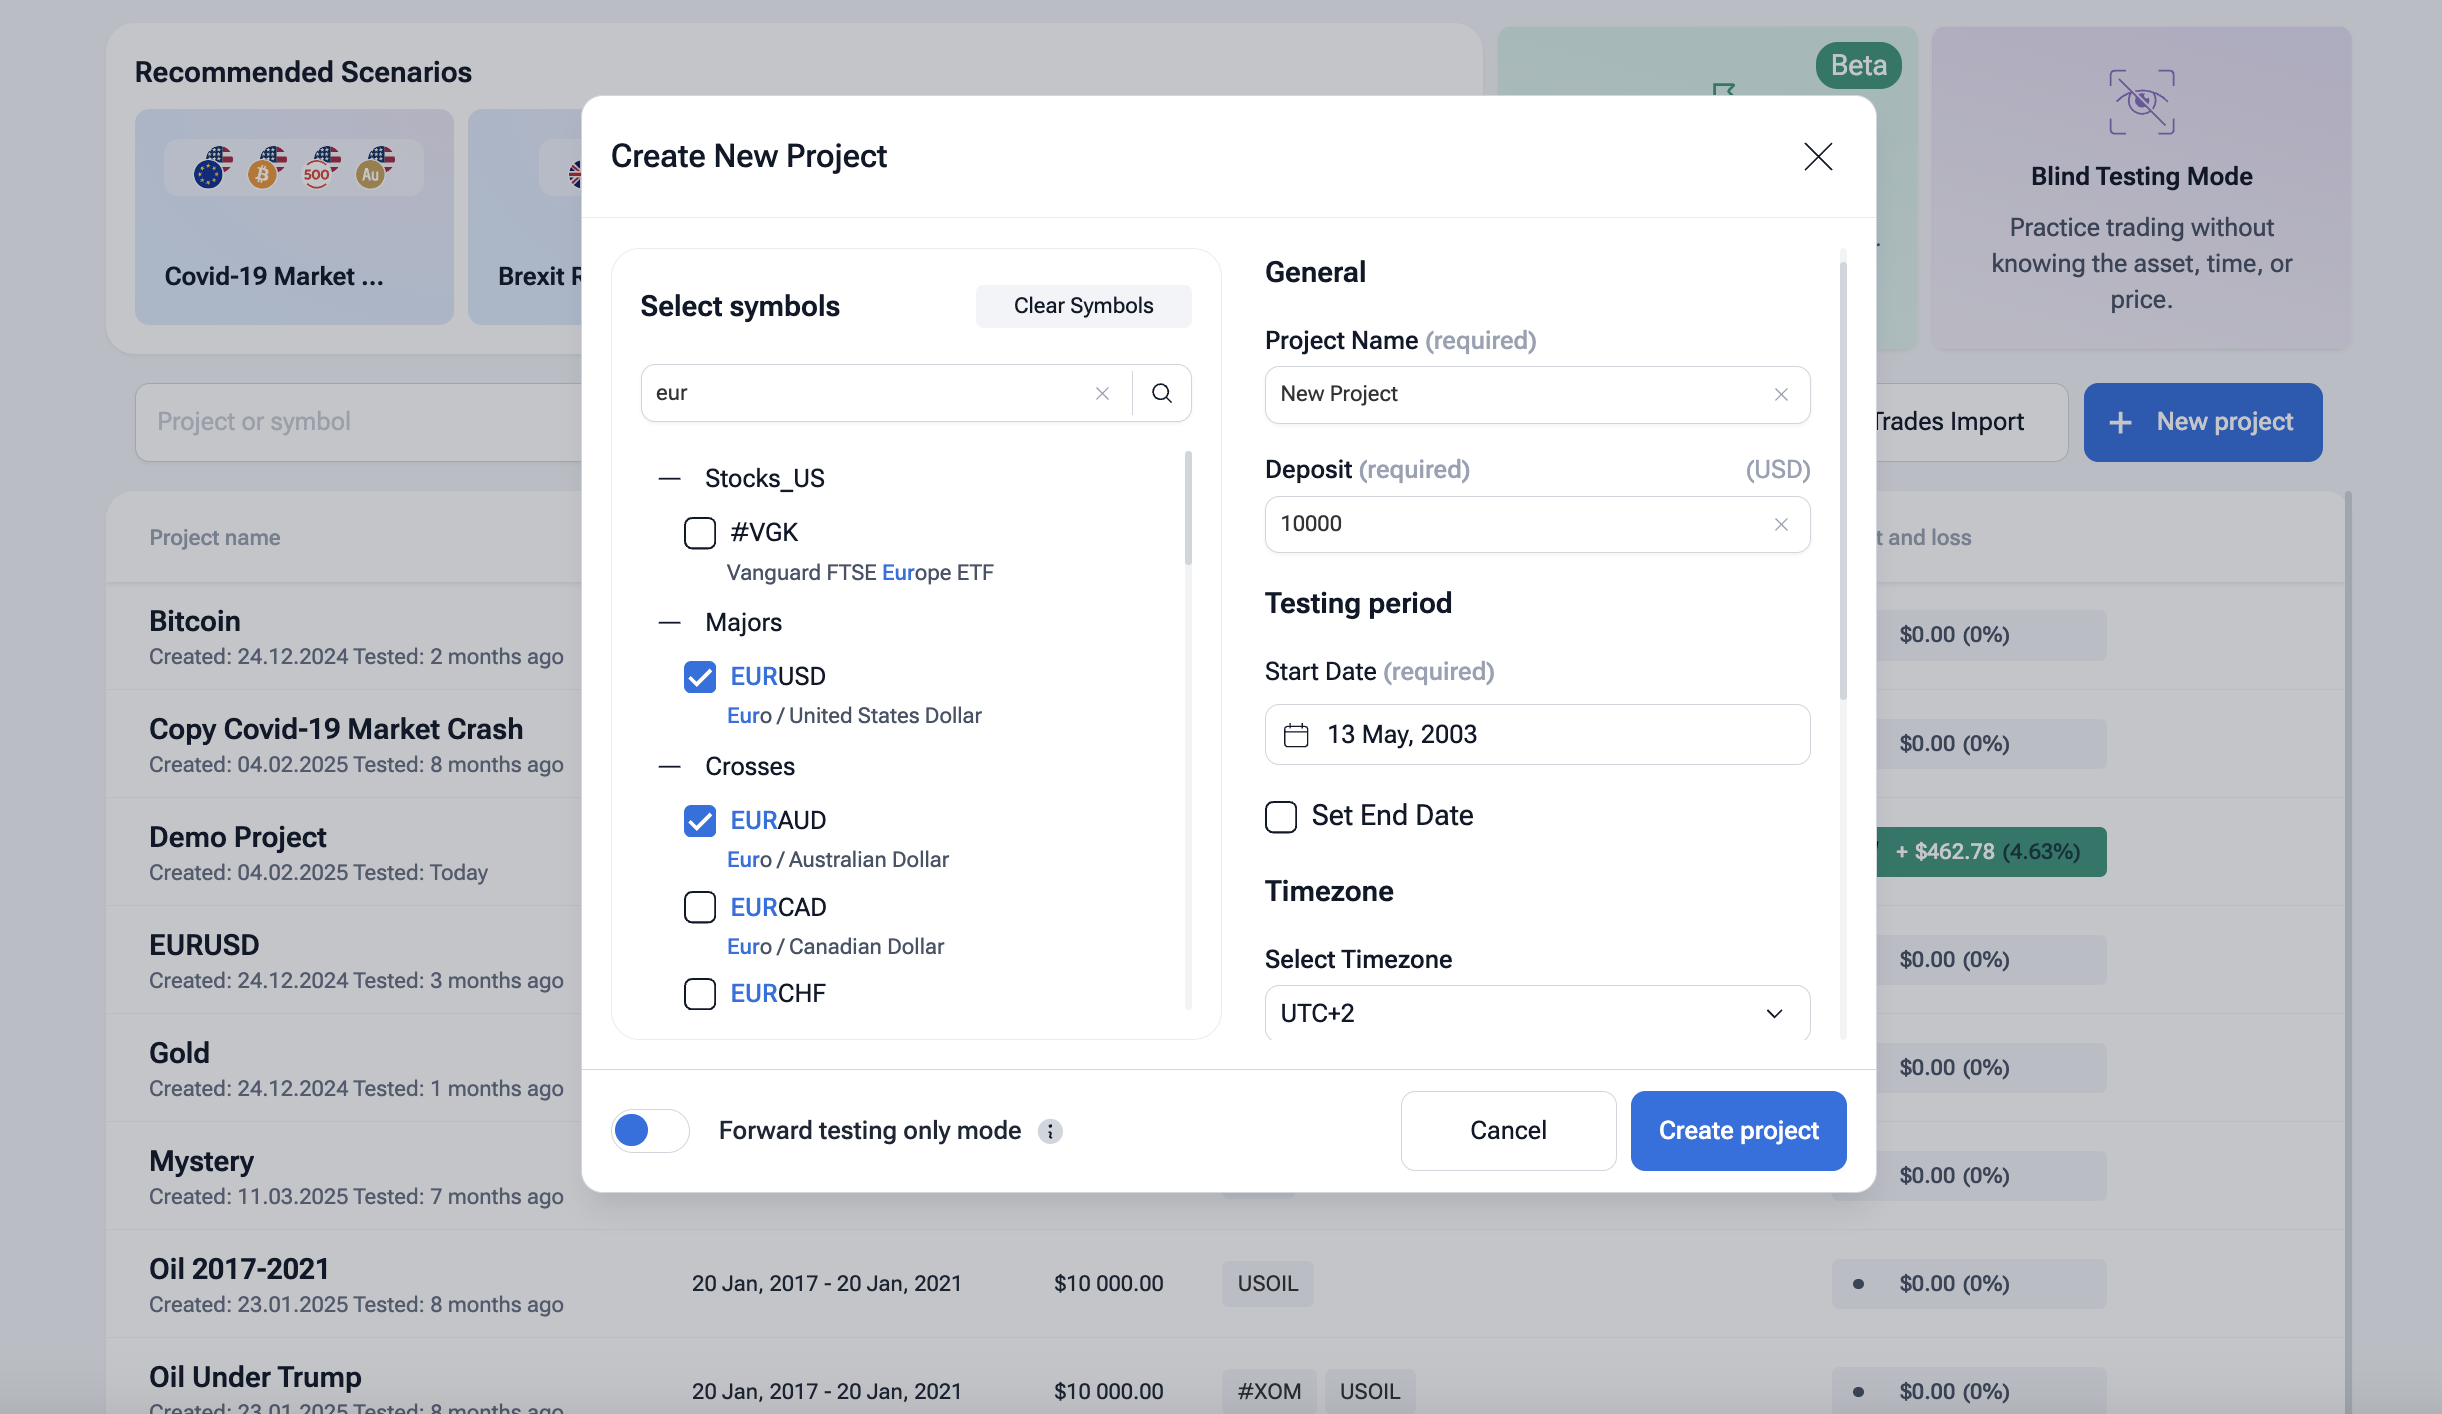
2) Create Project. Click + New Project, then select symbol(s), dates, time zone, virtual deposit. Turn on floating spreads, commissions. If you want, you can turn on the “Blind testing mode” to hide symbols and dates to avoid bias.
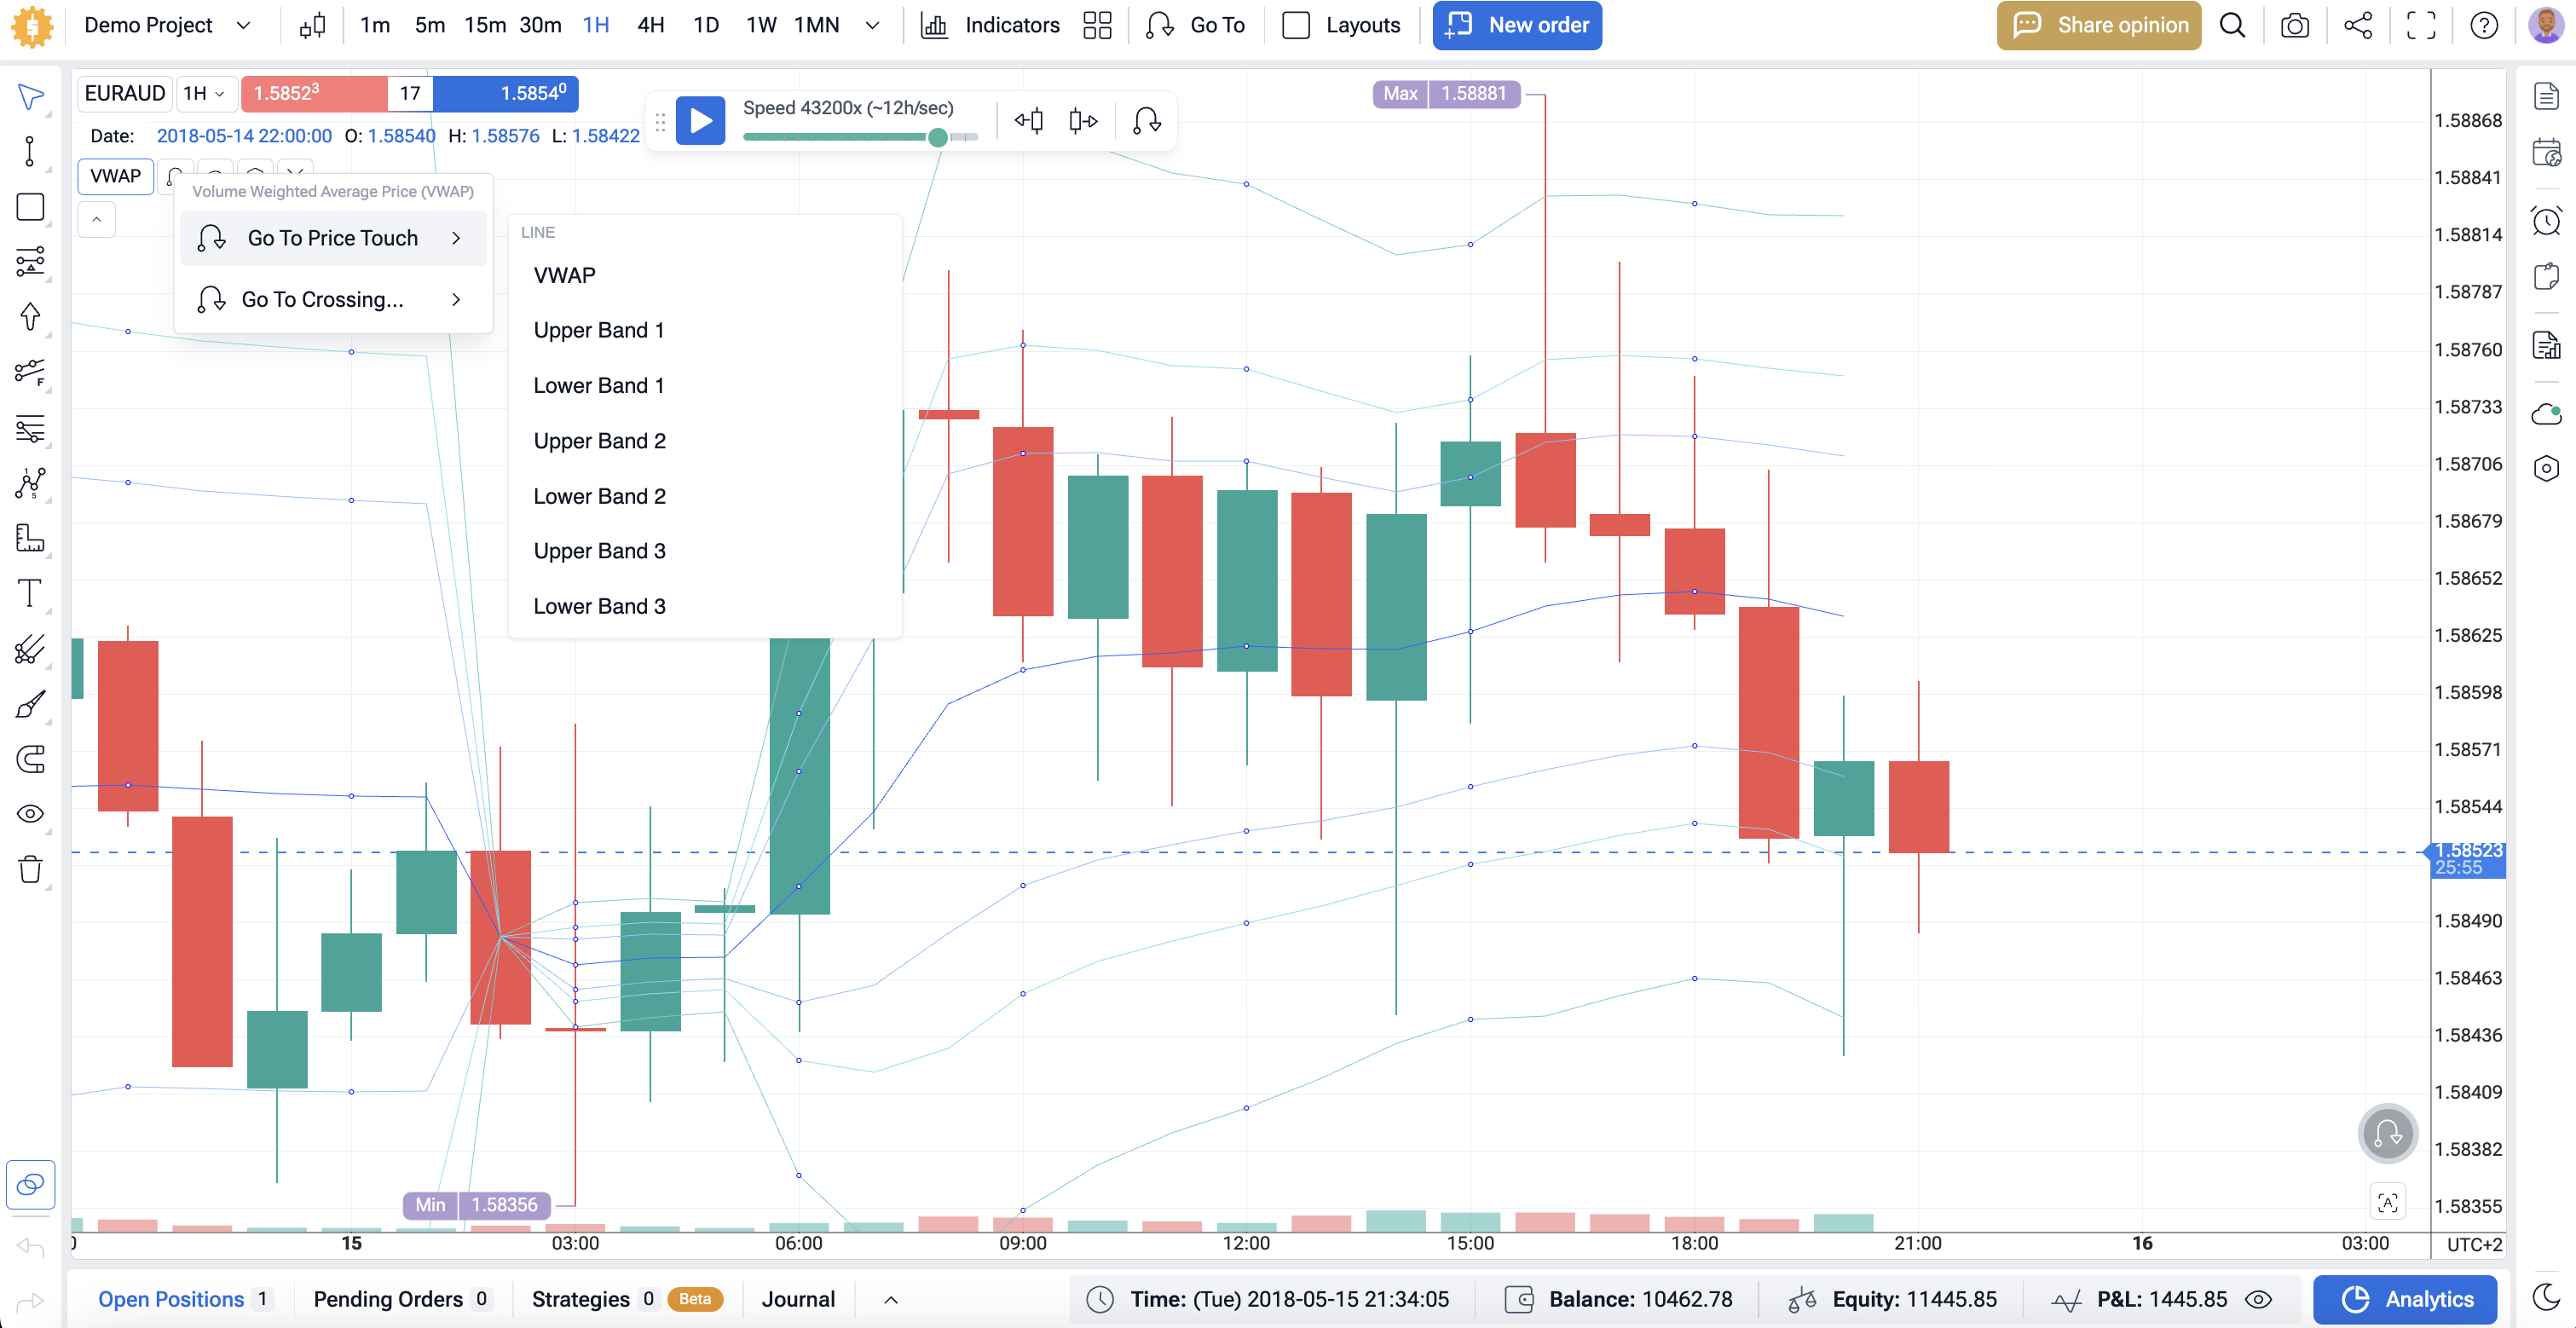
3) Load Rules. Add indicators or your script: entries, exits, stops/targets, position sizing. Save a template.
4) Run the Simulation. Press Start. Trades plot on the chart in real time. Use Jump To to fast-forward sessions.
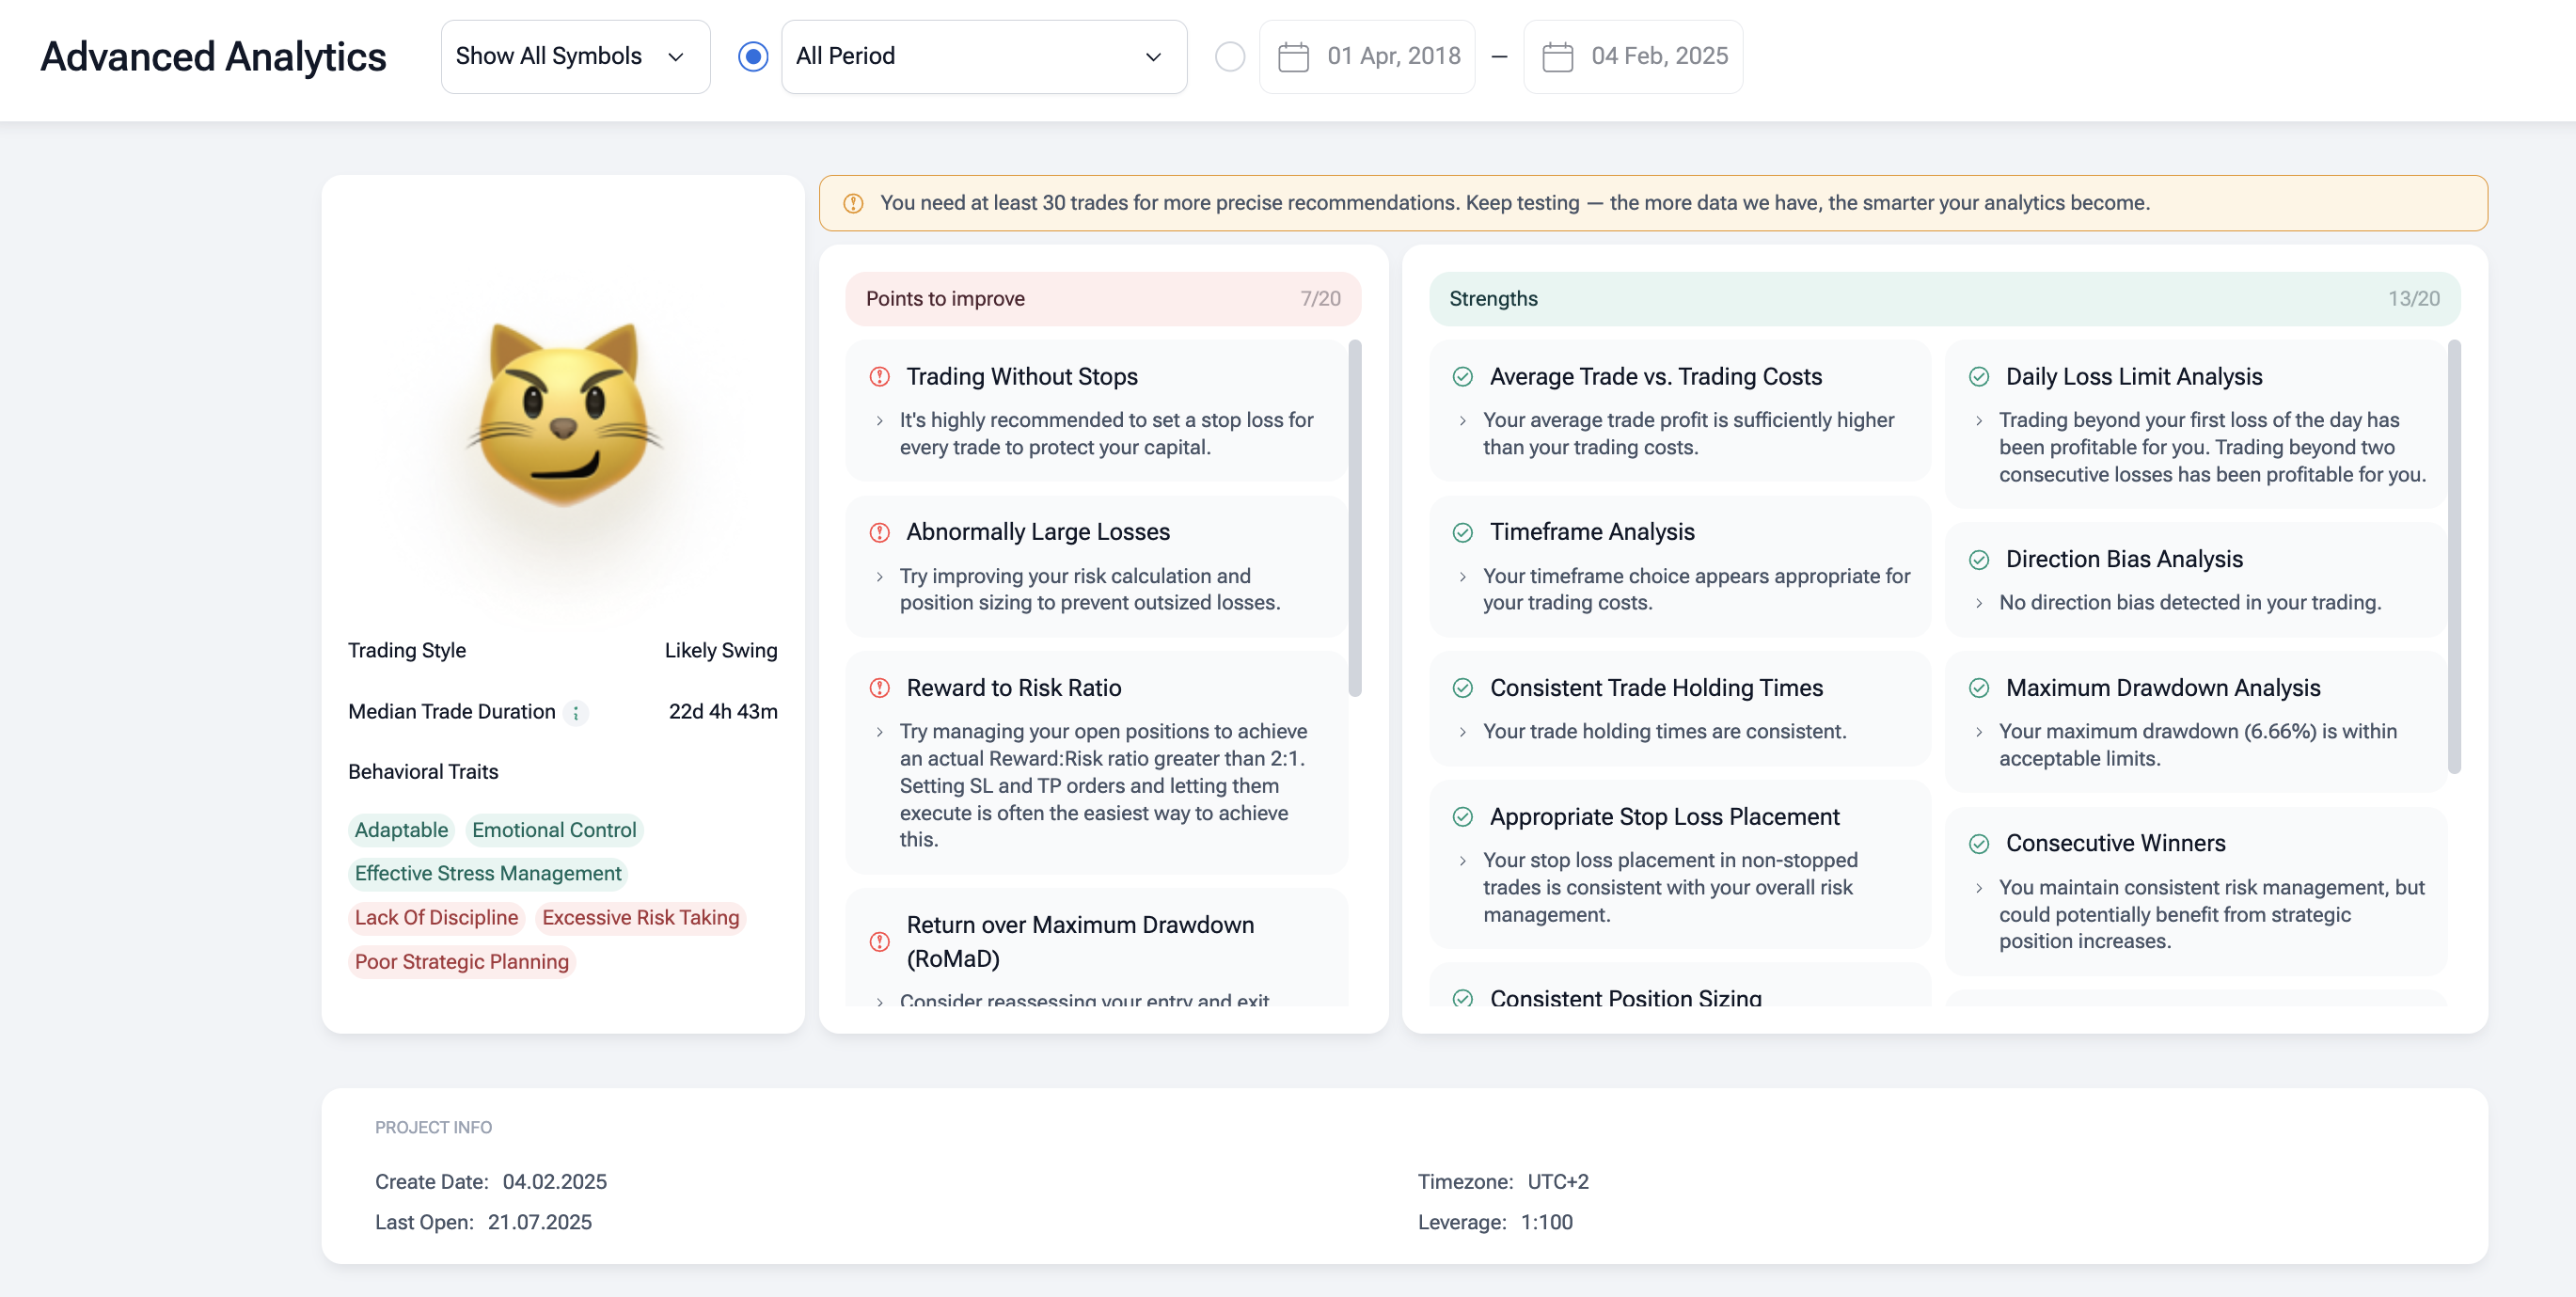
5) Review Analytics. Open Analytics: check win rate, profit factor, Sharpe ratio, equity curve, maximum drawdown, MAE/MFE. Export to CSV.
6) Validate if needed. Change one variable at a time (stops, targets, filters). Re-run on out-of-sample dates. Then forward testing on demo.
Key Backtesting Performance Metrics You Must Know
Take notes to run more reliable tests in the future.
Win and Loss Rate
Your win rate shows how often trades end in profit. The loss rate is what’s left. A high win rate doesn’t mean success if losses are much larger – always check both together.
Profit Factor and Expectancy
Profit factor = total profit ÷ total loss. Anything above 1.5 is usually decent. Expectancy shows average profit per trade after costs – it tells if the trading strategy is statistically sound.
Maximum Drawdown
Maximum drawdown measures the biggest equity drop during the test. Track both absolute (money) and relative (percent). It’s a key stress test of risk and stability.
Risk-Reward Ratio
Compares average gain to average loss. Many traders target at least 1.5:1 or 2:1. A strong risk-reward ratio can offset a lower win rate.
Sharpe and Sortino Ratios
Sharpe ratio compares returns to volatility; Sortino ratio focuses only on downside risk. Higher numbers mean smoother equity growth and better reward per risk unit.
Equity Curve and Trade Distribution
The equity curve shows how profit grows over time – smoother is better. Study trade distribution: consistent small wins beat a few lucky spikes.
What Are the Common Pitfalls When You Backtest Trading Strategies
How to avoid Bias:
- Overfitting. Adjusting rules too closely to past historical data makes results look perfect but fail live. Keep strategies simple, test on out-of-sample data, and use walk-forward optimization.
- Look-ahead bias / Data snooping. Using future information or testing repeatedly on the same data inflates success. Separate training, validation, and forward testing sets.
- Survivorship bias. Missing delisted stocks or failed assets gives fake optimism. Use full datasets with strong data quality.
- Ignoring costs and slippage. Skipping transaction costs, spreads, or execution delays distorts the profit factor. Always model slippage and fees.
- Small sample or limited market regimes. Testing only one market type or short period hides weaknesses. Include different market regimes and volatility levels.
- Unrealistic testing setup. Use true drawdown, equity curve behavior, and realistic fills. Honest backtests beat perfect ones every time.
Choosing the Right Backtesting Tools and Platforms
| Feature | Forex Tester Online (FTO) | MetaTrader 5 | TradingView |
|---|---|---|---|
| Manual Backtesting | ✅ Full chart replay, step-by-step control, “Mystery Mode” for unbiased testing | ⚙️ Basic bar replay (via plug-ins or scripts) | ✅ Built-in Bar Replay mode |
| Automated Backtesting | ✅ Automations & custom EAs; supports hybrid manual + algorithmic systems | ✅ Advanced Strategy Tester with optimization | ✅ Pine Script® strategy tester for simple automation |
| Data Quality | 🔹 Tick-level (Pro plan) or minute (Starter); 20+ years of historical data | ⚙️ Depends on broker feed; synthetic ticks common | 🔹 Bar data (up to 40K bars); tick-by-tick with Ultimate plan |
| Asset Coverage | 💱 Forex, stocks, commodities, indices, crypto (727+ assets) | 💱 Multi-market via connected broker (forex, futures, CFDs) | 🌍 3.5M+ instruments (stocks, ETFs, forex, crypto, options) |
| Ease of Use | ✅ User-friendly interface; quick trading simulation setup | ⚙️ Technical; requires broker link & setup | ✅ Intuitive, browser-based, great visuals |
| Programming Support | 🧩 Custom EAs, indicators, and automations; CSV export | 💻 Full MQL5 IDE and strategy marketplace | 💡 Pine Script® (v5) with public and invite-only scripts |
| Performance Metrics | 📊 Full analytics: win rate, profit factor, Sharpe ratio, drawdown, equity curve, MAE/MFE | 📊 Detailed broker-linked results; supports walk-forward optimization | 📊 Basic stats (net profit, win rate, drawdown); less detailed |
| Backtesting Type | ✅ Manual, semi-automated, automated | ✅ Automated with visual report | ✅ Primarily manual or semi-automated |
| Cost | 💵Check up-to-date prices here | 💵 Usually free via brokers; institutional license ~$4,000/mo | 💵 $199.95/mo (annual billing); free trial available |
| Best For | Traders focused on accurate strategy optimization, risk-reward ratio, and realistic backtesting | EA developers and broker-connected traders testing transaction costs | Multi-asset charting, fast idea testing, backtesting examples/case studies |
| Pros | ✅ Tick-level precision, full analytics, automations, blind mode, no broker dependency | ✅ Deep algorithmic testing, broker execution realism, optimization tools | ✅ Multi-asset access, social code sharing, easy scripting |
| Cons | ❌ No direct live trading; limited to backtesting environment | ❌ Data and latency vary by broker; manual replay is basic | ❌ Limited historical data depth and slippage modeling |
Summary:
- Use FTO for the most realistic and controlled backtesting on forex and multi-asset systems.
- Use MetaTrader 5 for automated backtesting and forward testing tied to broker execution.
- Use TradingView for visual idea testing, quick trading strategy validation, and sharing backtesting results.
Backtesting Across Different Markets: Forex, Stocks, Crypto, and More
Universal rule: the backtesting workflow stays the same – rules + historical data + stats – yet settings must fit each market’s volatility, liquidity, and hours.
- Forex: 24/5, deep liquidity, session effects. Use tick or minute data, model spreads, news windows, and swaps. Watch drawdown during thin Asian hours.
- Stocks: RTH vs. pre/post-market. Corporate events matter. Include gaps, dividends, halts; daily or intraday with high-frequency data if needed. Commission structures can shift the profit factor.
- Crypto: 24/7, higher volatility, variable liquidity across venues. Shorter lookbacks, tighter risk, exchange-specific fees; beware data outages.
- Commodities/Indices: rollover rules, contract months, and funding costs. Test seasonality and macro events.
No matter what assets you trade, do validation with out-of-sample testing and small forward testing.
Beyond Backtest: Validation and Forward Testing for Robust Strategies
Backtesting is only the first filter. To build confidence in your trading strategy, you need to prove it outside the test data – in real or simulated markets.
Out-of-Sample & Walk-Forward
After fitting your rules on one dataset, test them on new out-of-sample data. Use walk-forward optimization – train, test, shift forward – to confirm stability across different market regimes.
Paper vs. Live Forward
Paper trading checks your logic in real time without risk. Forward testing on a small live account adds real execution, slippage, and transaction costs for true validation.
Monte Carlo & Stress Tests
Run Monte Carlo simulations to randomize trades and spot weak spots. Then stress-test your system through crashes and volatility spikes to measure drawdown and resilience.
Conclusion
Backtesting turns ideas into numbers; validation and forward testing tell you if those numbers hold up. Use Forex Tester Online to run clean simulations on quality historical data, read the stats, and refine fast. When the metrics stay solid, move to a small live test – then scale.
Forex Tester Online
Start backtesting your trading strategies for free using FTO
 ไทย
ไทย
 Tiếng Việt
 Polski
 Türkçe
 Nederlands
 Română
 한국어
한국어
 Svenska


