Though the WPR indicator (Williams%R or Williams Overbought/Oversold Index) bears a name of famous Larry Williams, this author is George Lane − the developer of the classical Stochastic oscillator.
For the first time the indicator is mentioned in the book «How I made one million dollars last year trading commodities» , where its anticipated signals of a turn are actively advertised (promoted).
The indicator is effective on all types of the markets and will be useful for the trader with any experience.
So let’s begin.
Logic and purpose
The indicator WPR exploits the theoretical idea that price is an indicator of market equilibrium at a given moment in time.
The highest price for a period characterizes the maximum strength of buyers, the minimum price, respectively, the maximum strength of sellers. The closing price of the period will show which group of players (“bulls” or “bears”) was stronger, and how serious this «victory» was.
The Williams Percent Range compares each closing price with the last trading range, and evaluates the probability of one of two events: either the buyers will “stop” the price to the maximum of the range, or after all bears will be stronger and the market will be closed closer to the minimum price (see How To Use The Williams % Range).
If, with an obvious upward trend, the closing price is far from the maximum, then the buyers’ positions are weakened, and this fact can be regarded as a signal for sale. The market is overbought, the indicator Williams%R is on a maximum (in the zero zone). If on a downward trend sellers could not close the market in the minimum zone, then it is worth looking for opportunities for purchase. The market is oversold, the indicator value is minimal − in the zone (-100). The weaker the overall price dynamics, the closer the indicator line to the center line.
Calculation procedure
The indicator Williams Percent Range analyzes the Close/Open prices (similar to Stochastic), but gives a more accurate estimate of the actual average, and is therefore considered more accurate (see WPR Indicator ).
%R=((PriceHight(n)- PriceClose(n))/(PriceHight(n)- PriceLow(n) ))×(-100)
where:
PriceHigh − the maximum price for the analysis period;
PriceLow − the maximum price for the analysis period;
PriceClose − the last closing price;
N− is the analysis period (in bars).
The indicator WPR shows the level of the current price of closing relative to the market equilibrium (max/min). Not to lose meaning of critical zones, values are (as a percentage) displayed in the range from 0% to (-100%) – the «return scale». Smoothing of values isn’t applied, minus before data doesn’t influence result of the analysis in any way. Overbought zone (from above) is from 0 to (-20), oversold zone (below) − from (-80) to (-100).
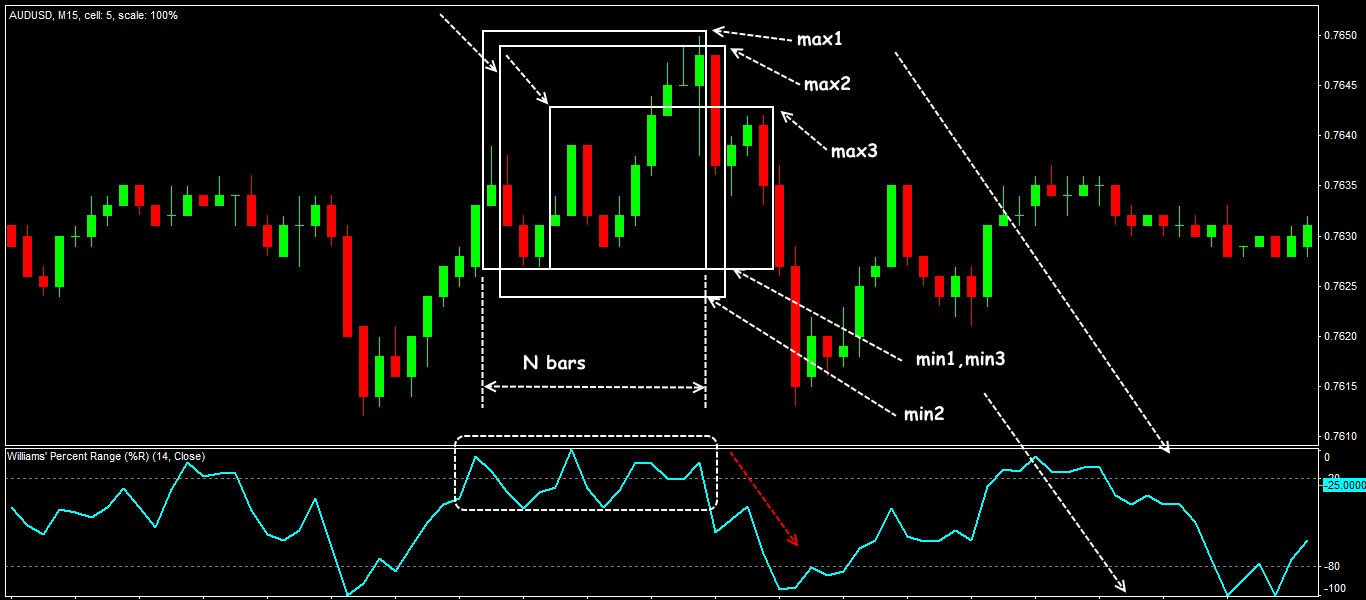
Scheme of formation of WPR values
To calculate indicator values:
- we make the analysis of the period of N bars in size − a certain price window as a result forms;
- we make the analysis of the period of N bars in size − a certain price window as a result forms;
- the lower bound – minimum price – corresponds to level (-100).
Opening of new bar leads to change of max/min values of already new range, but levels 0 and (-100) in a window of the indicator remain the same. As a result, the indicator line performs a turn much earlier than the real price turn.
Parameters and control
The indicator Williams Percent Range is a dynamic line in the range (0; -100) and is located in the additional window below the price chart. In the settings there are only the calculation period, the price type, the levels for the critical zones and the standard color scheme.
The calculation parameter can be any, depending on the individual characteristics of the trading asset and the personal preferences of the trader.
Standard value is 14, which ensures stable functioning of the indicator for the periods above M15, is considered an optimum indicator.
Reducing the period will make the indicator line more «nervous» and provide you with more signals, but as a result, many of them will be «false» − a strong reversal of the price does not occur. Accordingly, increasing the parameter will cause fewer signals, but their quality will improve significantly.
Nevertheless, Larry Williams recommends using a 10-day period and defines the boundaries of overbought/ oversold zones at the levels (-90) and (-10). On timeframes W1 and above, the WPR line usually changes its direction a week before it happens to the popular MACD histogram. As a result, traders preferring medium-term trade, have time or close transactions, or adjust (at least!) Stop Loss/Take Profit levels.
The interpretation of trading signals of the indicator is traditional for oscillators.
Let’s look at it in detail.
Trade signals of the indicator
The basic conditions for a transaction are determined by the behavior of the indicator Williams Percent Range in critical areas. (see Trading with the Williams %R Oscillator).
Traditionally, we offer three options:
Trend reversal signals
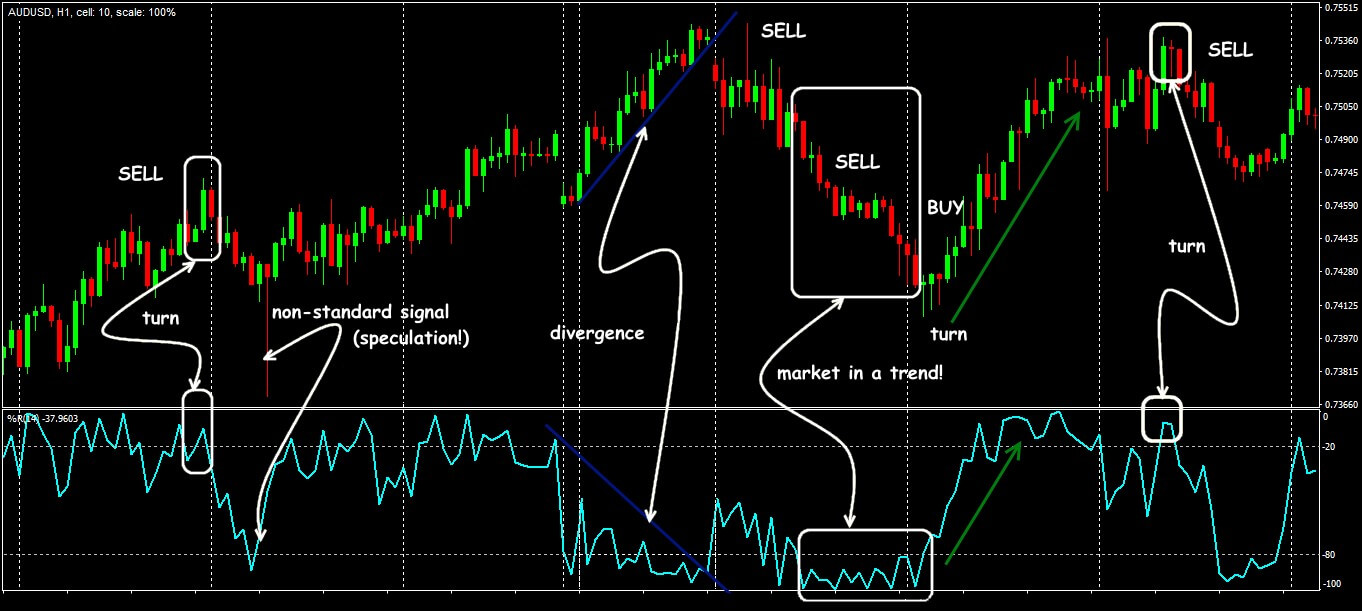
As a rule, the WPR line’s exit from the overbought/oversold zone outpaces the real price turn for 1-3 periods.
We remind you that the first entry of the line into the critical zone is not a trade signal − it is necessary for the line to turn and cross the zone boundary in the opposite direction, that is:
- to open a long position (purchase), the line need to cross the oversold border (-80) from bottom to up.
- for a short position (sale) − crossing the overbought (-20) border from top to bottom.
Scheme of signals of the WPR indicator
Signals of an input on a rollback of a trend
One of methods of use Williams%R can be definition of the main trend, and then − search of trade opportunities in its direction. Most precisely the indicator shows not primary point of entry, namely a signal for replenishment to the strong movement (on a trend after corrections).
It is necessary that the line of the indicator was:
- for BUY − in a zone (-80;-100) on a strong bull trend;
- for SELL − in a zone (0;-20) on a strong downtrend.
Divergence
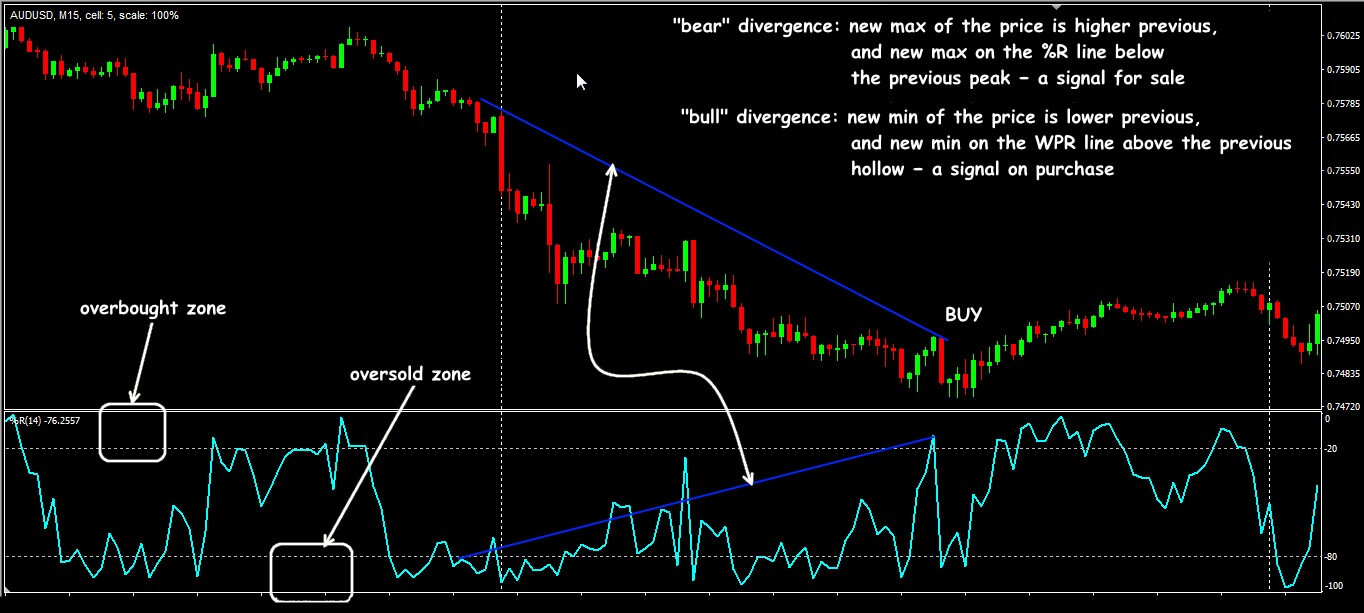
Situations of divergence of the Williams Percent Range with the direction of prices arise relatively rarely, (for their formation a rather long period is needed), nevertheless, they are considered to be the strongest trading signal.
While the indicator moves in a critical zone − the transaction can be not closed.
Trading scheme divergence Williams%R
Application in trade strategy
The indicator is the most effective for finding turning points complemented with the classical trend tools.
For example, WPR signals successfully outperform the trading signals on the standard Bollinger Bands (20), which allows you to prepare for the opening of the transaction (including direction!), and also to close it in time.
Here you can see another example of a successful strategy Trading with WPR and SMA(100).
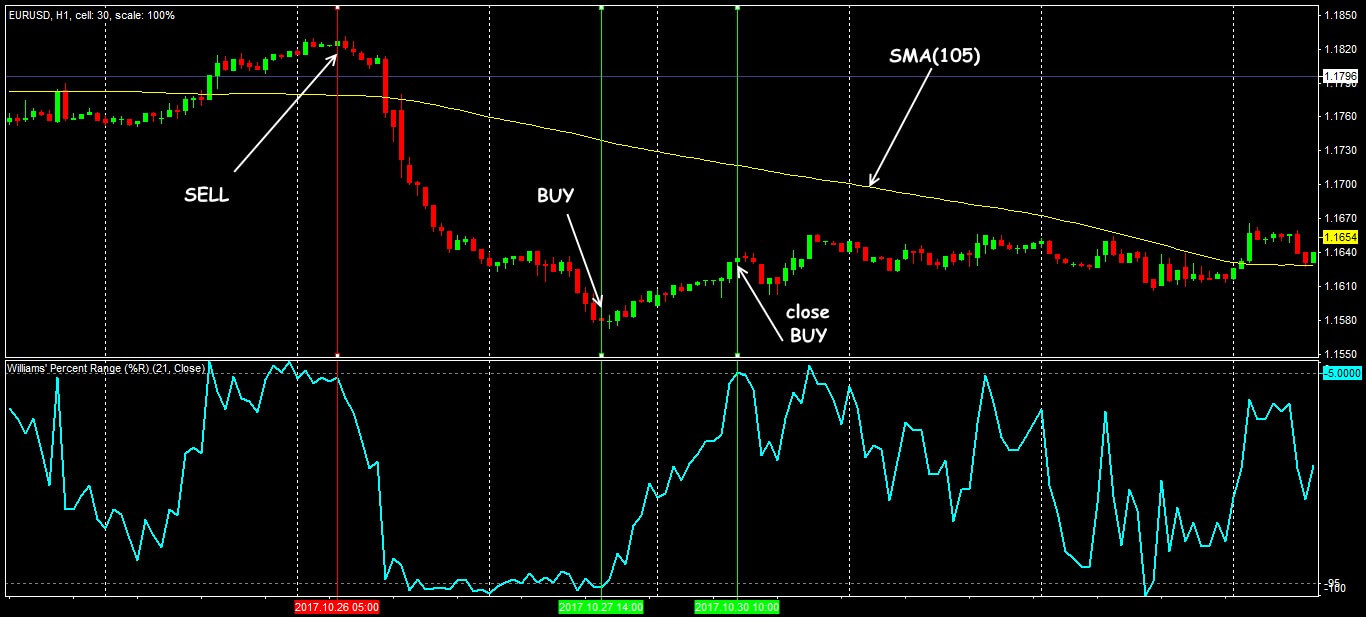
imilarly, effective can be a strategy with a moving average (we need a simple one with a period of 105) and WPR (21) with levels (-95) and (-5). While the price is higher than the SMA (105) − only buy, if the price is lower − only sell. The result
WPR allows to select the strongest points of entry: we open the transaction after his line is included into critical zones.
Scheme of trade signals Williams%R+SMA
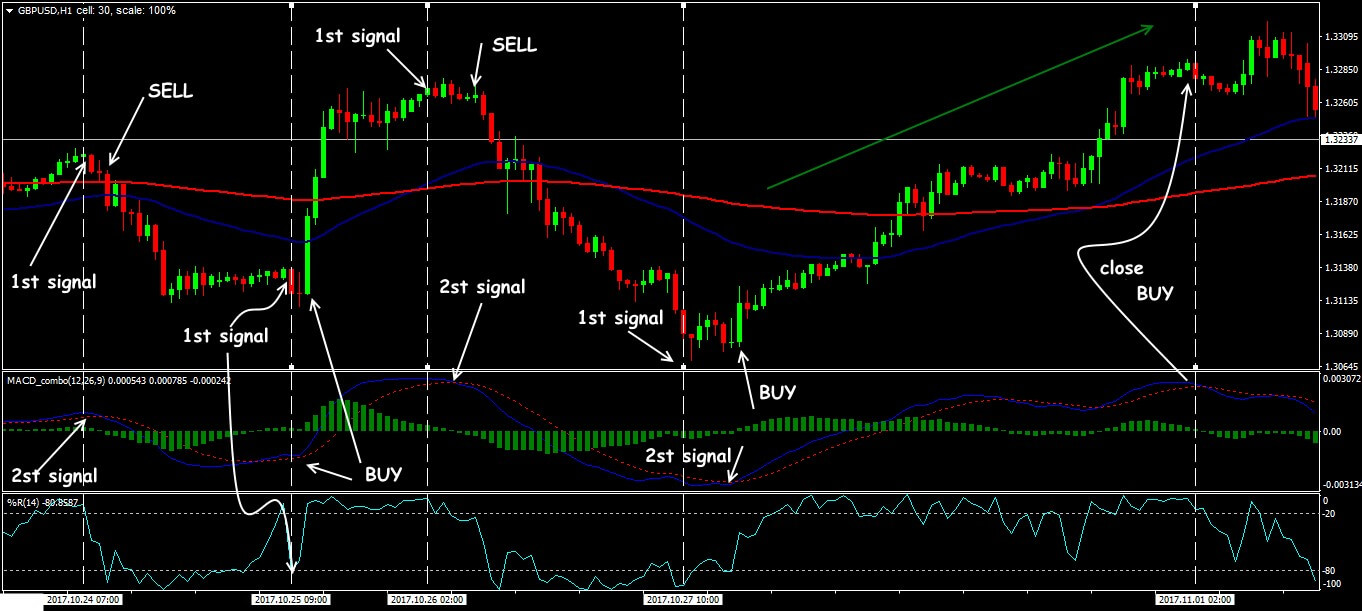
It is possible to combine the WPR indicator with other oscillators − for confirmation of signals, but additional «compatibility» tests in that case can be necessary. For example, the set from couple of moving averages of SMA(50)+SMA(200), MACD_combo and standard WPR(14) gives sure signals on popular currency pairs.
Scheme of trade signals Williams%R+SMA+MACD
Several practical remarks
WPR (or the Williams index) stably confirms the trends, but the modern speculative market proves that the advanced characteristics of the indicator are greatly exaggerated.
What this means is:
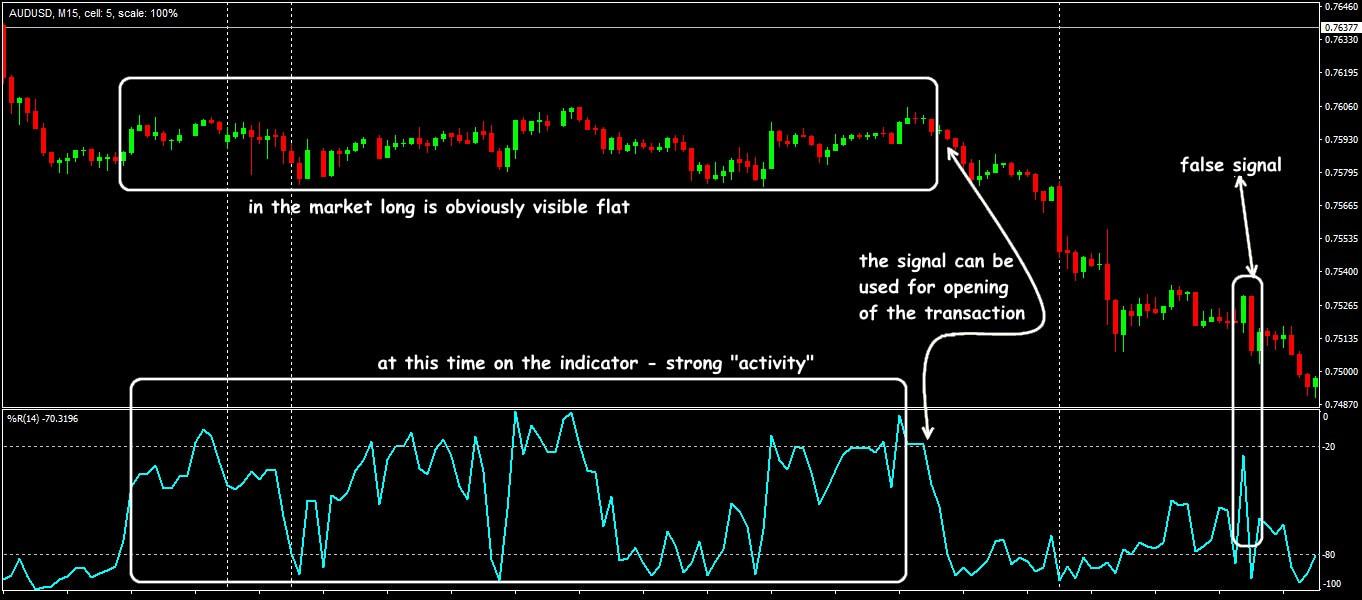
The oscillator does not differ from standard technical analysis tools, and «sick» from the same shortcomings: instant reaction to price fluctuations, the mass of «false» signals during periods of non-standard or the flat market.
Non-standard situation with indicator Williams%R
Sometimes too active dynamics of the WPR indicator is misleading, so the trader should clearly understand the current state of the market. Of course, if you initially correctly defined the direction, then WPR may will be effective as part of complex trading systems as a pulse filter.
Try It Yourself
After all the sides of the indicator were revealed, it is right the time for you to try either it will become your tool #1 for trading.
In order to try the indicator performance alone or in the combination with other ones, you can use Forex Tester with the historical data that comes along with the program.
Simply get Forex Tester Online. In addition, you will receive 23 years of free historical data (easily downloadable straight from the software). Click the button below.
 Develop Williams Percent Range Trading Strategy
 ไทย
ไทย
 Tiếng Việt
 Polski
 Türkçe
 Nederlands
 Română
 한국어
한국어
 Svenska
