The first information about the indicator of the relative strength appeared in the article of the Commodities magazine in June 1978 − indicator was developed for the stock market and was another attempt to determine the strength of the market and the likelihood of the trend change.
RSI became widely known after the publication of the famous book New Concepts in Technical Trading Systems.
The indicator is so popular because of a simple calculation mechanism and accuracy of the signal interpretation. The point is that RSI shows the ratio (in%) of «bullish» and «bearish» bars for a certain period, and thus helps the trader determine the state of market, namely, is it overbought or resold.
So let’s begin.
Logic and purpose
The author of the indicator J. Welles Wilder believes that there are two problems of analyzing the rate of price movement. These are:
- Chaotic − the dynamic range of prices for the period. This means that the speculative growth or decline that occurred, for example, 10 days ago, can cause a reversal of the current market, even if the current prices preserve external calm. Conclusion: the price line must be smoothed.
- The need for constant price indicators for qualitative comparative analysis. Conclusion: we need a vertical scale with constant upper and lower bounds of oscillations.
The RSI indicator solves these problems using the concept of the positive and negative price changes. It’s simple: a trading day (or another settlement period) is considered to be upward, if the price is higher than yesterday (positive difference) and downward, if the price has decreased relative to the previous period (negative difference).
Let’s see exactly how it works.
Calculation procedure
The algorithm is as follows. Firstly, we determine the type of the price change − positive (U) or negative (D):
current closing price is higher than n periods ago:

current closing price is lower than n periods ago:

If prices are equal, that is, U = 0 and D = 0, then the values of U and D are smoothed out with the help of the moving average, and then the Relative Strength value (or RS) is calculated.

And only now you can get the value of indicator:

You can use the price of any type, for example, SMA; the author generally preferred the «smoothed» moving average (SMMA). But don’t forget that the indicator was initially used in the stock market, which is less volatile, and as for the Forex assets, exponential smoothing is considered optimal.
In addition, the calculation mechanism allows the construction of the RSI line on the data of another indicator. (see here What is the Relative Strength Index).
Reminder: when calculating RS, it is necessary to take into account the situation when the denominator is equal to zero. This is possible, for example, when using SMA, when during the entire averaging period the price went only upwards and, accordingly, all values of the D indicator are equal to zero. In this case, the value of RSI is considered equal to 100.
Parameters and control
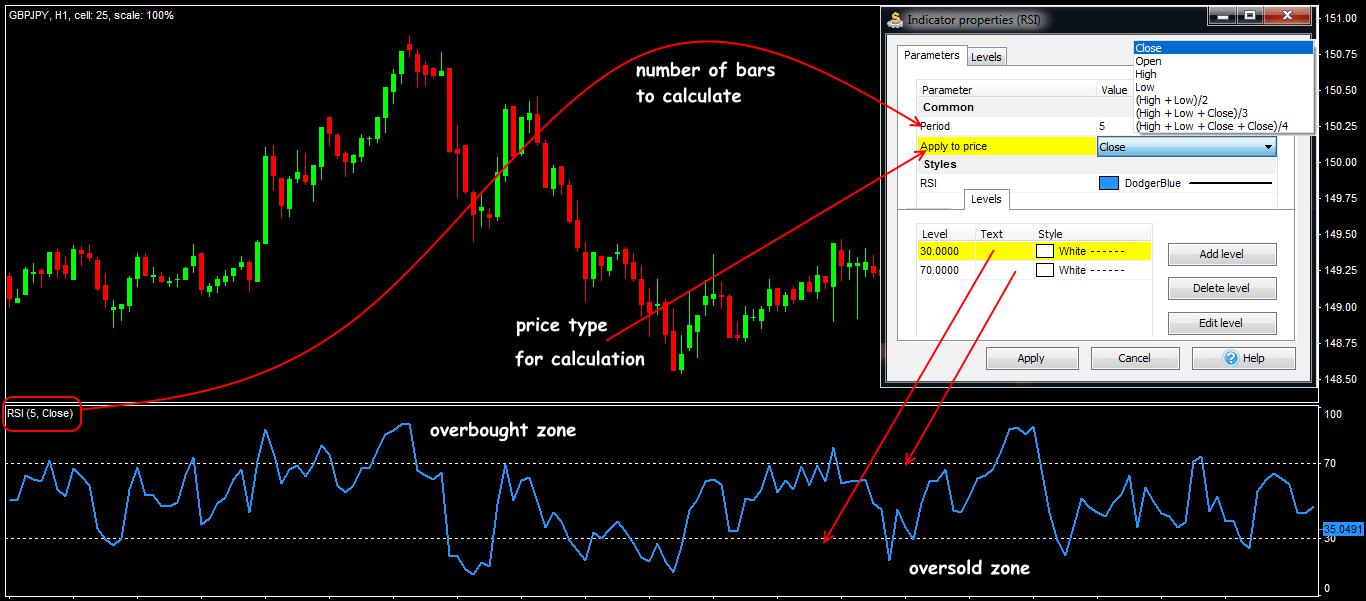
The Relative Strength Index is a typical oscillator, located in a separate window below the price chart and represents a dynamic curve with a range of values (0-100). In addition to the colour scheme, the period (number of bars) and the price type are selected.
The scale uses the boundaries of the critical overbought/oversold zones: standard options (80/20) are recommended on a strong trend; (70/30) − during the flat periods, and the (60/40) values are used much more rarely. Also, the central balance line is used at the level 50 (see RSI).
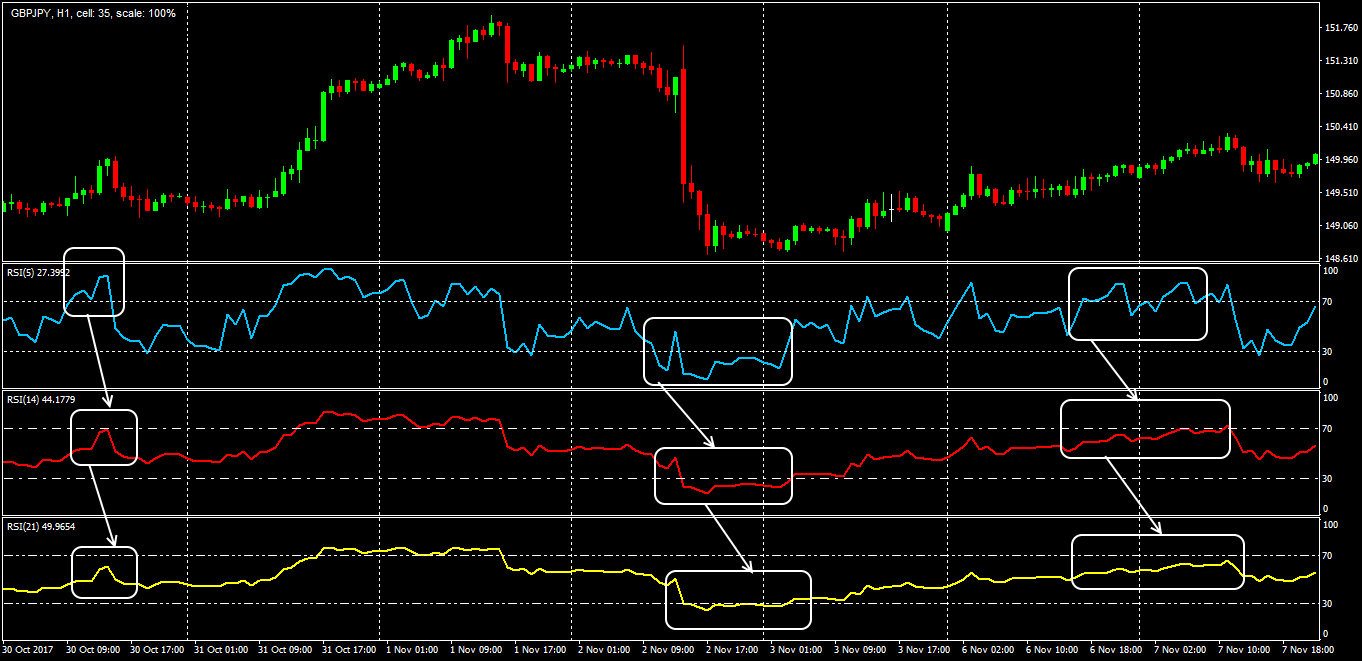
The indicator’s author used the calculation period of two weeks, hence the default parameter value (14); that is, the daytime RSI will use data for 9 or 14 days; the weekly RSI – for 9 or 14 weeks, and the minute RSI − for 9 or 14 minutes. Now RSI (9) and RSI (25) are mostly used, but it is recommended to select the parameter depending on the working timeframe.
The smaller the calculation period, the more actively indicator will react to the price dynamics; for example, if you want to analyse the usage of the RSI signals on the D1 timeframe, then for a correct calculation, you need to estimate the data for 3 months. RSI (9) or RSI (14) are recommended for the intraday trading, and RSI (5) or RSI (7) – while working on the H1 timeframe.
You can use the 5% rule: determine visually the level so that the RSI line is located within the channel at least 5% of the total trading time. As soon as the basic price max / min are displayed by the indicator in the critical zone − the optimal period is found.
Let’s look at it in detail:
Trade signals of the indicator
RSI offers a standard set of oscillator signals; the line points in the critical zones and in the balance area are considered optimal. So …
- Breakdown of the overbought/oversold zone
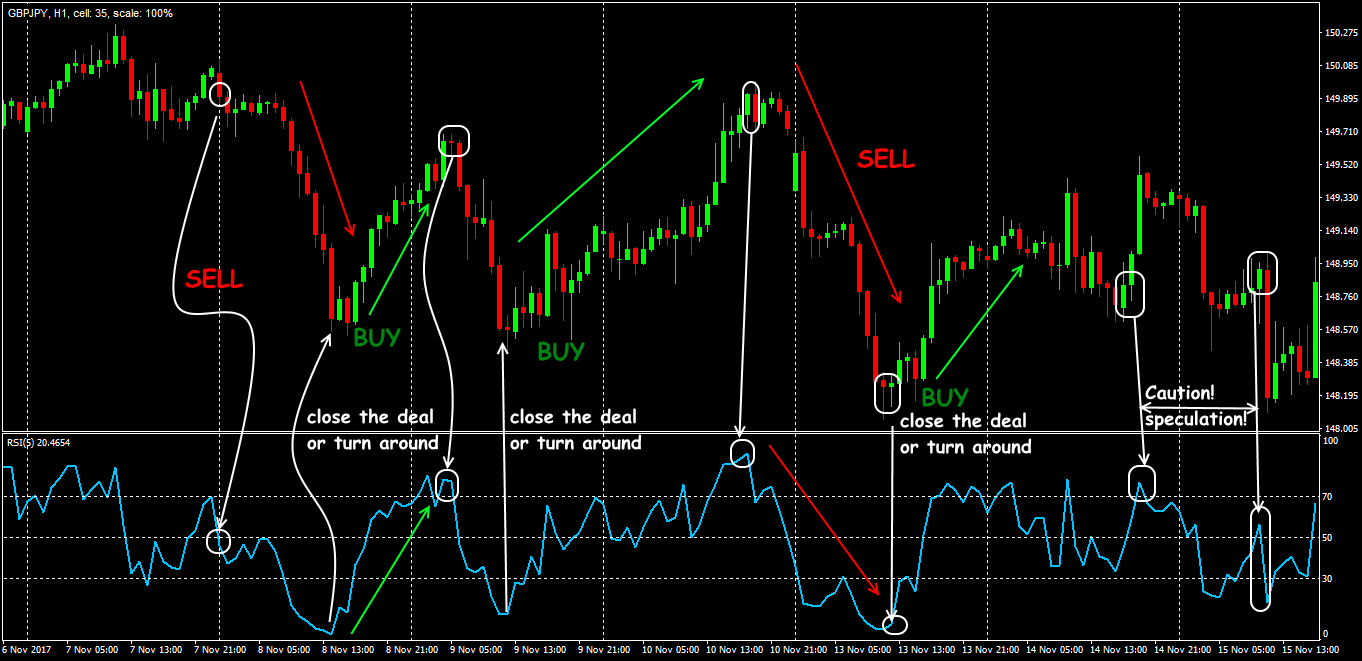
The indicator is the most effective as a market filter: you shouldn’t buy when the market is overbought (RSI is above the upper limit) and shouldn’t sold when the market is oversold (RSI is behind the lower level).
We open SELL if the line makes a turn from up to down from the overbought zone (above the 80/70/60 levels), and we open BUY when it is the bottom-up turn from the oversold zone (below the level of 20/30/40). The signal to close a position (or to move Stop Loss closer to the price) is a reverse turn from the opposite critical zone.
Reminder: such signals are valid only in the direction of the main trend.
Of course, the usual exit of the indicator line beyond the critical zone doesn’t mean that you need to open a deal immediately. The market can be in an overbought/oversold state for long enough. Of course, the oscillator warns of a trend change in advance, but it doesn’t say when exactly the price will make a turn.
- Breakdown of the central line (level 50)
Everything is as usual: breakdown of the line from bottom to top means a buy order, from top to bottom – sell order. Such situations work reliably only on the trend areas, during the flat periods there are too many false signals.
You can use this to analyse the main direction: on the uptrend, the RSI line should move above 50 (open only BUY!); if you think that the price is falling, then make sure that the RSI is less than 50 (only SELL).
Reminder: the market is often consolidated on the balance line, but in the active trend, the line is used as a strong resistance.
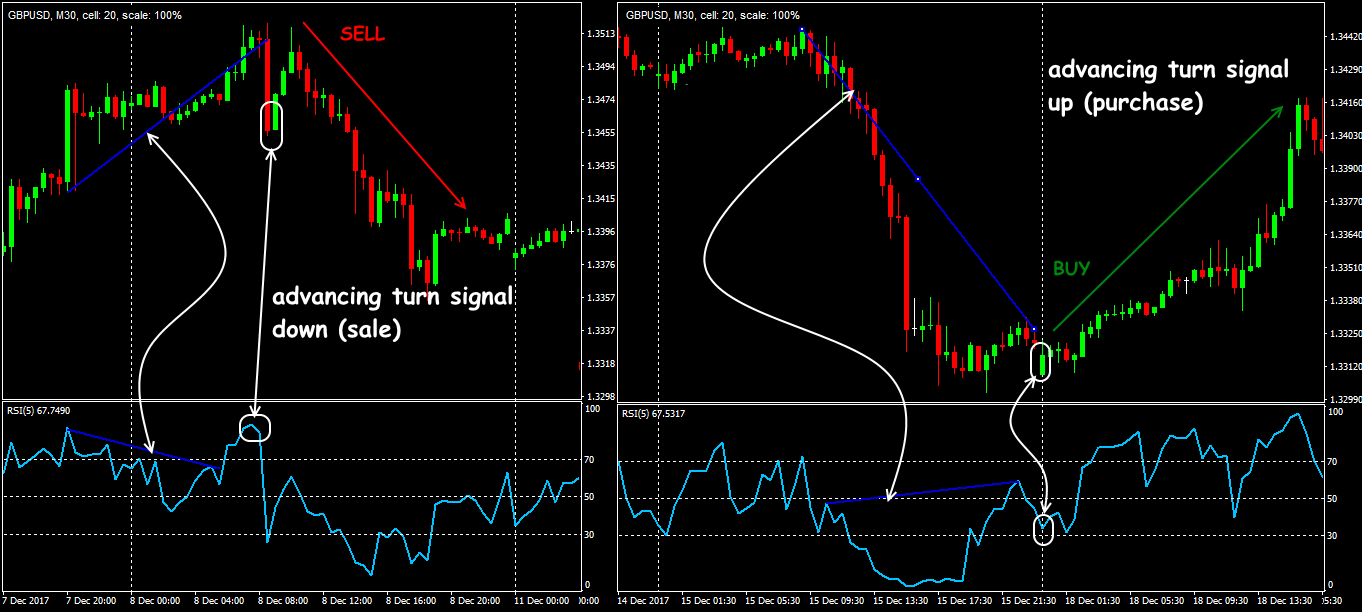
- Divergence
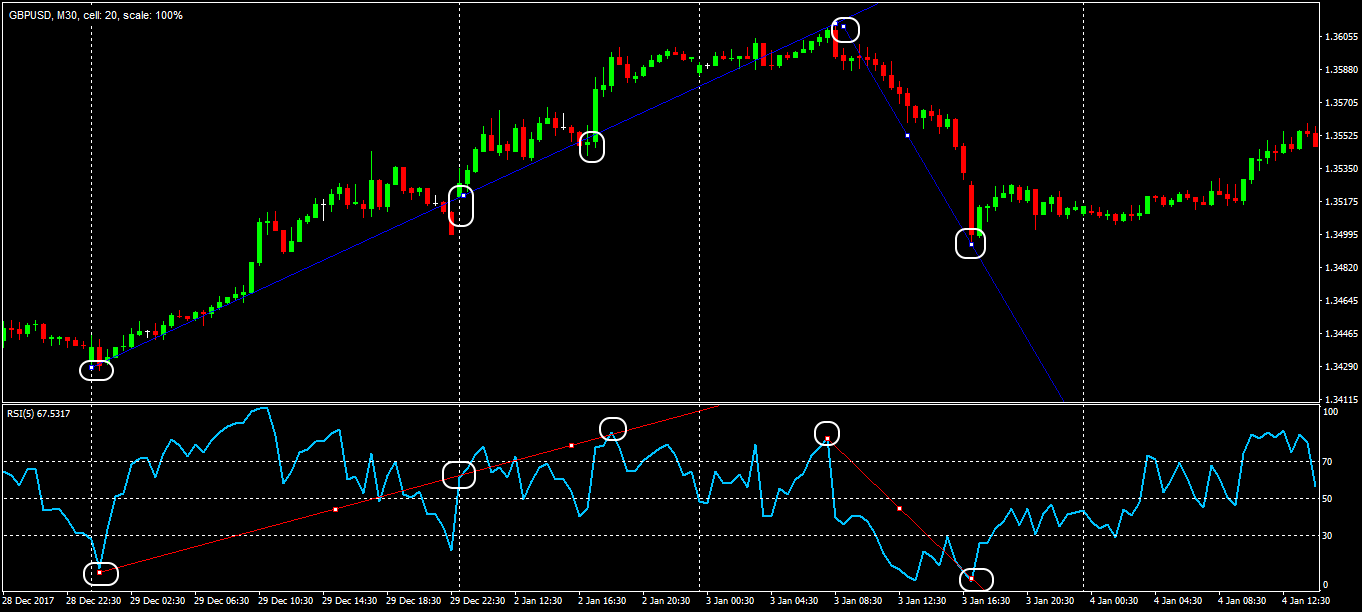
The author considered all kinds of divergence between the price and the oscillator line to be the strongest signal for RSI: we are waiting for a reversal or, at least, a strong correction.
But if the range between max/min divergences on the RSI chart is less than 7 or more than 50 periods, then it is not recommended to open deals.
Application in the trade strategies
The main task of RSI is to assess the mood of participants, the strength of the market in the current direction and to «catch» the moment of the turn in time.
What this means is:
in any system, the indicator performs analysis of the impulse price movements and the interpretation of its signals is analogous to any oscillator (also see Momentum And The Relative Strength Index).
We want to note only some characteristic features:
- Trend on the RSI line
You can use the classic graphic analysis − the trend lines on the RSI data show the trend more reliably, and, naturally, give a forward-looking signal of the turn.
- RSI and Moving Averages
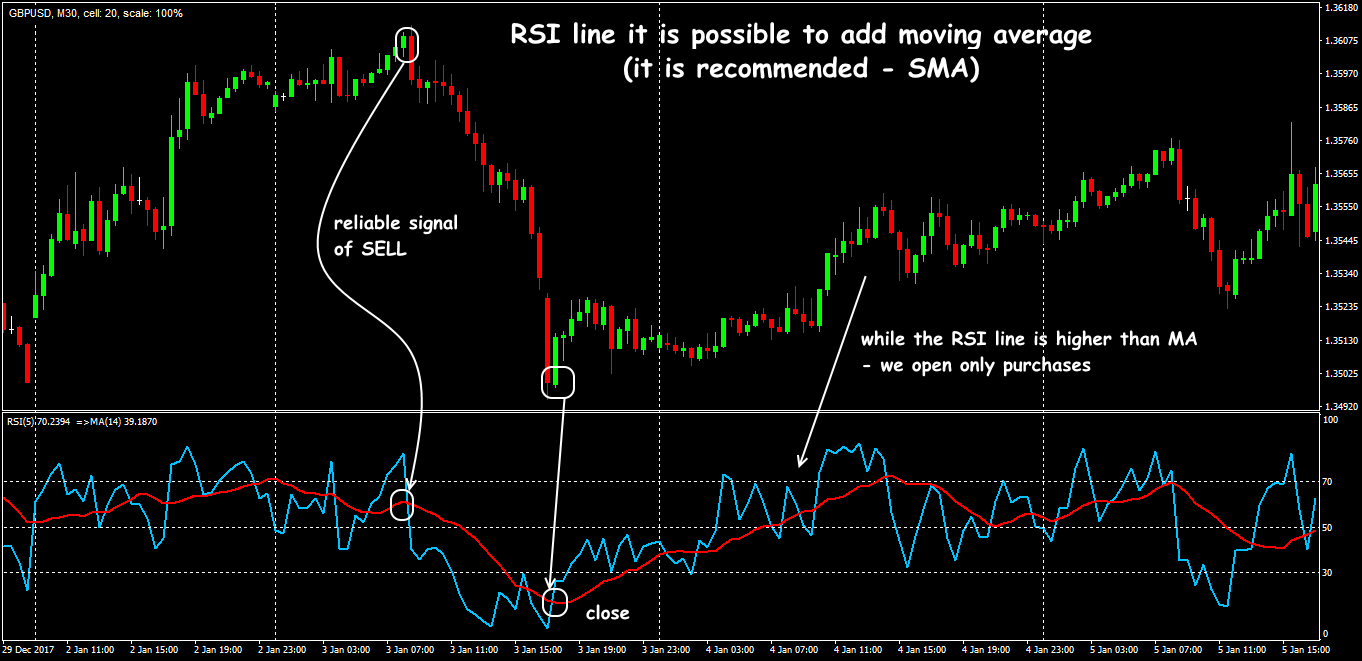
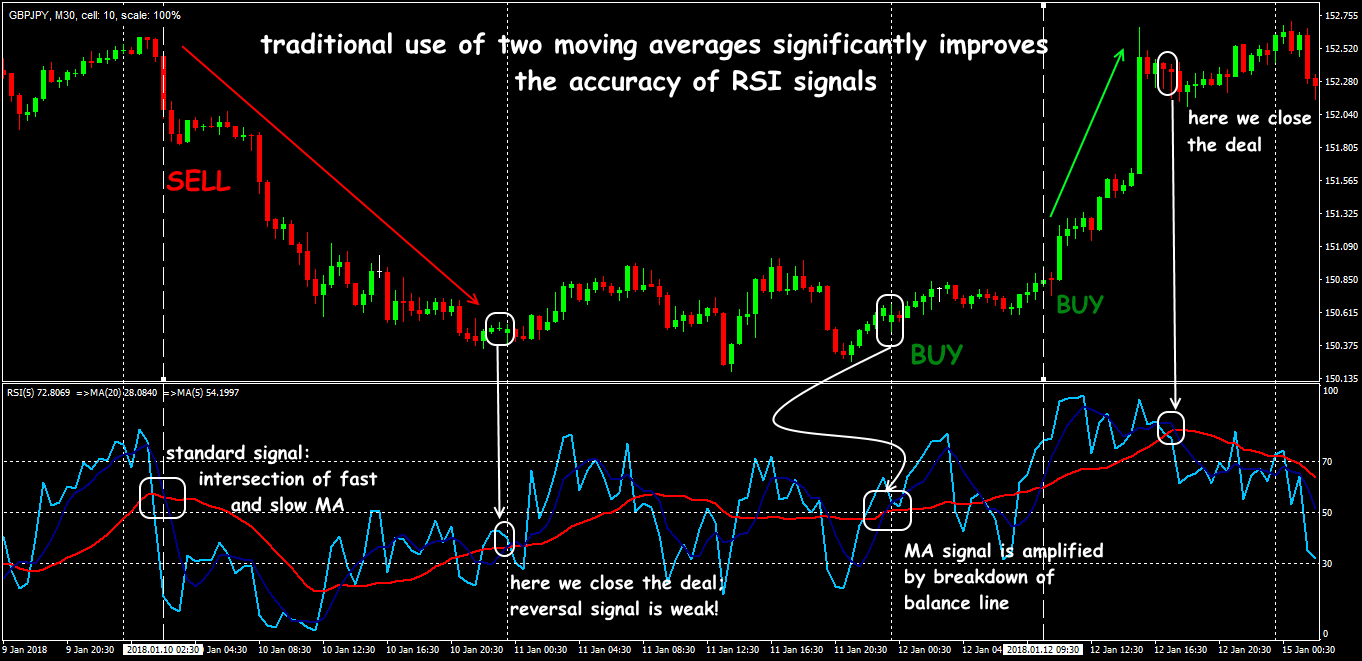
Using the RSI indicator with its own moving average improves the smoothing effect and makes the input signals more reliable.
The result?
Such MA works as a dynamic resistance − the movement of the main RSI line above/below the average line helps to analyse the overall trend correctly. In addition, it is possible to receive good signals at the intersection of the two moving averages constructed in according to the RSI data.
- Using channel indicators
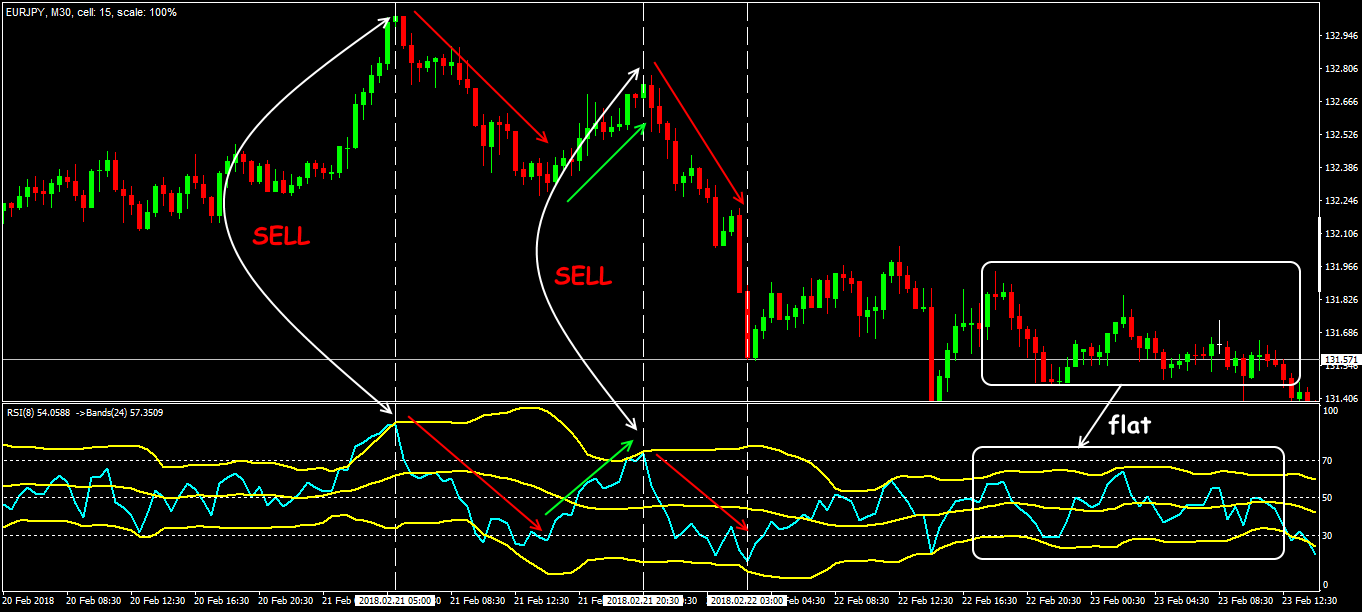
On RSI, you can build any channel indicator, for example, Bollinger Bands. In this case overbought/oversold levels become dynamic and move along with the oscillator line − this greatly simplifies the interpretation of signals (also see What is the StochRSI).
You can also use Envelopes, or, for example, the TMI indicator.
Several practical remarks
RSI works perfectly as a major oscillator in any complex trading strategy, however:
- In the speculative or thin market, the credibility of the RSI signals is significantly reduced.
- It is recommended to filter the RSI signals (for reliability!) with the help of the RSI of older period. For example, if on the M15, the RSI line is in the oversold zone, then on the H4, the RSI may already show the opposite state, and a short-term entry on the M15 can be dangerous.
- If rigid management is observed, RSI can be used for scalping during a wide enough flat period − this allows you not to miss the beginning of a strong movement and at the same time to earn from the quick deals.
- The RSI indicator is great for creating any automatic trading tools.
Try It Yourself
After all the sides of the indicator were revealed, it is right the time for you to try either it will become your tool #1 for trading.
In order to try the indicator performance alone or in the combination with other ones, you can use FTO with the historical data that comes along with the program.
Simply start using Forex Tester Online. In addition, you will receive 23 years of free historical data.
 Develop RSI Trading Strategy
 ไทย
ไทย
 Tiếng Việt
 Polski
 Türkçe
 Nederlands
 Română
 한국어
한국어
 Svenska
