A Quick Guide to the Stochastic Oscillator
Stochastic indicator is a simple momentum oscillator which has been around since the late 1950’s. What the Stochastic oscillator does is to determine just when a currency pair is oversold or overbought – which is why stochastic forex indicators are such an integral part of forex trading. Stochastic trading is widely used by most forex traders, even though the oscillator is over 50 years old – which suggests just how useful it has been in all the decades it has been around.
The Official Stochastic Definition describes the oscillator as follows…
“A technical momentum indicator that compares a security's closing price to its price range over a given time period. The oscillator's sensitivity to market movements can be reduced by adjusting the time period or by taking a moving average of the result.”
The following formula is used to calculate the indicator…
%K = 100[(C - L14)/(H14 - L14)]
C = the most recent closing price
L14 = the low of the 14 previous trading sessions
H14 = the highest price traded during the same 14-day period.
%D = 3-period moving average of %K
[Ref: Investopedia - http://www.investopedia.com/terms/s/stochasticoscillator.asp]
Here, we give you simple strategies for using the Stochastic Oscillator for forex trading. Forex Stochastic trading is actually surprisingly easy. There are several different variations of Stochastic trading, we start with the easiest – Slow Stochastic.
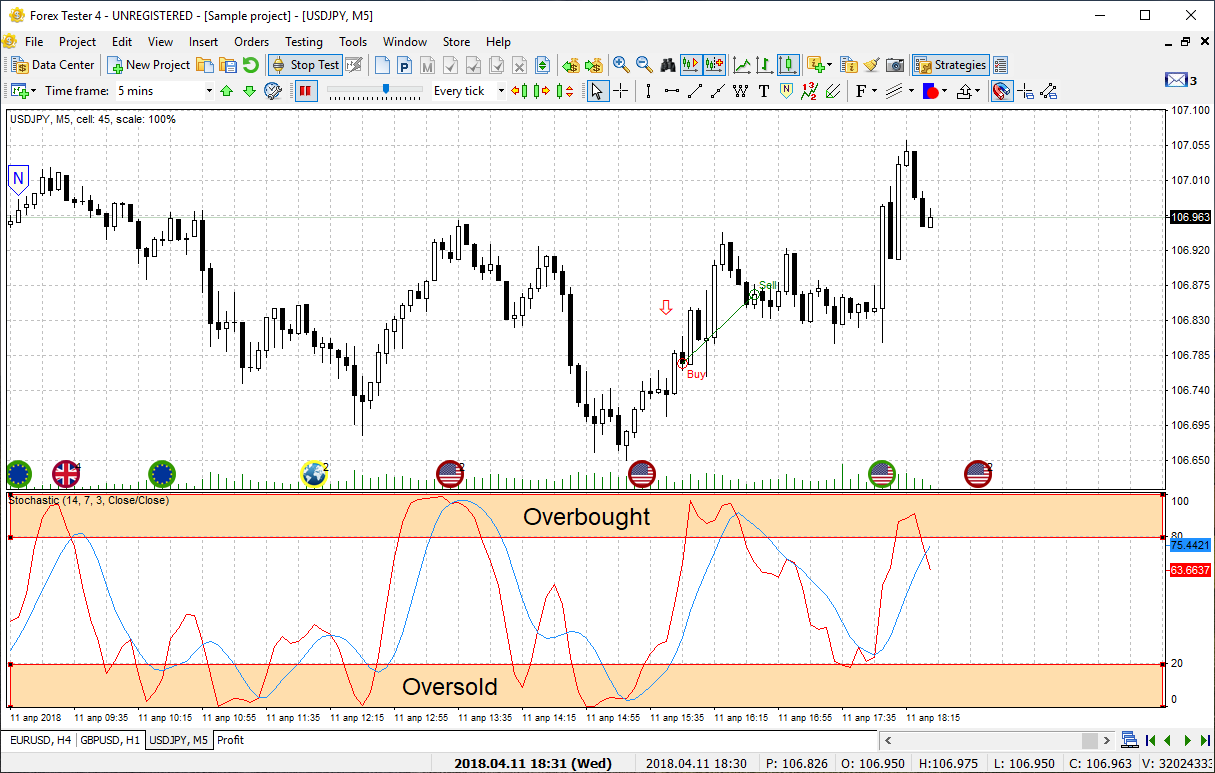
Slow Stochastic consists of two moving averages and is found at the bottom of the chart. The moving averages are between 0 and 100. The red line on the chart is the %K line in the formula and the blue line is the %D line. %D is the moving average of the %K line and always trails it. These lines are known as Stochastic lines.
The chart helps traders identify new trends in the market as and when they emerge and offer clues either when the momentum is increasing or decreasing – which would indicate how a trade is moving. When the two lines cross, they indicate a shift in momentum.
The signals given by the chart can always be strengthened and improved. The idea is to filter the trades so as to get a much stronger signal which would indicate the course of action to consider. There are two ways to do that.
Find out if there are any Crossovers at Extreme Levels
Some signals are stronger than others, and these are the ones to be noted. It is not necessary to observe every signal given by the fast Stochastic oscillator. The first thing to do is to identify the crossover of the Stochastic lines that occur at the most extreme levels.
Typically, the Stochastic indicator is bound between 0 and 100…. When it is over 80, it indicates “overbought” and when under 20, it indicates “oversold”.
So, if there is a cross-down at above 80, then it suggests a potential shift in trend, lower from the overbought levels. Similarly, a cross up that occurs just below 20 suggests a possible shift in trend, higher from oversold levels.
Time a Buy/Sell using a Higher Time Frame in the Direction of the Trend
One of the things you will observe during Stochastic forex trading is that when there is a very strong uptrend, the Stochastic oscillator remains in the overbought levels for a long time. Now, this may send many false “sell” signals if you’re not careful enough. Obviously, you should not sell a strong uptrend, especially when the trade still has some way to go.
So, when you find a strong uptrend, look closely for a dip, or a correction, which would allow you to time a buy. This means waiting patiently for an intraday chart to show a correction and show oversold indications.
When this happens, and the Stochastic lines cross up from the oversold levels, then this is the signal to buy that you’re looking for, and this in effect reflects the much bigger trends. So this is how traders use the Stochastic indicator to time entries for trades in the direction of a bigger trend.
Try It Yourself
After all the sides of the indicator were revealed, it is right the time for you to try either it will become your tool #1 for trading.
In order to try the indicator performance alone or in the combination with other ones, you can use Forex Tester with the historical data that comes along with the program.
Simply download Forex Tester for free. In addition, you will receive 23 years of free historical data (easily downloadable straight from the software).
Share your personal experience of effective use of the indicator Stochastic Oscillator. Was this article useful to you? It is important for us to know your opinion.
What is your favorite indicator?