Before starting a new test, you need to prepare data for it. In History Mode you can see all history for imported symbols and all time periods. Most of these data are redundant for testing, as usual only 1 or 2 currency pairs are rather sufficient for testing; also you can test not the whole period of historical data, but the most specific one (for example, during the year). It can increase the testing speed and remove unnecessary currency symbols.
History Mode stores data as 1-minute bars (a lot of data sources provide history in such a format). But to prepare data for Testing Mode we need to convert these 1-minute bars into ticks – the set of moment price development inside 1-minute bar. You can use 2 variants of price movement simulation.
Note: You can use real historical tick data (it is available for the subscribers of VIP data service). Please see more information here.
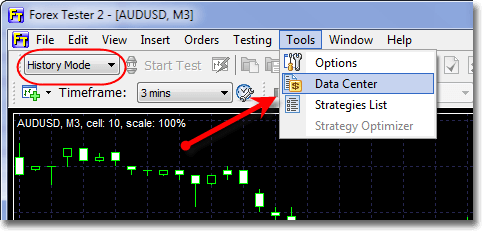
Ticks can be generated in History Mode only. In order to open the Generate ticks window, click Tools → Data center:
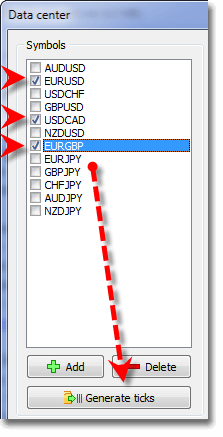
Check all necessary currency pairs and click the “Generate Ticks” button:
The following window will be opened:
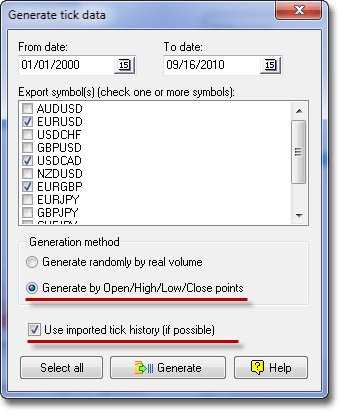
In this window you should select the period of time, check necessary currency symbols, which you plan to test (it is possible to test more than one currency symbol simultaneously), also you need to choose a generation method. Two methods of generation are available: Generate randomly by real volume – it means the number of ticks inside 1-minute-bar will be equal to volume, ticks will be distributed randomly inside one bar; Generate by Open/High/Low/Close – each bar will contain 4 (or less) ticks, which correspond to Open/ High/ Low/ Close value of the given bar (less than 4 ticks are possible in the situation when Open=High, or Low=Close). We recommend using the last method of ticks’ generation, as it is the fastest and gives a good testing quality.
Check “Use imported tick history” if you have access to tick data and they are downloaded into the program (all details are here). This will increase the testing quality, specially for scalping strategies.
The results of generating ticks by different methods:
1. Ticks generated randomly by real volume. As a result you get lots of ticks, which are randomly distributed inside each 1 minute bar, and their number will be equal to the volume of this bar. This method may slow down the testing, but if your strategy uses volume information, it can be useful.
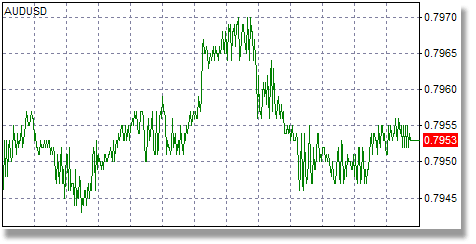
2. Ticks generated by Open/High/Low/Close. You will get fewer ticks compare to the previous method, but all of them are important (open/high/low/close of every 1 minute bar). It is a fast and sufficiently good method for most of the cases, and we recommend you to use it.
Note 1: If you have access to the real tick data and they are downloaded into the program, then this information will be used instead of simulation when you generate ticks. In case when tick data are not available for some bar - ticks will be simulated using the selected method.
Note 2: All methods of ticks generation will produce absolutely the same bars in Testing Mode; the difference between them is only in the price movement inside 1-minute bars.