The Cup and Handle Pattern is not the most common pattern. It is also not the easiest to identify. And this is not even a bad thing, because now you can learn to use it in your trading strategy to overtake other traders. So, “Cup and Handle” shows a rounded price dip – the cup – followed by a small pullback – the handle – before price pushes to fresh highs. Traders use it to spot bullish continuation setups in stocks, forex, and crypto. When read correctly, it gives clear cues for trade entry, stop loss, and target price. In this guide we cover every step: finding a valid cup formation, measuring cup depth and handle formation, confirming volume, placing trade orders, and backtesting the idea in Forex Tester Online.
Read on carefully to add this classic chart pattern technical analysis to your toolbox.
What Is a Cup and Handle Pattern?
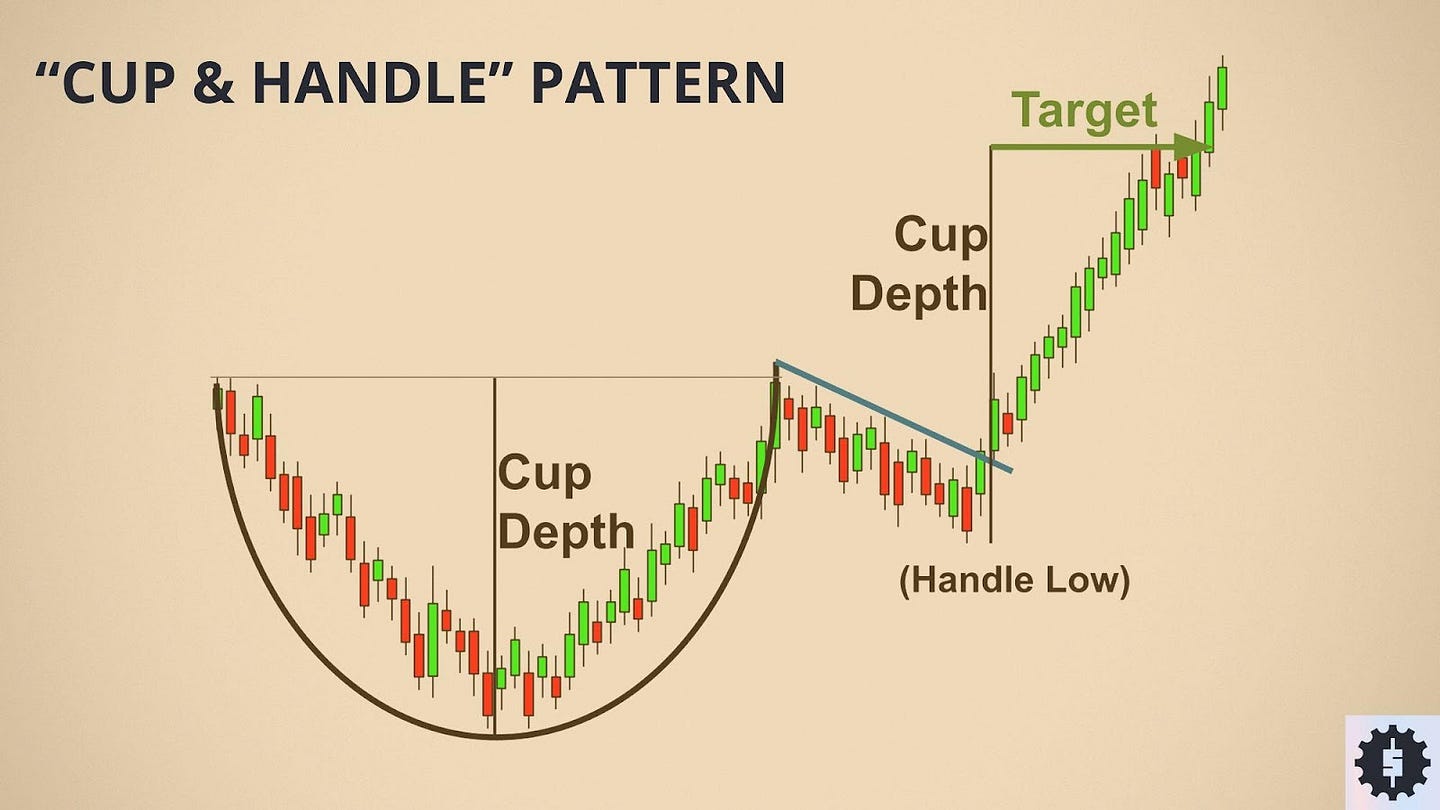
The cup and handle is a bullish continuation pattern in technical analysis.
Price first drifts down, carves a rounded bottom, then climbs back to the prior high. That U‑shaped move forms the cup. A shallow pullback follows near resistance, creating the handle. The handle often tilts down on light volume, showing sellers are spent.
When price breaks above the handle’s ceiling on stronger volume, traders read it as fresh buying pressure and a bullish signal. Key traits are a smooth cup, a handle not deeper than one‑third of the cup depth, and a breakout that closes above resistance.
Properly spotted, the pattern suggests momentum can resume to higher targets.
How to Identify Cup and Handle Pattern?
To correctly identify this pattern, follow these steps:
- Spot the cup formation. Look for a smooth, U‑shaped cup on the chart. The left rim sets resistance; price drifts down, forms a rounded bottom, then climbs back to that same level.
- Check cup depth. Ideal depth is 15-35 % below the left rim. Deeper cups often signal a bearish reversal pattern, not a bullish continuation trend pattern.
- Measure duration. The cup usually forms over several weeks. A handle that forms in a few days is fine; the handle should be shorter than the cup.
- Confirm handle formation. After the right rim, price drifts sideways or slightly down, staying inside the top third of the cup depth. Volume dries up during this price consolidation.
- Wait for volume confirmation.A valid breakout closes above resistance with a clear uptick in volume. Lack of volume can lead to a false breakout.
Common pitfalls
- V‑shaped “cups” with no rounded bottom – skip them.
- Handles that drop below one‑third of cup depth – pattern invalid.
- Breakouts that occur before a handle forms – often fail.
- Light volume on breakout – raises the risk of price retracement.
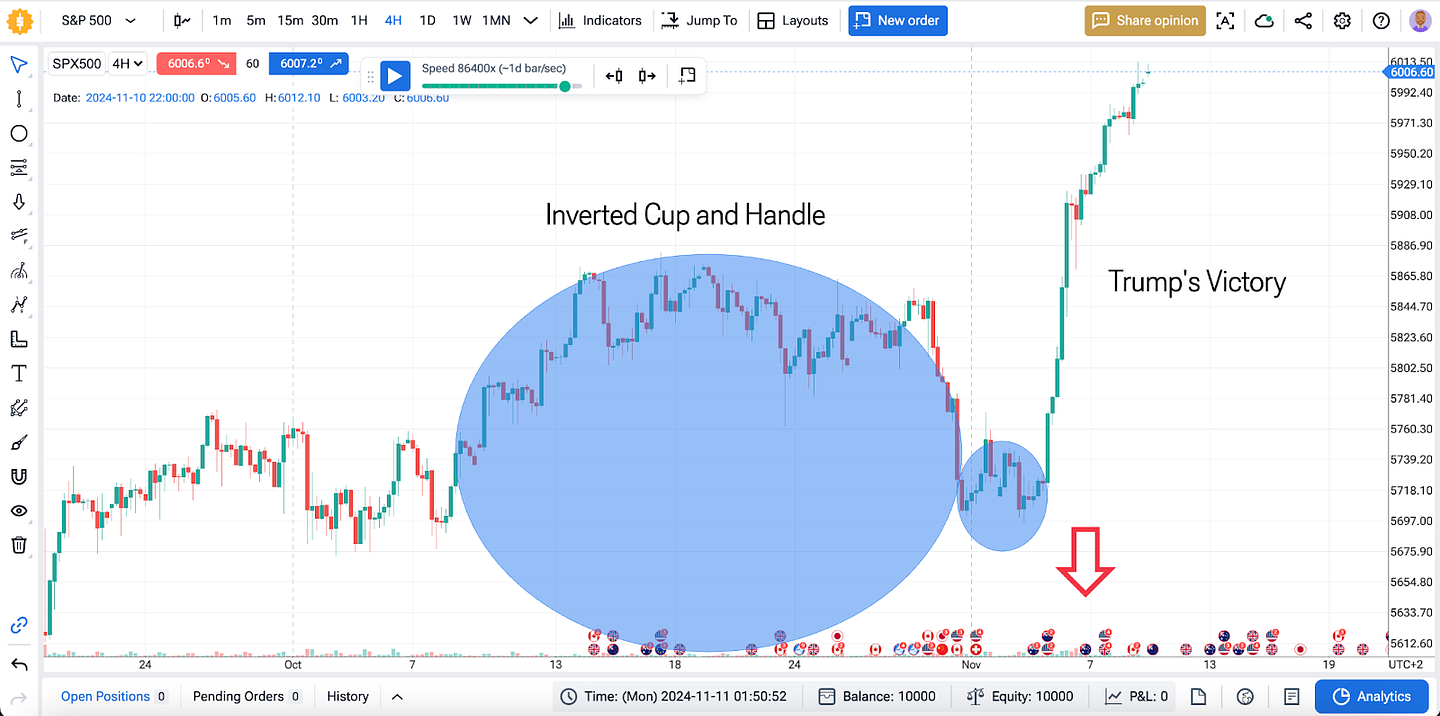
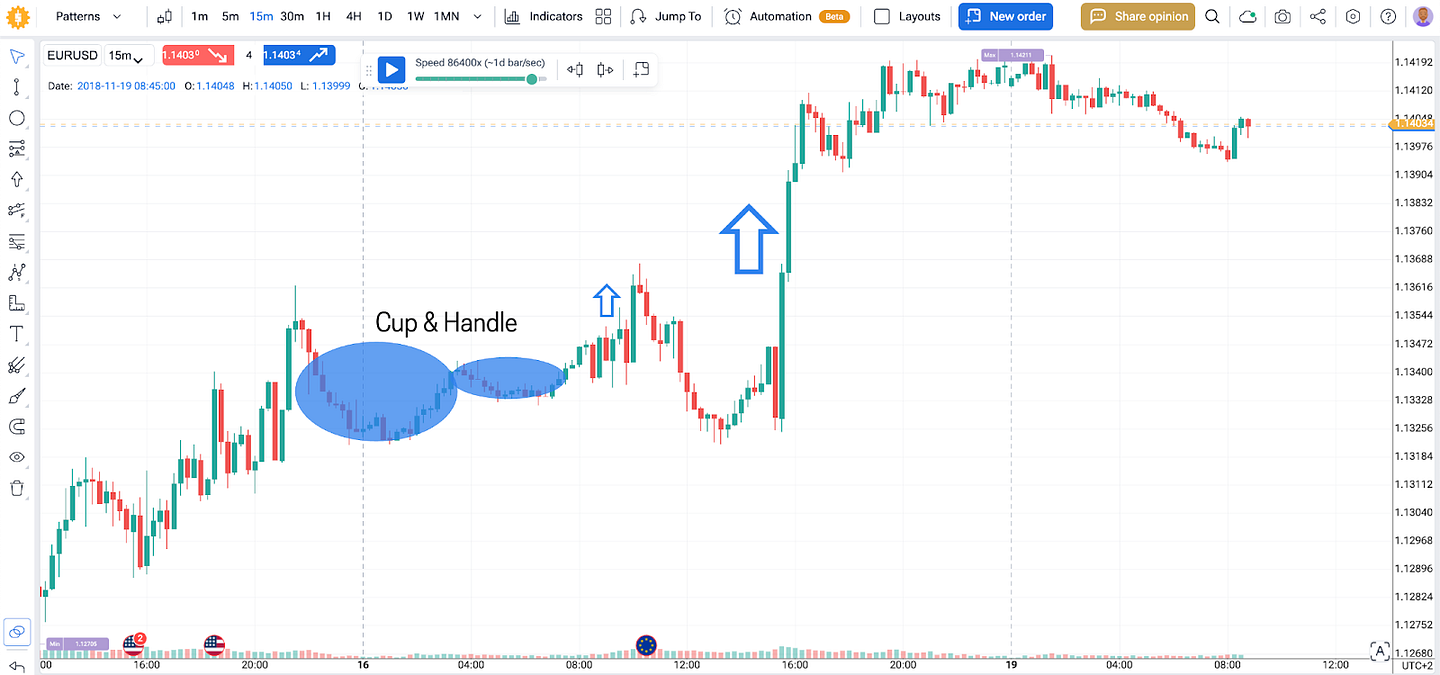
And remember about fundamental events. They ruin all patterns and entire technical analysis. Here is an example:
According to the pattern’s rules, the price was supposed to go down. But it didn’t, because of the fundamental event.
🔗 Also read: 4 Cases When Trading Patterns Don’t Work | Don’t follow them blindly!
Practical exercise (using historical data)
Before we move on, you can try spotting “Cup and handle” on the chart.
Test each trade setup in Forex Tester Online. Backtesting the cup and handle chart pattern on real history shows win rate, price momentum metrics, and drawdowns before live money is at risk.
Try to find and trade this pattern at least 5 times on Forex Tester Online. Then, continue reading to learn new strategies.
Cup and Handle Trading Strategies
The cup and handle chart pattern offers a clear trade setup: buy the breakout, cap the risk, and let price momentum push toward the measured target. Follow these steps.
1. Entry rules
- Confirm the breakout. Wait until the price closes above the handle’s resistance line. The candle must finish higher, not just spike intra‑bar.
- Check volume confirmation. Breakout volume should beat the prior 10‑bar average. Strong volume confirms market sentiment and cuts odds of a false breakout.
- Optional filter. Some traders add a 0.5 -1 % buffer above resistance before entering. This reduces slippage on thin books.
2. Stop‑loss placement
- Place the stop a few ticks under the handle low.
- If handle depth exceeds one‑third of the cup depth, the pattern loses validity – skip the trade.
- Trail the stop to breakeven once price advances halfway to the target price.
3. Target price
Measure the vertical distance from the cup bottom to the rim. Add that distance to the breakout level. This gives a logical price target and a risk‑to‑reward ratio of roughly 2:1 or better on most setups.
4. Volume’s role
Rising volume on breakout equals buying pressure. Flat or falling volume warns of a possible price retracement. If volume confirmation is missing, stand aside or trade smaller.
5. Practical examples
- NASDAQ stock: Cup depth = 22 %, handle formation lasted seven days. Price breakout at $150 with volume up 35 %. Stop loss $145, target $183. Hit target in 11 sessions.
- ETHUSD daily: Rounded bottom, shallow handle. Breakout above $3 200 after volume confirmation. Stop loss $3 050, target $3 600. Trade reached target in five days
6. Backtesting Cup and Handle Trading Strategy via FTO
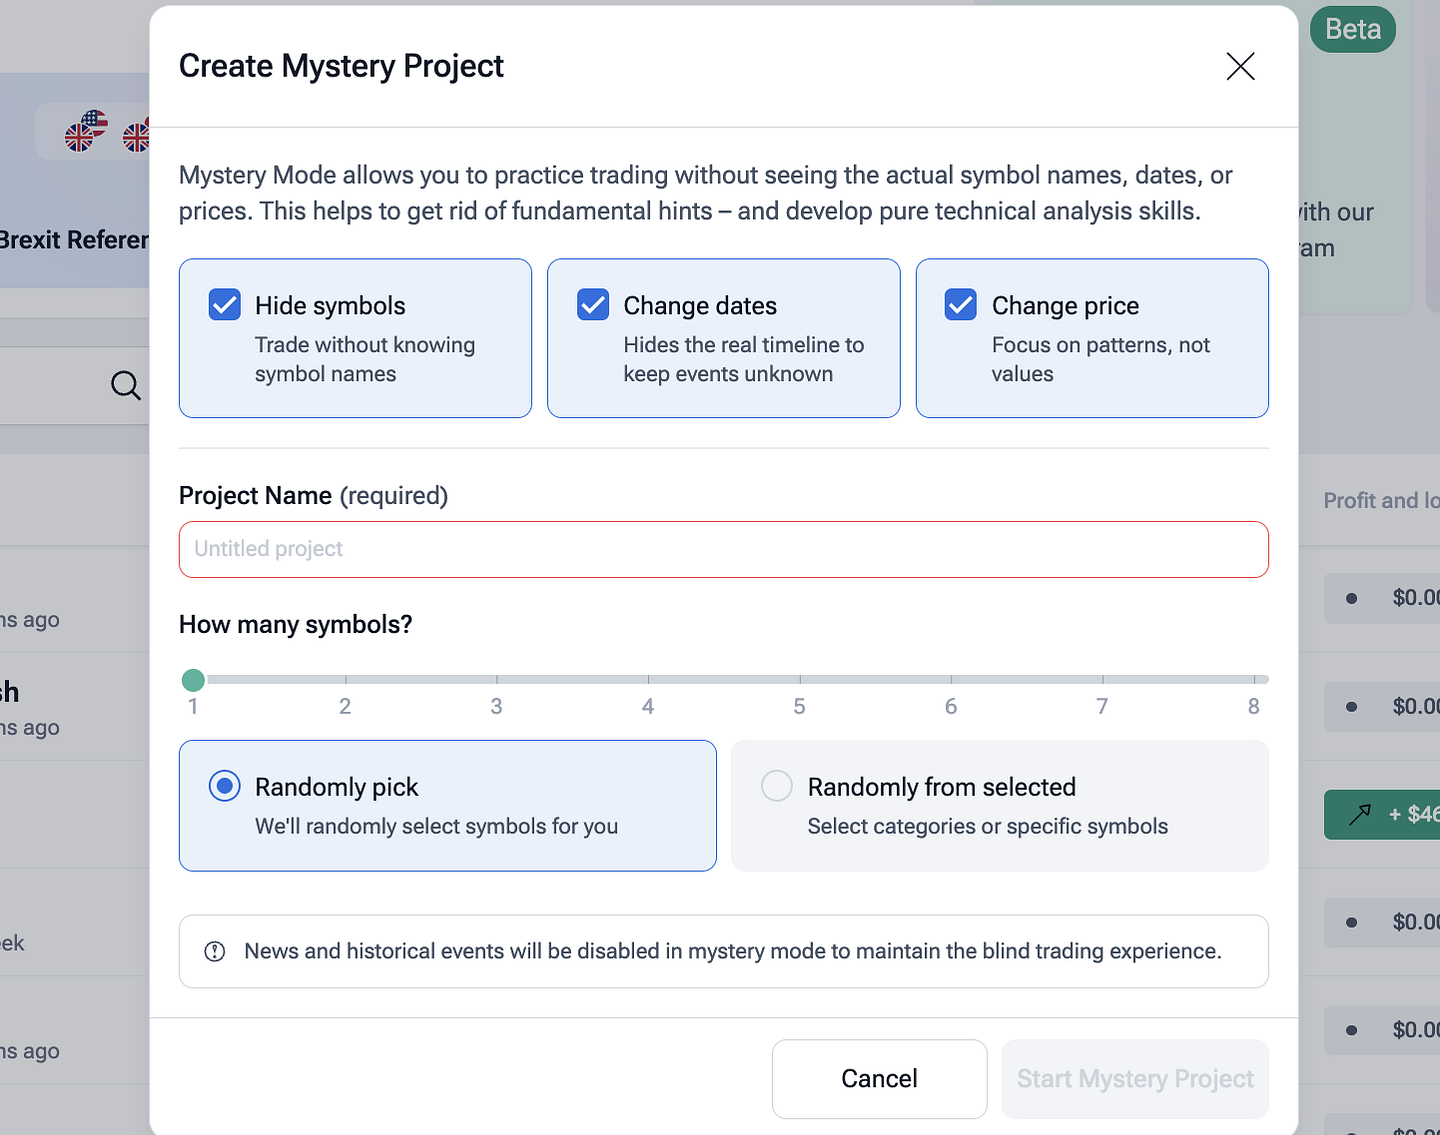
Run every trading cup and handle setup through Forex Tester Online. You can also use our new “Mystery Project” mode to avoid bias. Backtesting reveals hit rate, drawdown, and volatility impact before capital is on the line. Adjust position size per trade to keep total portfolio risk below 2 %. Good risk management turns a textbook bullish continuation pattern into a repeatable trading strategy.
Use these rules consistently and review each trade log. Over time you will know which market, timeframe, and cup depth give the best edge for your cup and handle trading pattern.
Besides backtesting patterns and gaining skills and confidence in Mystery Mode, you can use Forex Tester Online for:
✅ Testing manual and algorithmic strategies
✅ Running custom backtesting scenarios
✅ Simulating prop firm challenges
✅ Running tests with your own technical indicators
✅ Analysing long-term profitability using 21+ years of historical data
🔗 Check this guide: How to use FTO for backtesting
Conclusion
The cup and handle pattern gives traders a simple, bullish continuation signal backed by clear market psychology: sellers tire into the rounded bottom, buyers regroup in the handle, then push through resistance. Use technical analysis rules – shape, depth, volume – to filter weak setups. Pair every entry with strict risk management and a measured price target. Always backtest the trading cup and handle historical data in Forex Tester Online before going live. Data first, capital second – that keeps the edge real.
🔗 Also read: How to identify Pennant Pattern
Disclaimer
Trading involves risk. This material is for education only, not investment advice. Past results never guarantee future returns. Test every setup on historical data before using real money.
FAQ
Is the cup and handle pattern bullish?
Yes. It is a bullish continuation pattern built on a rounded bottom (the U‑shaped cup) and a short price consolidation (the handle). When the neckline breaks, price momentum often accelerates upward.
What is an inverted cup and handle?
The inverse version flips the structure. A rounded top forms, a small uptick acts as the handle, and a breakdown signals selling pressure. It points to bearish price action, not a bullish signal.
What is the best timeframe to trade the cup and handle pattern?
Daily charts give the cleanest pattern validity, but 4‑hour and weekly timeframes work too. Always match the timeframe to your trading strategy and risk management rules.
Can the cup and handle pattern be used in forex and crypto markets?
Yes. Currency pairs and crypto assets show the same buying pressure and selling pressure dynamics. Just confirm volume confirmation on exchanges that report real volume.
How do you calculate the price target for the cup and handle pattern?
Measure the distance from cup bottom to neckline, then project that height above the breakout. This simple price target method works across assets.
What role does volume play in the cup and handle pattern?
Light volume inside the handle signals fading sellers. A spike on breakout confirms market sentiment and cuts false breakout risk.
How should stop‑loss be set when trading this pattern?
Place the stop a little below the handle low. That level protects the trade from normal price retracement while keeping risk tight.
How long does it take for a cup and handle pattern to form?
The cup often spans weeks; the handle can finish in days. If formation time is too short, question the pattern validity.
Is the cup and handle pattern reliable?
Reliability rises when volume confirmation appears, depth stays within the one‑third rule, and backtesting shows positive expectancy. No pattern is perfect – always test and manage risk.
 ไทย
ไทย
 Tiếng Việt
 Polski
 Türkçe
 Nederlands
 Română
 한국어
한국어
 Svenska


 Try Forex Tester Online


