Mean reversion trading bets that price swings will move back to an average. When markets stretch too far, they often start reversion to the mean. We use this edge across stocks, forex, commodities, and ETFs. It works best in range-bound conditions with clear support and resistance. In this guide we explain the core idea, show a mean reversion trading strategy for different setups, and pick the right technical indicators for mean reversion. We also cover entry and exit points, stop loss placement, and risk management in trading.
What Is Mean Reversion in Trading?
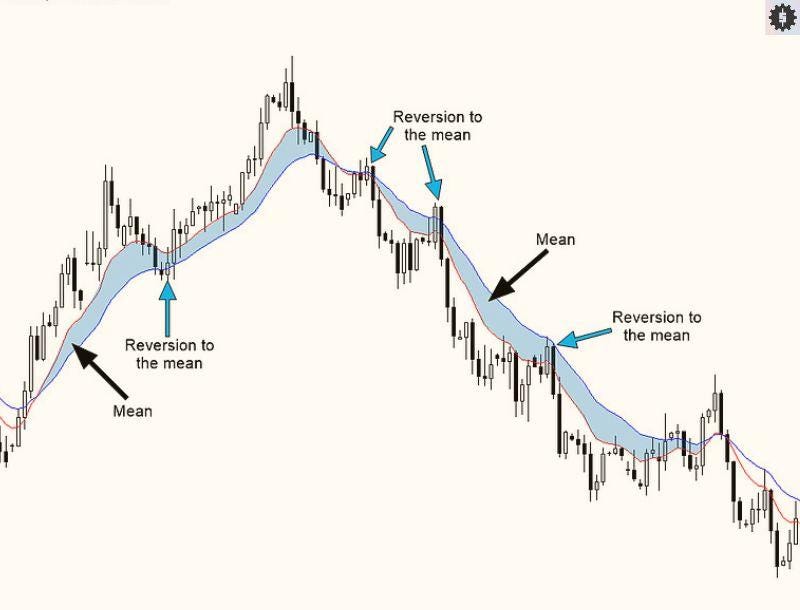
Mean reversion trading is the idea that price swings tend to drift back to an average. After a fast rise, price often cools and reverts to the mean. After a sharp drop, it often snaps back. The “mean” can be a moving average, a VWAP, or a fair value zone you define.
Why does it work? Markets overreact. Orders cluster. Liquidity thins and then returns. When the push fades, price normalizes. That’s reverting back to the mean.
It works best in range-bound markets. Clear support and resistance hold price inside a channel. In strong trends, reversion trades fail more, so reduce size or wait. If you want to ride trends, use momentum trading strategies instead.
Where to use it:
- Stocks and ETFs: earnings drift and sector rotations create ranges.
- Forex: major pairs often coil around moving averages during sessions.
- Commodities: mean-reversion behavior shows up between supply/demand reports.
So, basically, you need to define the mean, measure distance from it, and wait for a mean-reversion signal. Add volume confirmation when possible. Then plan the entry and exit points with tight stop loss placement.
Would you like to learn about other strategies? Read more:
– Trend Trading Guide
– Fair Value Gap Trading
– Quant Trading Strategies
How Does Mean Reversion Work?
Now let’s go step-by-step. Mean reversion trading is simple: define the mean, measure deviation, wait for a snap-back, then exit into the mean.
1) Define the mean
Use technical indicators for mean reversion: 20-50 SMA/EMA, VWAP (intraday), or a rolling median. Add Bollinger Bands to frame typical distances.
2) Measure deviation
Tag “stretched” price with RSI/Stoch <30 or >70, a z-score of ±2, or price >1.5-2 ATR from the mean. This flags overbought/oversold conditions.
3) Add context
Map support and resistance. Favor longs near support and shorts near resistance. Do volume and volatility analysis: look for volume confirmation on the turn and cooling volatility before entry.
4) Confirmation signals
Use clean mean reversion signals/patterns: bullish/bearish engulfing, pin bars, or a momentum fade (RSI turning up from 30; MACD histogram rising). This is your basic price pattern recognition.
5) Entry and exit points
- Entry: after the signal candle closes against the extreme (e.g., close back inside the band).
- First exit: scale out at the mean (MA or VWAP).
- Second exit: optional target at the opposite band or next level.
- Stop loss placement: beyond the swing extreme or 1-2 ATR past the signal bar.
6) Risk management in trading
Risk 0.5-1% per idea. Use time-based exits if price stalls. Track transaction costs; mean reversion can trade often.
When it fails (and why)
- Strong trend or news shock (skip or trade smaller; this is where momentum trading strategies win).
- Broken levels (support/resistance didn’t hold).
- Volatility regime shift (your volatility trading strategy thresholds are off).
Think “buy undervalued, sell overvalued” relative to your chosen mean – only with confirmation signals and clear rules.
Key Technical Indicators for Mean Reversion
Before you start trading (or backtesting), we recommend to turn on these indicators:
Moving Averages (SMA, EMA, WMA)
These define the mean. 20-50-period SMA/EMA works for most pairs. Price far from the MA = stretch. A close back toward the MA gives a mean-reersion signal. Slope flat to mild helps. Use trading with support and resistance to filter entries.
Bollinger Bands
20-SMA with ±2 standard deviations. A classic rule: close outside the band, then close back inside = trigger. First target is the middle band. Add volume confirmation on the turn. If bands are widening fast, stand aside (trend risk).
RSI / Stochastics
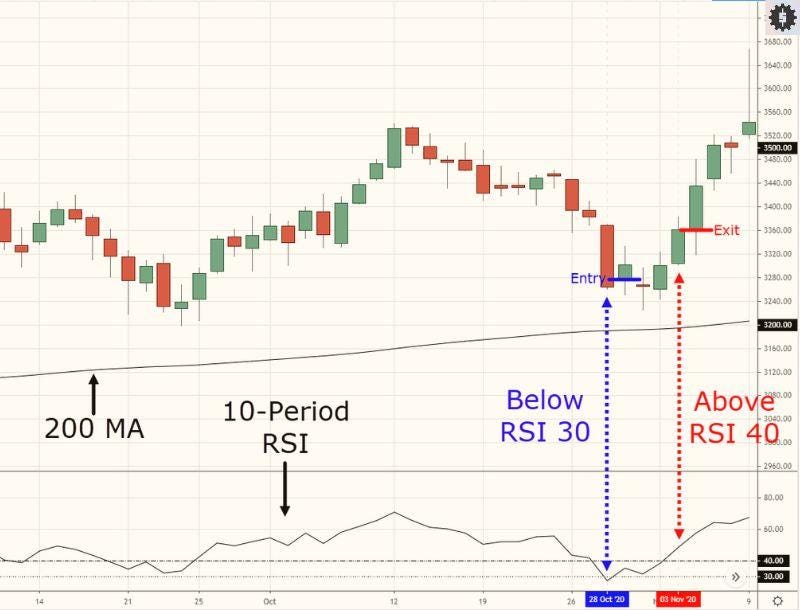
RSI <30 or >70 marks extremes. A hook back through 30/70 signals mean reversion momentum. Stochastic %K crossing %D from <20 or >80 gives similar confirmation signals. In ranges, 40-60 RSI filters noise.
MACD / PPO
Look for a momentum fade: shrinking histogram at the extreme, then a signal-line cross. Use it to confirm the RSI/price cue. Good for price pattern recognition (engulfing, pin bars).
ATR
Sets distance for stop loss placement and profit targets. Typical plan: stop = 1-2 ATR beyond the extreme; scale at the MA; optional runner to the opposite band.
Volume & Volatility tools
Simple volume spike or OBV turn = volume and volatility analysis check. Bollinger Bandwidth / ATR surge warns of trend risk. Quiet volatility favors a mean reversion trading strategy.
Screeners and scanners
Scan for “% from 20-EMA,” “RSI <30,” or “close outside bands.” Save presets as your mean reversion trading guide. Flag news events to avoid false reads.
Quick rules (entry and exit points)
- Entry: after price closes back inside the band or above/below the signal candle.
- Exit 1: at the mean (MA/VWAP).
- Exit 2 (optional): opposite band or next support and resistance level.
- Stops: 1-2 ATR beyond the swing extreme; add a time stop if price stalls.
These technical indicators for mean reversion keep the plan clear: spot stretch, confirm, enter, and take profits into the mean – while risk stays small and defined.
Also read: TOP-21 Forex Indicators
Mean Reversion Trading Strategies
Mean reversion works best with clear rules. We look for stretch, wait for mean reversion signals, and trade the snap back to the average. Below are six core setups with entry and exit points, volume confirmation, and stop loss placement.
Moving Average Crossover Strategy
Idea: trade when price reclaims the mean.
Rules:
- Mark the 20-EMA and 50-EMA as the “mean.”
- Entry: after an overshoot, buy when price closes back above the 20-EMA (for longs) and the 20-EMA is near flat.
- Confirmation: small bullish candle at support and resistance or a bullish engulfing after the stretch.
- Stop: 1-1.5 ATR below the swing low.
- Exit: scale at the 50-EMA; final at prior range mid.
Note: avoid strong slopes; a steep MA means trend risk, not reverting to the mean.
RSI and Stochastic Reversion Strategy
Idea: fade extremes; capture the swing back to neutral.
Rules:
- Entry: RSI <30 then hooks up through 30; or Stoch %K crosses %D from under 20.
- Add mean reversion confirmation signals: tiny range candle, wick rejection, or volume confirmation uptick.
- Stop: below the extreme wick (1-2 ATR).
- Exit: first at RSI ~50; second at the 20-EMA.
Failure reasons: news spikes, thin liquidity, or higher-timeframe trend against the trade.
Bollinger Bands Strategy
Idea: outside band = stretch; inside = trigger.
Rules:
- Entry: close outside ±2σ band, then next close back inside the band.
- Prefer flat to narrowing bands (range).
- Stop: beyond the extreme bar high/low.
- Exit: mid-band (20-SMA) first; optional runner to opposite band.
Tip: if Bandwidth is expanding fast, skip (trend risk). This is a volatility trading strategy as much as a price setup.
Pairs Trading (Statistical Arbitrage)
Idea: two correlated markets diverge; we trade the spread back to its mean.
Rules:
- Pick a correlated pair (e.g., two bank stocks, or closely linked ETFs).
- Build a simple z-score of the price ratio.
- Entry: long the cheap leg, short the rich leg when z-score > |2.0| and turns.
- Stop: time stop (e.g., 10 bars) or z-score > |3.0|.
- Exit: z-score back to 0-0.5.
Notes: watch volume and volatility analysis on both legs; avoid earnings or macro releases.
Volatility Mean Reversion
Idea: volatility spikes fade; vol slumps revert up.
Rules:
- Use ATR or Bollinger Bandwidth as the vol proxy.
- Entry: after a vol spike with price exhaustion (long tail, doji, or price pattern recognition signal), fade back to the mean.
- Stop: beyond the spike extreme.
- Exit: when ATR returns to its 20-period average or price tags the 20-EMA.
Caution: vol regimes can shift; set a time-based exit.
Fibonacci Reversion
Idea: stretched moves snap to common retrace levels.
Rules:
- Map the impulse leg.
- Entry: at 38.2% or 50% retrace if it aligns with support and resistance and the 20-50 EMA zone.
- Add mean reversion momentum cue (RSI turning up from 40-45).
- Stop: below 61.8% or the swing low.
- Exit: first at the origin’s mid-zone; second at the 20-EMA or prior value area.
General tips: trade liquid markets, avoid major news, and keep risk small. Mean reversion is patient work. We wait for the stretch, proof of the turn, then take the path back to the mean.
Backtesting and Optimizing Mean Reversion Systems Using Forex Tester Online
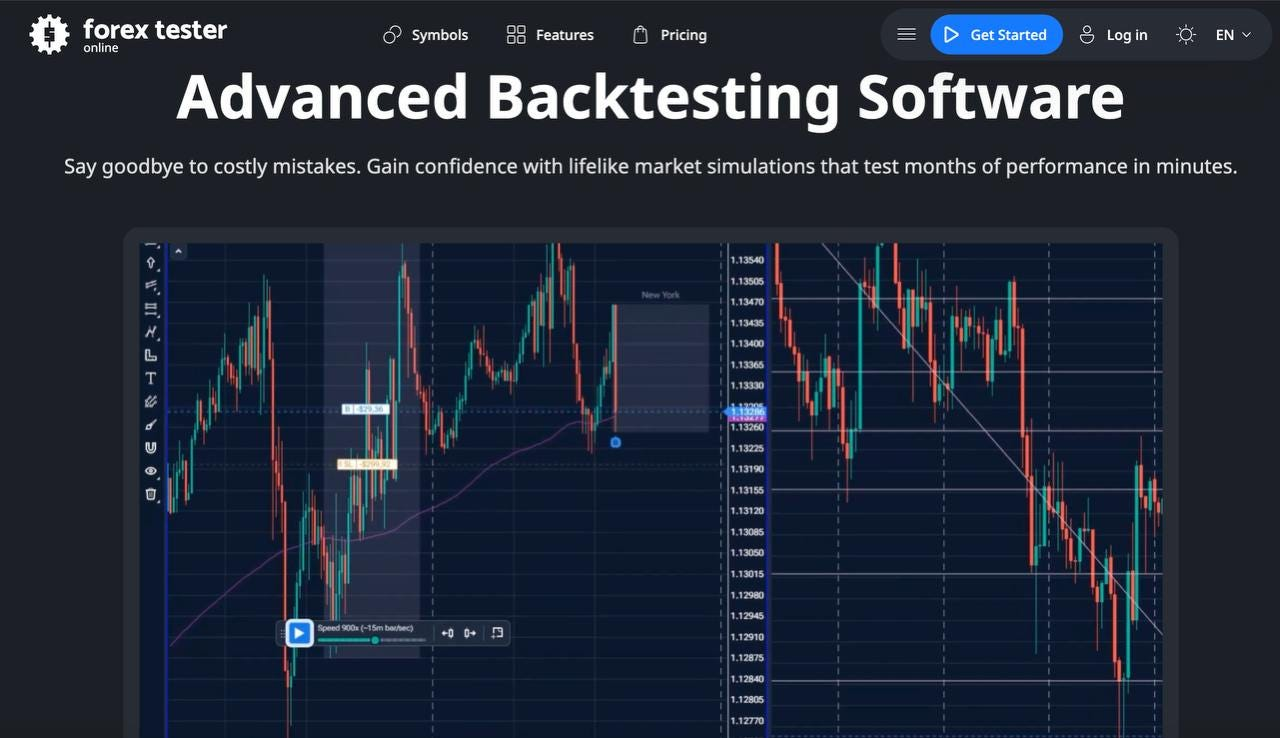
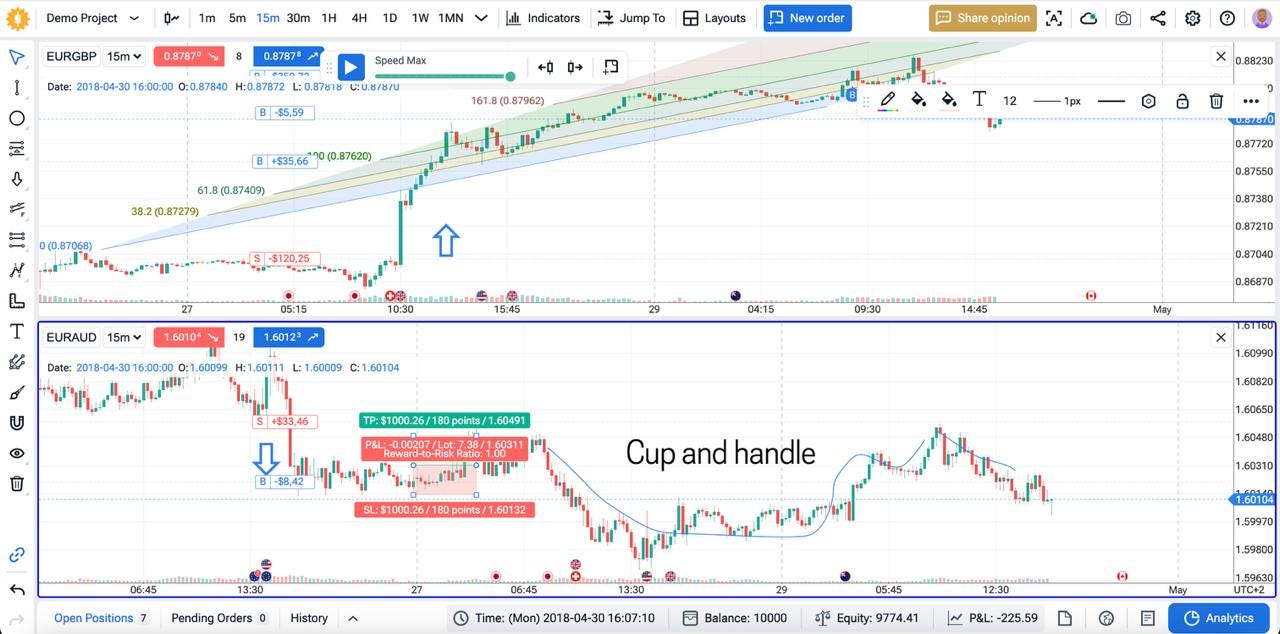
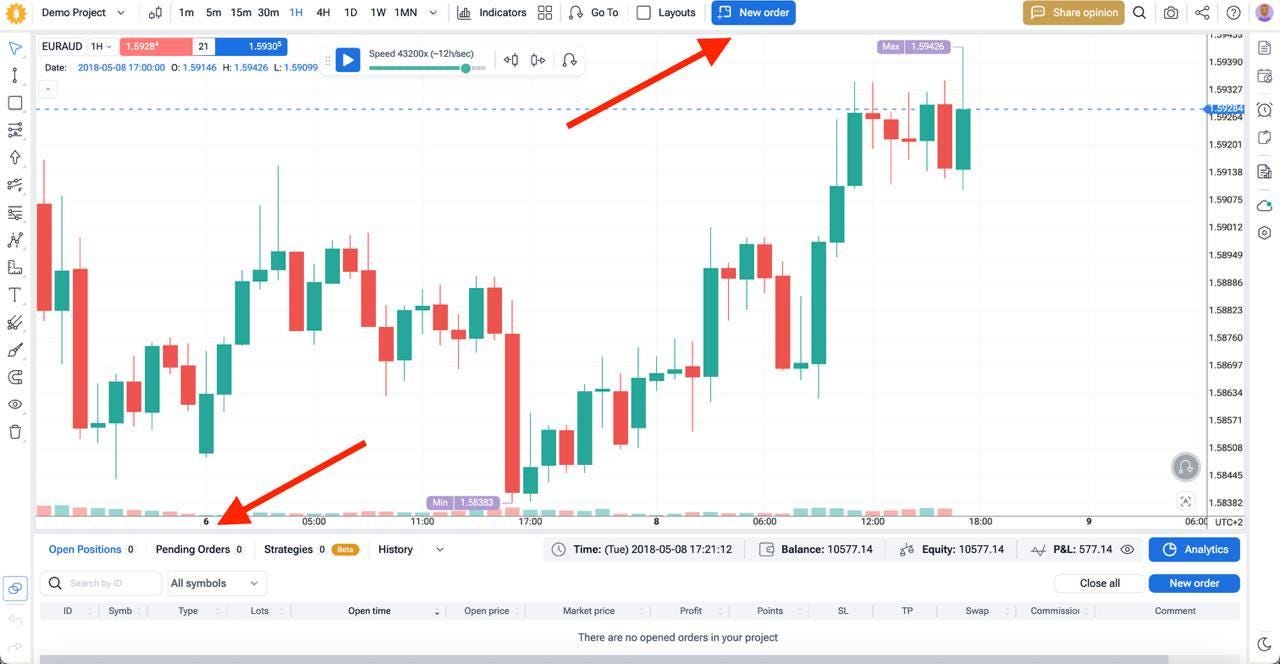
It is too risky to run a strategy without backtesting it (verifying its efficiency on 21+ years historical data). That’s why we recommend you use a trading simulator Forex Tester Online. This is how to run every idea in FTO trading simulator before you trade it.
FTO also helps you test fast and clean: Mystery Mode (hide symbol/timeframe to cut bias), custom indicators, scenarios, Jump To, and built-in news marks.
1) Get access
Visit the FTO backtesting software site, compare plans, click Get Started, open an account, and activate subscription.
2) Create a project
On the dashboard hit + New Project. Pick symbols, name the file, set a virtual deposit, choose start‑end dates, select your time zone, then press Play. We recommend you to put realistic numbers for more reliable results.
3) Go to “Indicators”, fund and turn on all the indicators you need for your strategy.
4) Click “Play” or use the “Jump to” feature to go to the specific time frame you need. You can also choose speed using the green slider.
5) Open and close orders, according to the strategy rules.
6) Review analytics. Check win rate, drawdown, Sharpe, and slippage. Export the CSV to study price breakout stats and execution speed.
7) Iterate and optimize
Optimize your strategies and refine your trading psychology until you make it work. Now, when you backtested your strategy on the FTO simulator, you can finally start trading real money on your trading platform.
Step-by-Step Guide: Building a Mean Reversion Trade
Follow this mean reversion trading guide from scan to exit. Keep rules tight and repeatable.
Important: We don’t recommend you to start trading without prior backtesting! To see the backtesting guide, scroll down first.
- Identify candidates. Pick liquid symbols with clean ranges. Look for clear support and resistance. Avoid major news days.
- Define the mean. Choose the reference: 20-SMA for fast snaps, 50-EMA for slower swings. Plot ATR to size stops.
- Spot deviation. Wait for a stretch away from the mean. Use RSI <30 or >70, a close beyond Bollinger Bands, or a z-score > |2| as mean reversion signals.
- Add context. Check higher timeframe. Is price still inside a wider range? Mark nearby support and resistance so you are not fading into a breakout.
- Plan entry and exit points. Entry: after a reversal cue (engulfing, pin bar) and volume confirmation back inside the band/mean. First target: the moving average (the mean). Second target: range mid or the opposite band.
- Stop loss placement. Place the stop 1-2 ATR beyond the extreme wick or outside the band. This accounts for noise while protecting capital.
- Size the trade. Risk a fixed percent per trade (for example, 0.5-1%). Position size = account risk ÷ stop distance. This is core risk management in trading.
- Execute and manage.Enter on close, not mid-bar. If price hesitates, reduce size. If momentum stalls near the mean, take partial profit.
- Exit and review. Exit remainder at target or on time-based exit (e.g., 10 bars) if reversion fails. Log the trade: setup, deviation, entry and exit points, result.
Example setup
Instrument: EURUSD 1-hour.
Mean: 20-SMA. ATR(14): 9 pips.
Signal: RSI dips to 27, candle closes back inside lower Bollinger Band at 1.0820 with a small bullish engulfing.
Entry: long at 1.0822 on close.
Stop: 1.0822 − 2×ATR = 1.0804 (18 pips).
Target 1: 20-SMA at 1.0838.
Target 2: range mid near 1.0852.
Notes: if mean reversion momentum fades (RSI stalls under 50 and volume drops), exit early at the 20-SMA and stand aside.
Risk Management in Mean Reversion Trading
Mean reversion trading works only with strict risk rules. Plan them first.
Stop loss placement
Put the stop beyond the extreme, not at the mean. Use 1-2 ATR outside the band or below last swing for longs. If price keeps stretching, you are wrong – exit.
Position sizing
Risk a fixed fraction per trade (0.5-1%). Size = account risk ÷ stop distance. Small risk keeps you alive when several setups fail in a row.
Profit taking
Scale out at the mean. Leave a runner to the opposite band only if volume and momentum cool as price returns.
Filters
Trade with support and resistance. Do not fade a candle into a fresh breakout level. Add volume and volatility analysis: skip fades during news spikes and thin sessions.
Mean reversion failure reasons
A new trend starts, liquidity dries up, or volatility regime shifts. Use time-based exits (e.g., 10 bars) and a max adverse excursion cap to cut slow bleed.
Pros and Cons of Mean Reversion Trading
Pros:
- High win rate in ranges.
- Clear entry and exit points.
- Works across forex, stocks, ETFs, and commodities.
Cons:
- Large losses when trends run.
- Prolonged deviation can trap capital.
- Frequent trades raise transaction costs and slippage.
Mean Reversion vs Trend Following
Mean reversion moves back to an average. Meanwhile trend trading rides breakouts away from that average. The first suits range-bound markets with tight stops and targets at the mean. The second suits strong trends with wider stops and trailing exits. Many traders hold a mix, so one style works when the other struggles.
Advanced Techniques and Automation
Mean reversion gets stronger with better signals and clean execution. Start by building smarter inputs. Use a z-score of price vs a moving average, add rolling ATR to scale entries, and filter trades with volume confirmation near clear support and resistance. You can also time exits with half-life estimates (OU-style) so you don’t overstay a slow reversioon back to the mean.
Layer simple models. A Bollinger Band touch plus RSI < 35 is a basic mean reversion signal. Add a volatility filter (ATR above/below its median) to avoid dead ranges or wild spikes. If you trade pairs, compute a spread z-score and trade only when correlation stays high.
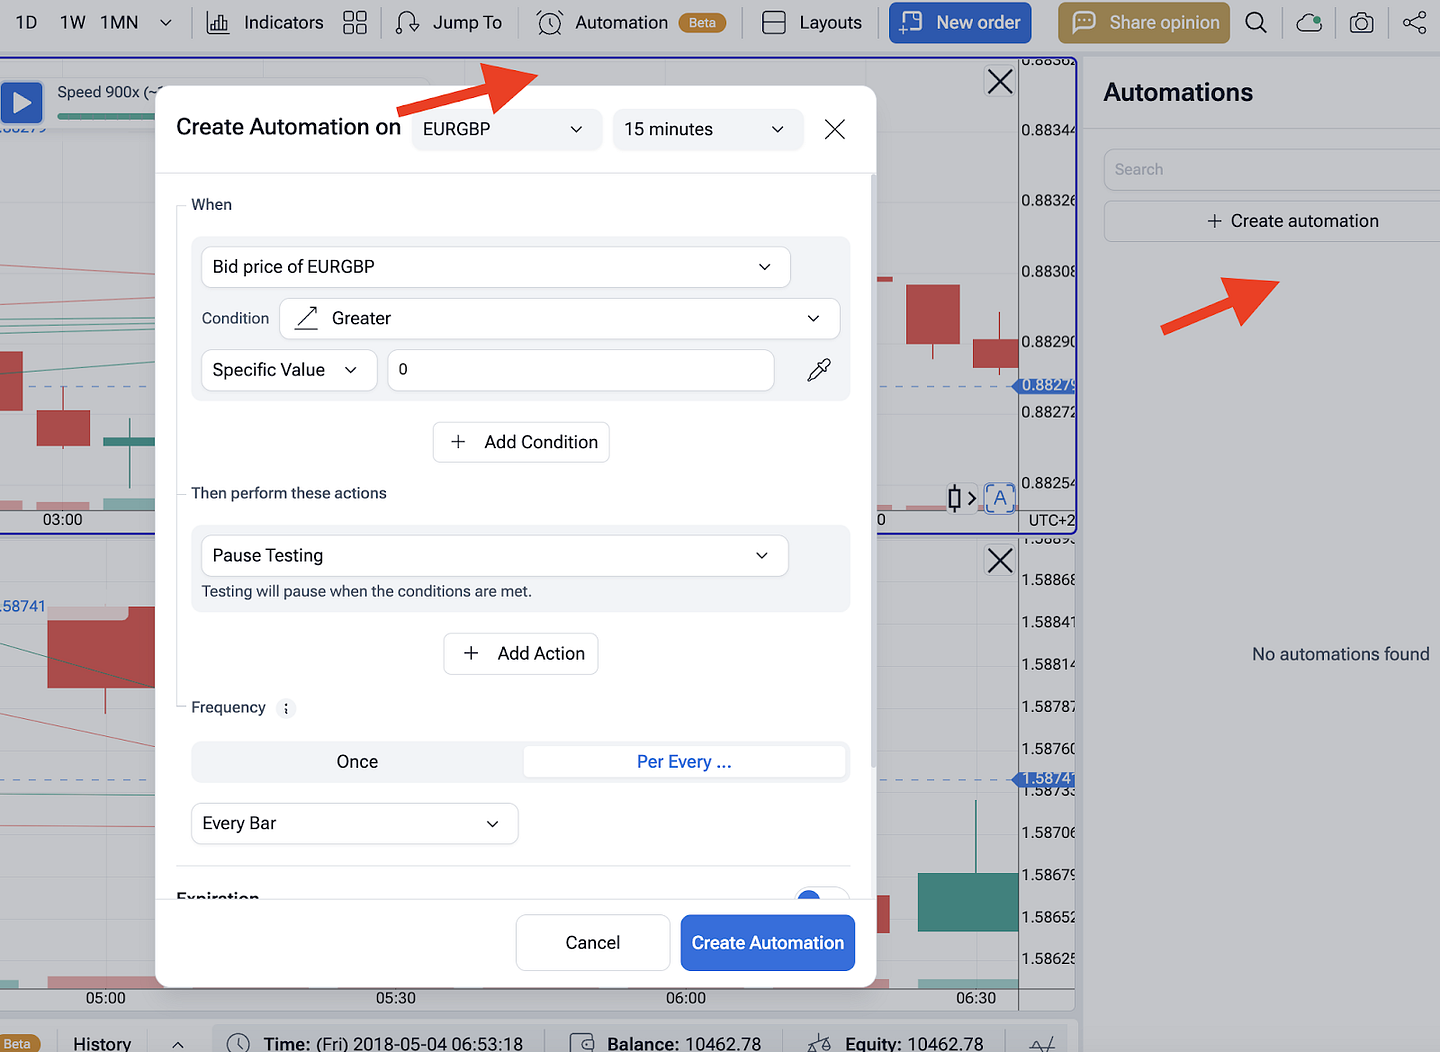
Automate the rules in Forex Tester Online. Open the “Automation” tab, code your mean reversion trading strategy in Python or build it with no-code blocks. Wire inputs (SMA/EMA, Bands, RSI, ATR), define entry and exit points, stop loss placement, and position sizing. Press Start to replay tick-by-tick, then run walk-forward tests by re-optimizing on rolling windows. FTO logs every fill, so you can review slippage, drawdown, and win rate quickly.
When your automated script holds up out-of-sample, keep it running in demo. Add simple guards in code – max daily loss, max open trades, spread limits. That way risk management in trading stays active even when you are not at the screen.
Conclusion
Mean reversion trading works when price stretches too far and then starts reversion back to the mean. A clear mean reversion trading strategy ties together technical indicators for mean reversion (SMA/EMA, Bollinger Bands, RSI), clean entry and exit points, and strict stop loss placement. Read price around support and resistance, add volume confirmation, and check volatility before you act. This mix keeps signals honest and helps you avoid common mean reversion failure reasons like regime shifts, news spikes, or a fresh trend. Treat it as a volatility trading strategy too: size risk to ATR and let mean reversion momentum fade guide exits. Backtest everything, write rules, and keep notes on price pattern recognition, volume and volatility analysis, and results.
Use this mean reversion trading guide, test in Forex Tester Online, and keep risk management in trading at the center of every decision.
Disclaimer
Trading involves risk. This material is for education only and is not financial advice. Past results do not guarantee future returns. Always backtest and forward-test strategies on demo and use real money only when you fully understand the risks.
FAQ
What mean reversion timeframes work best?
Four-hour and daily charts give cleaner mean-reverting signals. Lower timeframes can work, but noise is high. Start higher, then drill down only if your logs prove an edge.
Which markets are most mean-reversion?
Major forex pairs and large-cap stock indices often revert to the mean inside ranges. Thin crypto altcoins and news-driven small caps trend more and ignore mean-reverting patterns.
How do I define the mean and spot mean-reverting signals?
Use technical indicators for mean reversion: a 20-50 SMA/EMA as the mean, Bollinger Bands for deviation, RSI or Stochastics for stretch. A touch of the band plus RSI flipping back above 30 (or below 70 for shorts) is a basic mean reversion confirmation signal.
What are common mean reversion failure reasons?
Fresh trend after a breakout, major news, low liquidity, or rising volatility can kill reversion to the mean. If structure shifts to higher highs or lower lows, stand down.
How should I set entry and exit points and stop loss placement?
Enter near support and resistance, not mid-range. Place a stop loss just beyond the level that proves you wrong (often 1-2 ATR outside the band). Exit at the moving average or the opposite band. If price stalls, use a time-based exit.
Does volume and volatility analysis help?
Yes. Volume confirmation adds trust when price turns at a level. Falling ATR favors a volatility trading strategy that reverts; spiking ATR warns that swings may extend past the mean.
Can I mix mean reversion momentum with other methods?
You can. Many traders fade pullbacks inside ranges and switch to momentum trading strategies on breakouts. Write separate rules so you don’t mix signals.
How do I practice trading with support and resistance for mean reversion?
Mark the range boundaries first. Wait for price pattern recognition (e.g., a small rejection wick) at the edge, plus a band touch and RSI hook. No level, no trade.
How do I backtest a mean reversion trading strategy?
Launch Forex Tester Online, add your indicators, and code rules or use no-code blocks. Track win rate, drawdown, and slippage. Forward-test on demo before going live. This keeps risk management in trading front and center.
 Test Mean Reversion strategy with Forex Tester Online
 ไทย
ไทย
 Tiếng Việt
 Polski
 Türkçe
 Nederlands
 Română
 한국어
한국어
 Svenska
