Summarize at:
Markets move fast. Traders need a tool that shows trend, momentum, and possible trades in one look. The Ichimoku Cloud, also called Ichimoku Kinko Hyo, was built for that. It’s a technical analysis system that helps you see where the market stands and where it might go next.
We see it as more than an indicator — it’s a complete map. The Ichimoku Cloud chart plots balance, direction, and potential reversals on one screen. It gives you a forward view of price instead of reacting after the move.
You can trade it on forex, stocks, commodities, or cryptocurrencies — anywhere a trend exists. It may look complex, but once you understand it, it’s practical and clear.
In this article, we explain what the Ichimoku Kinko Hyo Cloud is, how to read it, and how to use it in your trading strategy. Our goal is simple: help you trade with structure, not guesswork.
Ichimoku Cloud Indicator Components
Venturing further into our exploration, let’s demystify the basics of the Ichimoku Kinko Hyo. This indicator is not just a single line or a simple moving average; it’s a complex tapestry woven with multiple components, each offering unique insights into the market’s movements. Imagine it as a sophisticated dashboard that provides a holistic view of market trends and momentum at a glance.
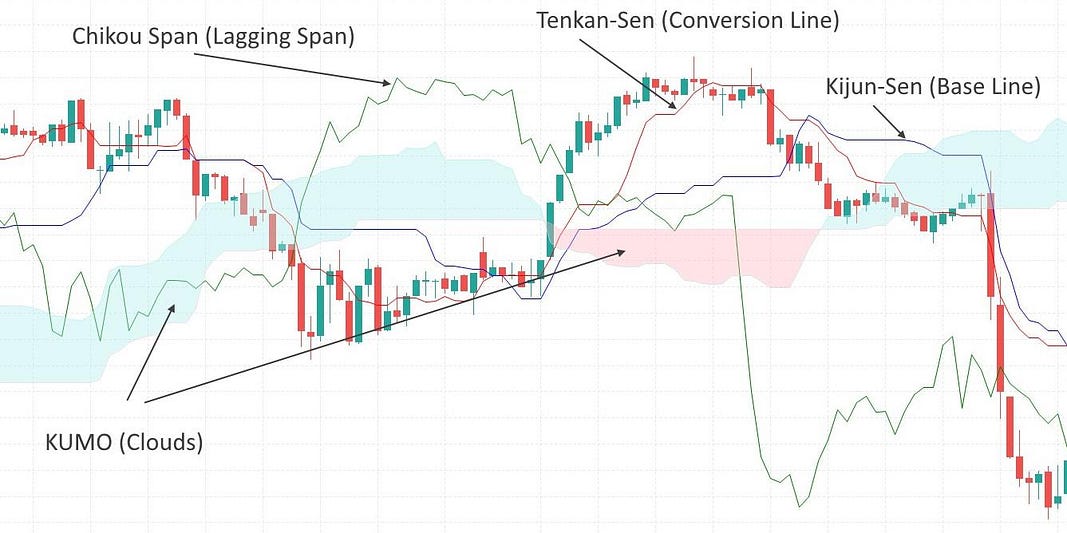
By interpreting these elements collectively, traders can glean a comprehensive view of the market. The Ichimoku Cloud doesn’t just tell us where the price is or has been; it provides a dynamic projection of where it might find support or resistance in the future. This forward-looking feature is what sets it apart from many other technical indicators, making it a favorite among traders who wish to stay a step ahead in the ever-changing dance of the markets.
How the Ichimoku Cloud Is Calculated
The Ichimoku Cloud uses a simple but structured set of formulas. Each line is based on averages of highs and lows over a fixed number of periods. The Tenkan-sen averages the highest high and lowest low over the last 9 periods; the Kijun-sen does the same over 26. Leading Span A is the midpoint between Tenkan-sen and Kijun-sen, plotted 26 periods ahead. Leading Span B averages highs and lows over 52 periods, also plotted 26 periods forward. The Chikou Span shows the current closing price but shifts it 26 periods back in time.

These displacements create the signature Ichimoku Cloud chart, showing both past and projected market balance. Traditional markets like forex or stocks often use the classic 9-26-52 settings, while faster-moving assets like cryptocurrencies may require shorter values (for example, 5-15-30) to match higher volatility. The forward projection helps traders anticipate future support and resistance, while the backward shift of the Chikou Span helps confirm previous trends and reversals.
Interpreting the Ichimoku Cloud
Reading the Ichimoku Kinko Hyo Cloud is straightforward once you understand what each part represents. When price trades above the cloud, it signals a bullish trend; below the cloud means bearish. The cloud’s color reflects sentiment — a green Kumo suggests strength, while a red one shows weakness.
The shaded area between Leading Span A and Leading Span B forms dynamic support and resistance zones. The thicker the cloud, the stronger the market barrier.
Crossovers between Tenkan-sen and Kijun-sen act as short-term trade triggers. A bullish signal appears when Tenkan-sen crosses above Kijun-sen; a bearish one forms when it drops below.
Finally, the Chikou Span serves as confirmation. When it moves above price, it supports a bullish setup; when it lags below, it warns of fading momentum or a possible reversal. By reading these signals together, traders can see where the market stands — and where it’s likely heading next.
Ichimoku Cloud Trading Strategies
With a respectful bow to the land that gave us the Ichimoku Kinko Hyo, we chose the GBPJPY currency pair as our dojo for backtesting. The 4-hour chart is our battleground, the default settings of Ichimoku our strategy parameters, unaltered like the recipe for an ancient matcha tea ceremony.
*Strategies tested on Forex Tester Online
The Rules of Engagement:
For a Buy signal:
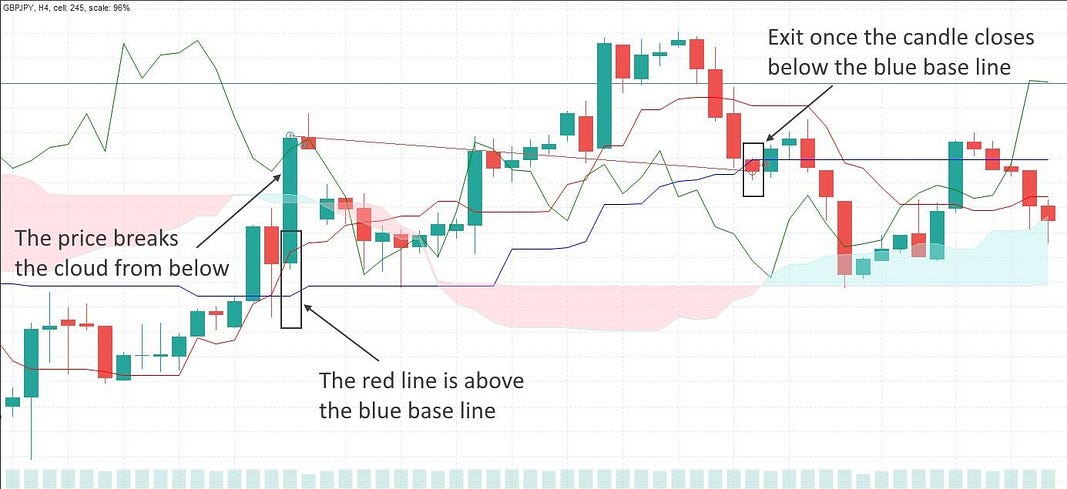
- Cloud Piercing: We await the price to decisively break above the Ichimoku Cloud, with a candle closing above it—this is our initial battle cry.
- Red over Blue: The confirmation comes when the conversion line (red) ascends above the base line (blue), akin to the red disc of the Japanese flag rising over the horizon.
- Retreat Below Base: The strategy dictates a tactical withdrawal once the price candle closes beneath the base line, regardless of whether we’re in the land of profit or not.
For a Sell signal:
- Cloud Descent: We watch for the price to dive below the Ichimoku Cloud, with a candle closing below as if it’s a samurai making a stealthy nocturnal escape.
- Red under Blue: Our confirmation is the conversion line (red) sneaking below the base line (blue) like a whisper of a shadow in the moonlight.
- Advance Above Base: We exit our position once the price candle closes above the base line, whether we’ve secured a bounty or not.
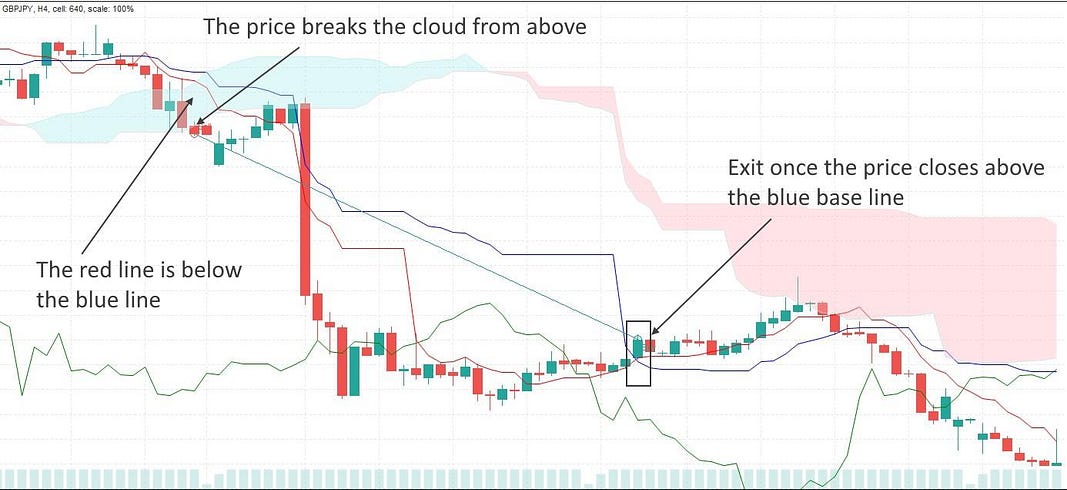
With our strategy set, we embarked on the path of the warrior, seeking to validate the prowess of this ancient indicator in modern markets. The humor and light-heartedness of our journey do not undermine the gravity with which we undertake this mission. As we proceed, we might find that our strategy needs refinement — perhaps a tweak of the time frame or an additional filter for our entries and exits. Or maybe, like a haiku, its simplicity is where its beauty and effectiveness lie.
In the spirit of Bushido, we pursue not just gains but the way of the strategy, the discipline of backtesting, and the wisdom that comes with it.
Practical Applications and Tips
-
Trade only in the direction of the Ichimoku Cloud trend — above for bullish, below for bearish.
-
Use the Tenkan-sen / Kijun-sen crossover as your main entry trigger.
-
Confirm entries with the Chikou Span; it should support the same direction as price.
-
Adjust parameters: shorter periods for cryptocurrencies, standard 9-26-52 for forex and stocks.
-
Treat the cloud as dynamic support and resistance — thicker clouds mean stronger zones.
-
Always backtest on historical market data before trading live.
-
Avoid overloading signals; one clear confirmation is enough.
Related article: Forex Trading Strategy using Ichimoku and RSI Indicators
Backtesting and Algorithmic Trading with Ichimoku
Goal: turn the Ichimoku Cloud into clear rules for algorithmic trading, then test and refine them on an algo backtesting platform.
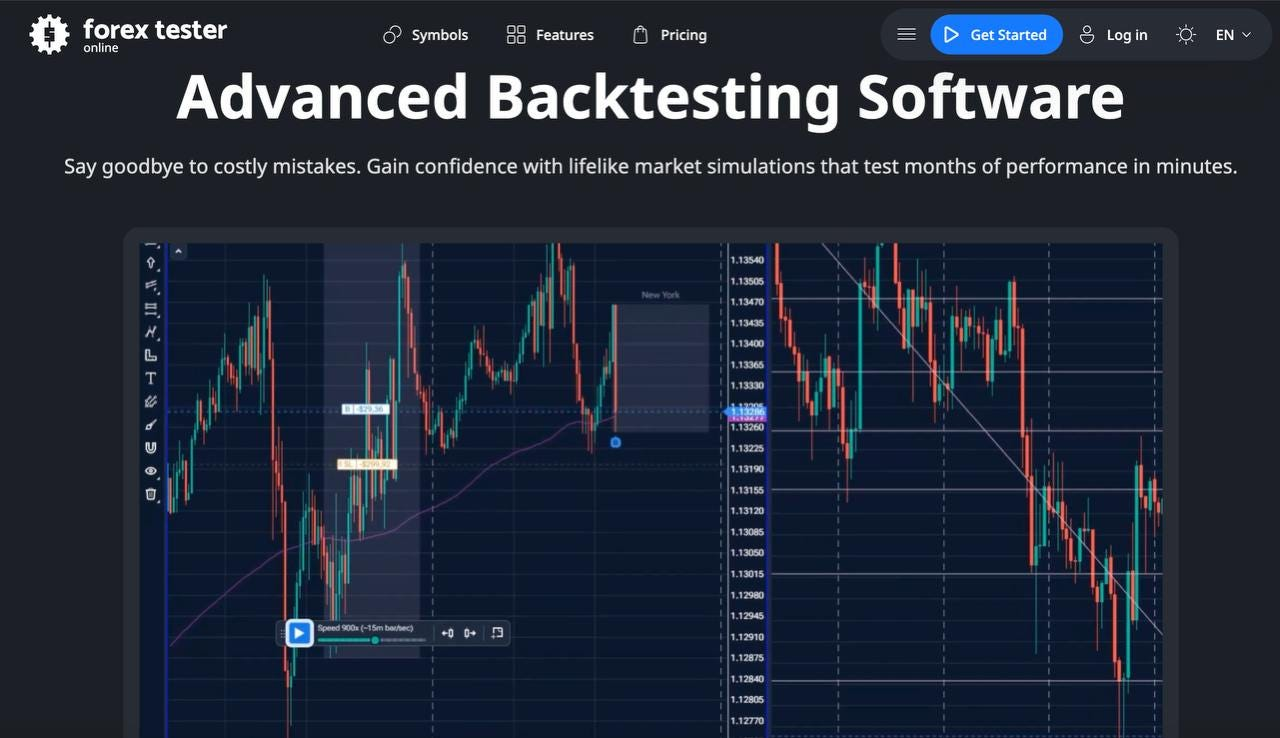
We will use Forex Tester Online backtesting software. It helps traders quickly turn ideas into measurable results. Main features:
✅ 20+ years of tick data
✅ Integrated news feed
✅ Mystery Mode to hide future bars
✅ Custom technical indicators
✅ Prebuilt market scenarios
✅ Detailed analytics and latency logs
✅ Automation with Python or no-code rules
Running a strategy without backtesting is risky. Use Forex Tester Online to verify your idea on 21+ years of historical data before trading it live.
Step-by-Step: Ichimoku Backtesting in Forex Tester Online (FTO)
Get access
Open FTO, log in, choose a plan with tick or 1-min historical market data.
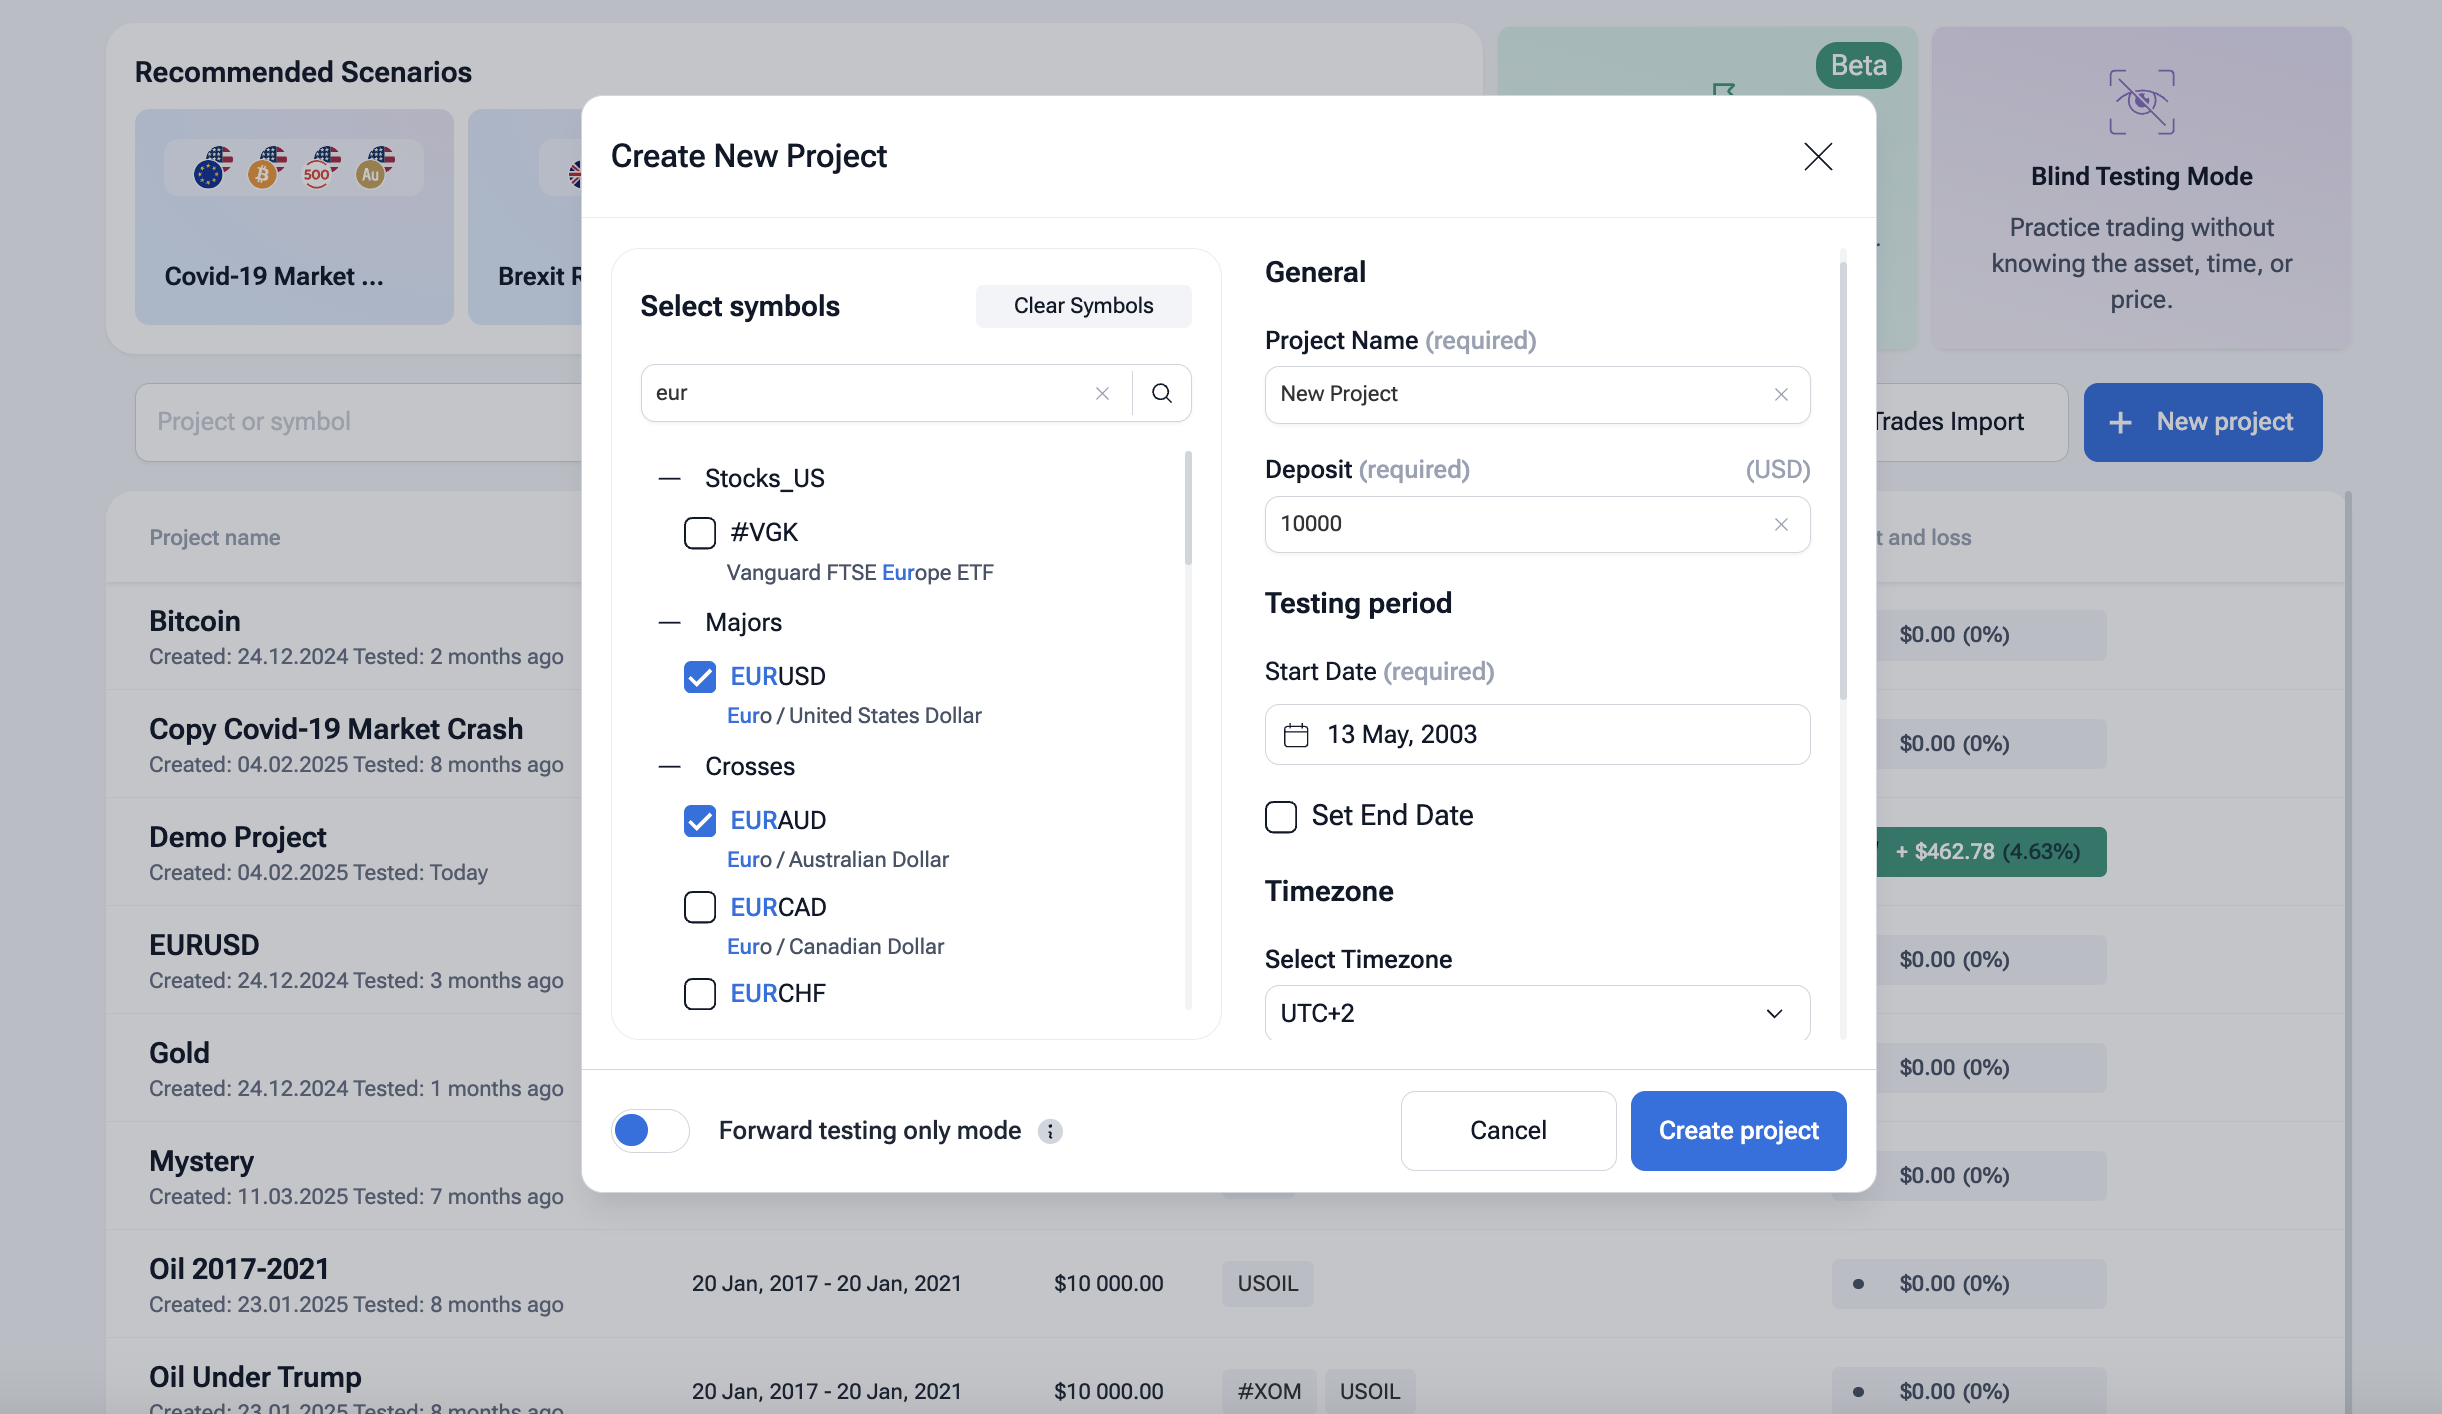
Create a project
New Project → pick symbol (e.g., GBPJPY), dates, time zone, virtual deposit. Enable floating spreads and commissions.
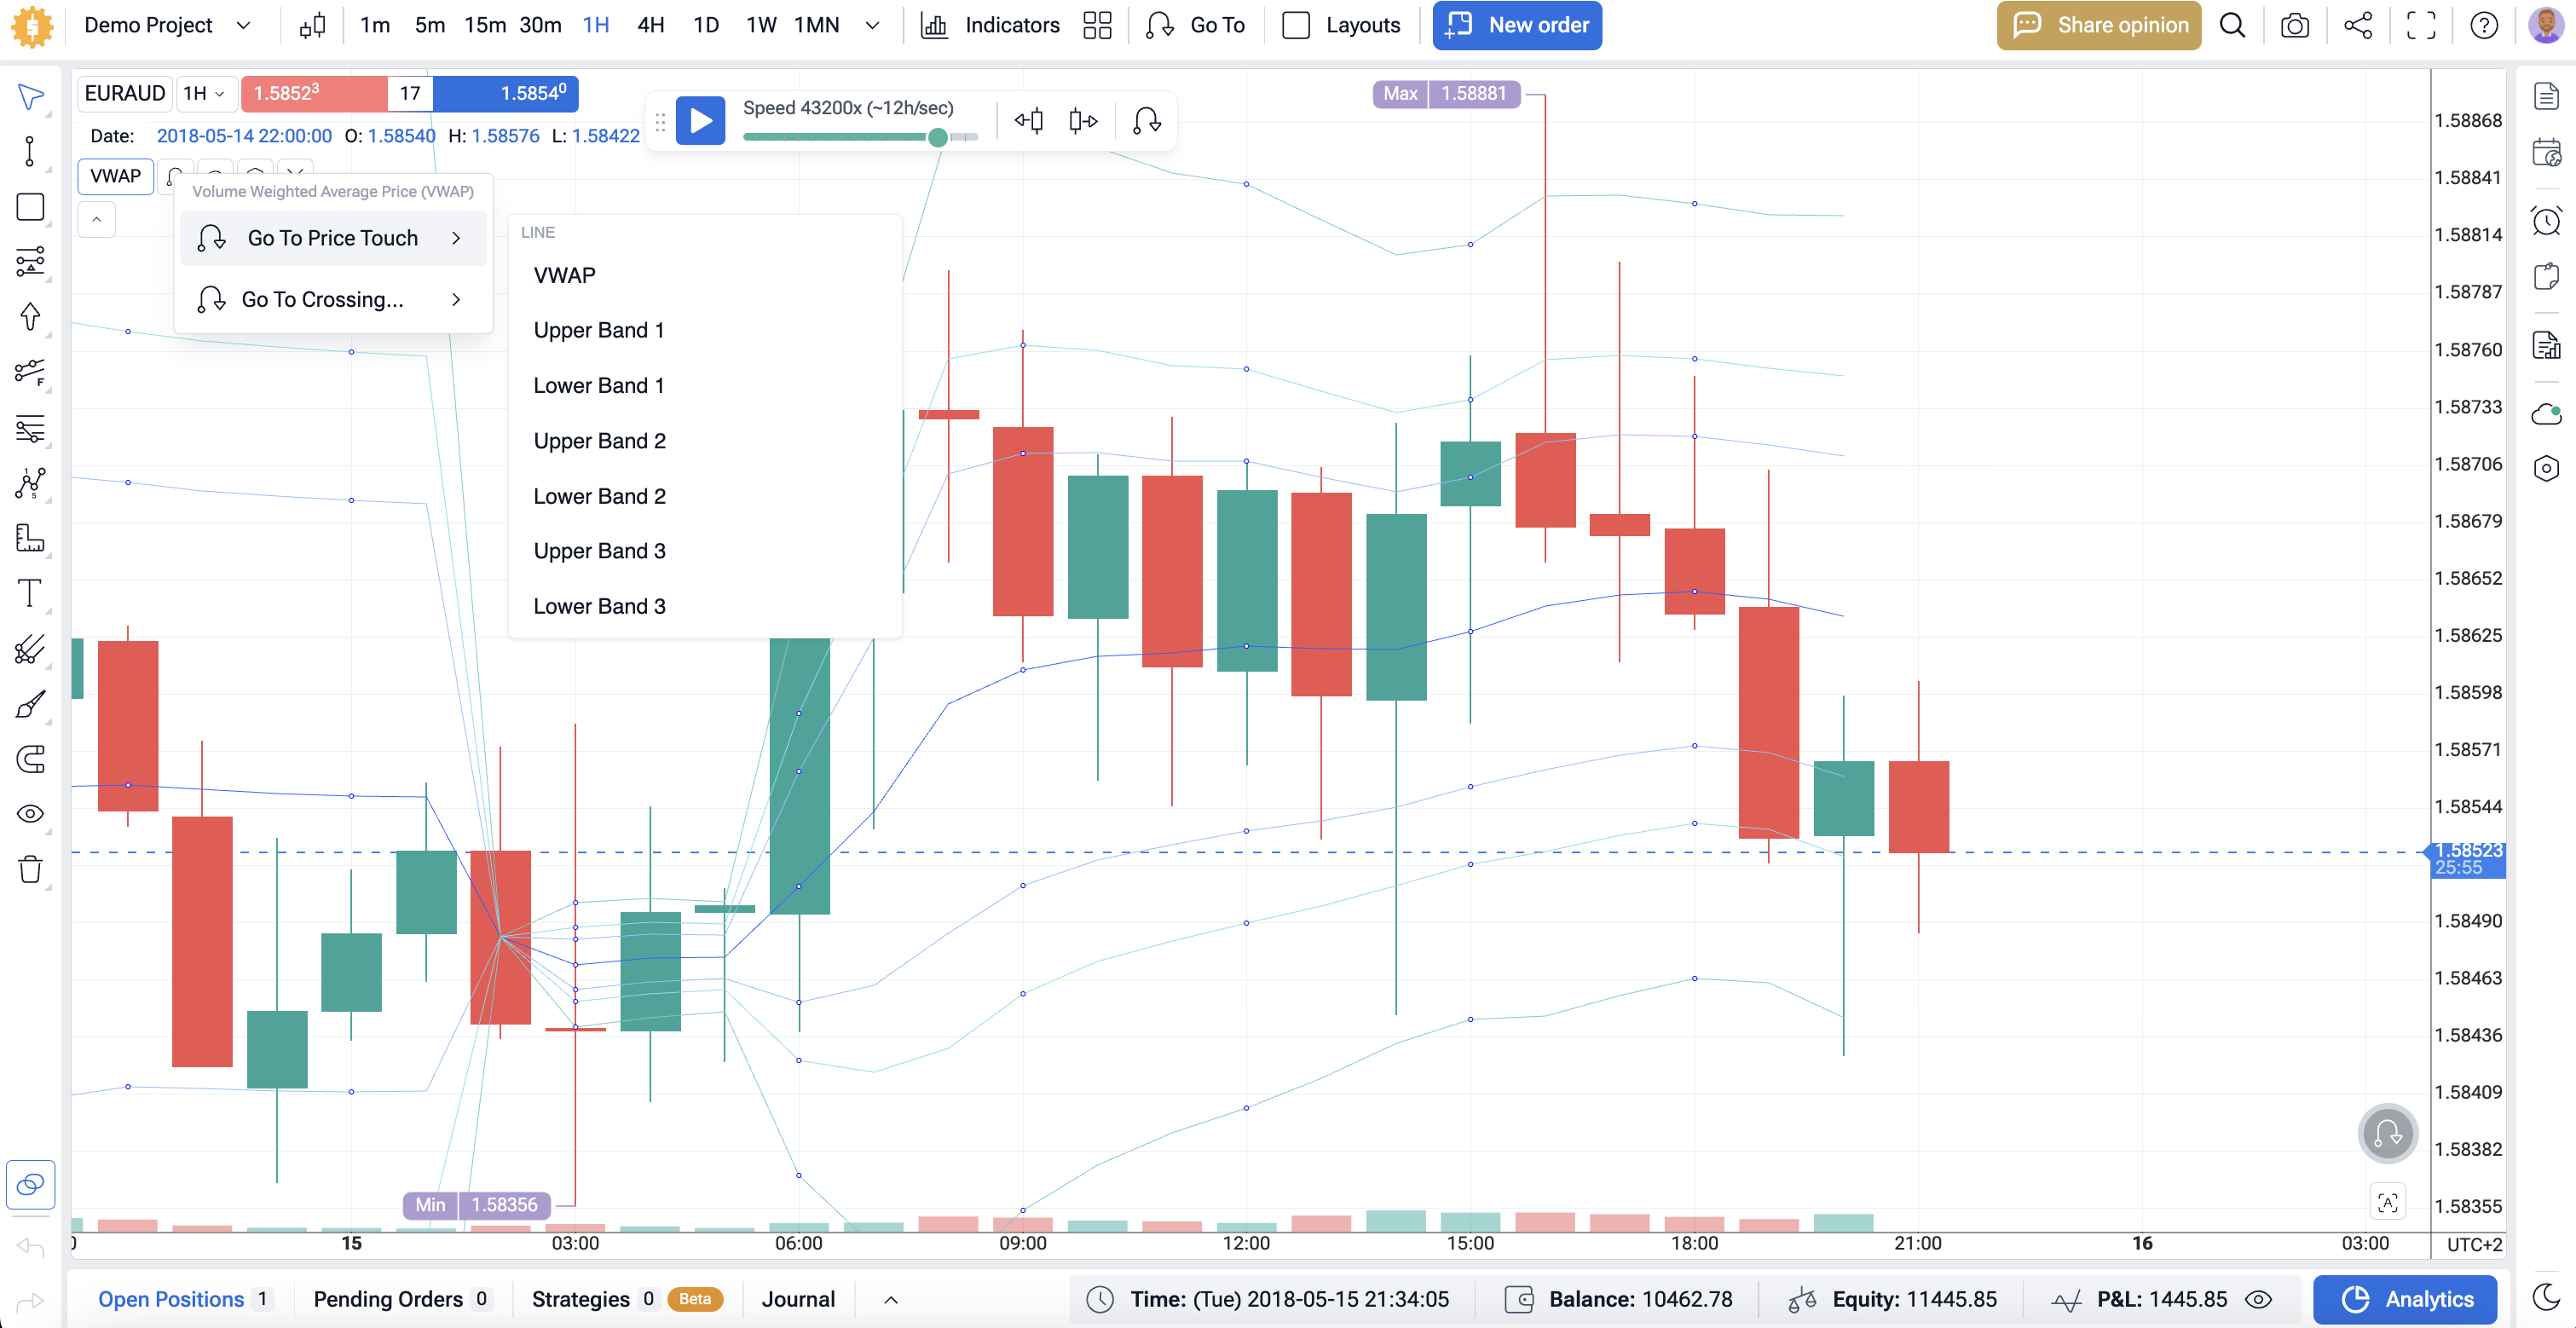
Add Ichimoku
Open Indicators → add Ichimoku Kinko Hyo Cloud (9-26-52 or custom). Save a template with ATR, RSI, or VWAP if needed.

Define rules
Long: price above cloud, Tenkan > Kijun, Chikou above price; enter on next bar or Kijun pullback.
Short: mirror rules below cloud.
Exits: Kijun close, opposite cross, ATR×N stop, or fixed time exit.
Automation
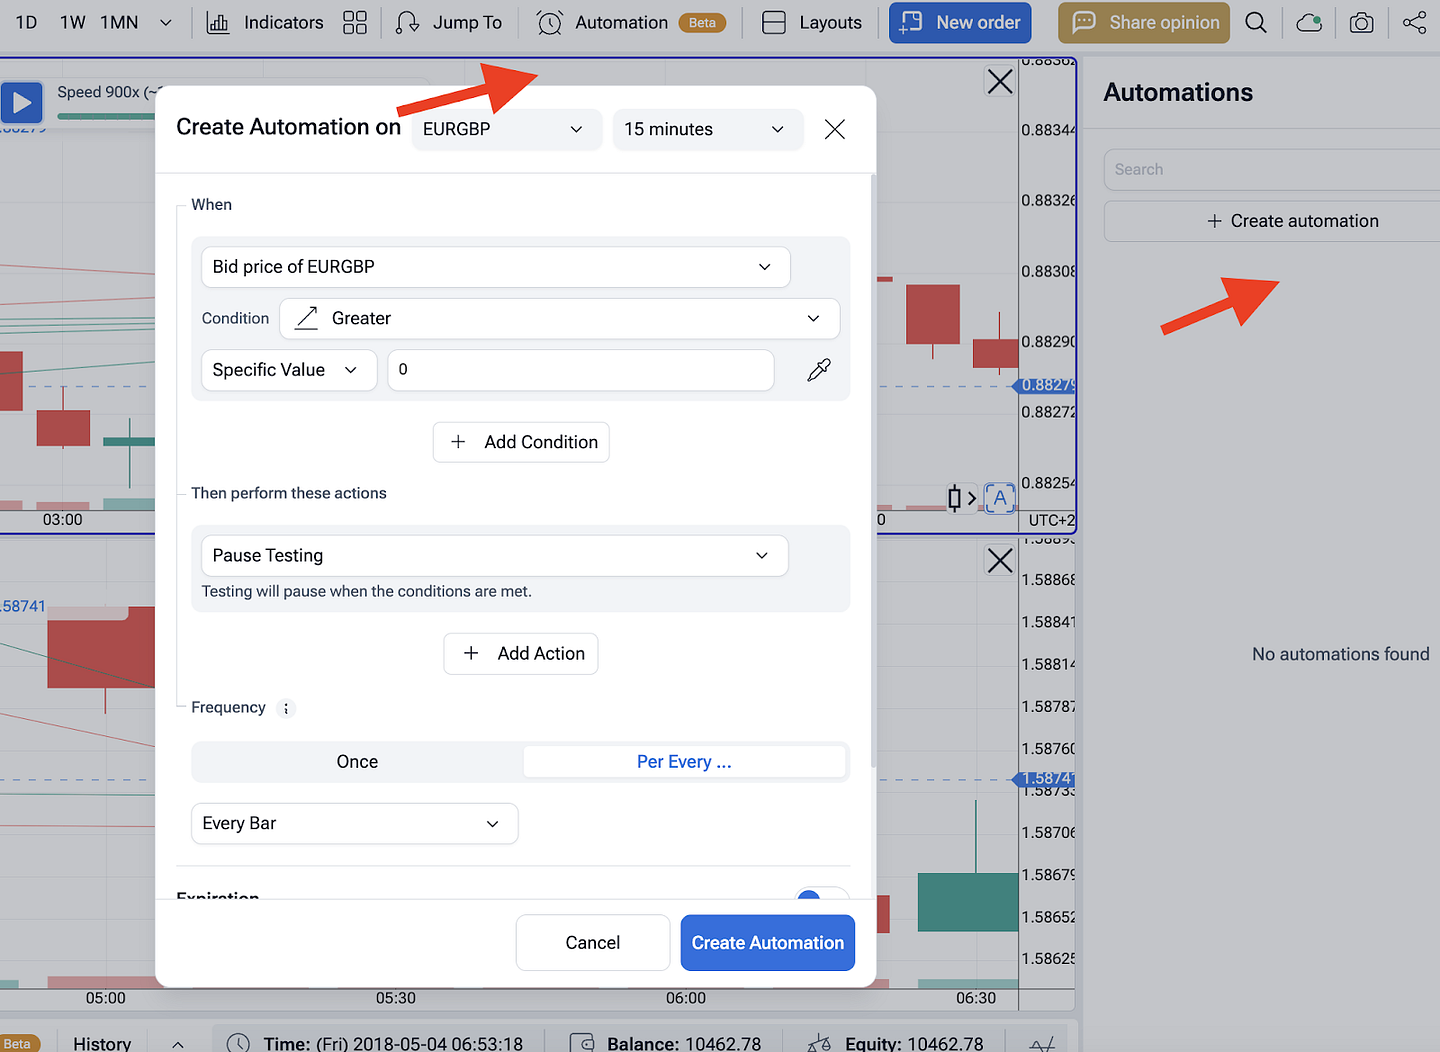
Go to Automation → create a rule set with your entry/exit logic. Choose tick-by-tick or bar-by-bar playback. Turn on News Marks if your filter ignores high-impact events.
Run the backtest
Press Start. Use Jump To to fast-forward. Watch trades on the Ichimoku Cloud chart in real time.
Review analytics
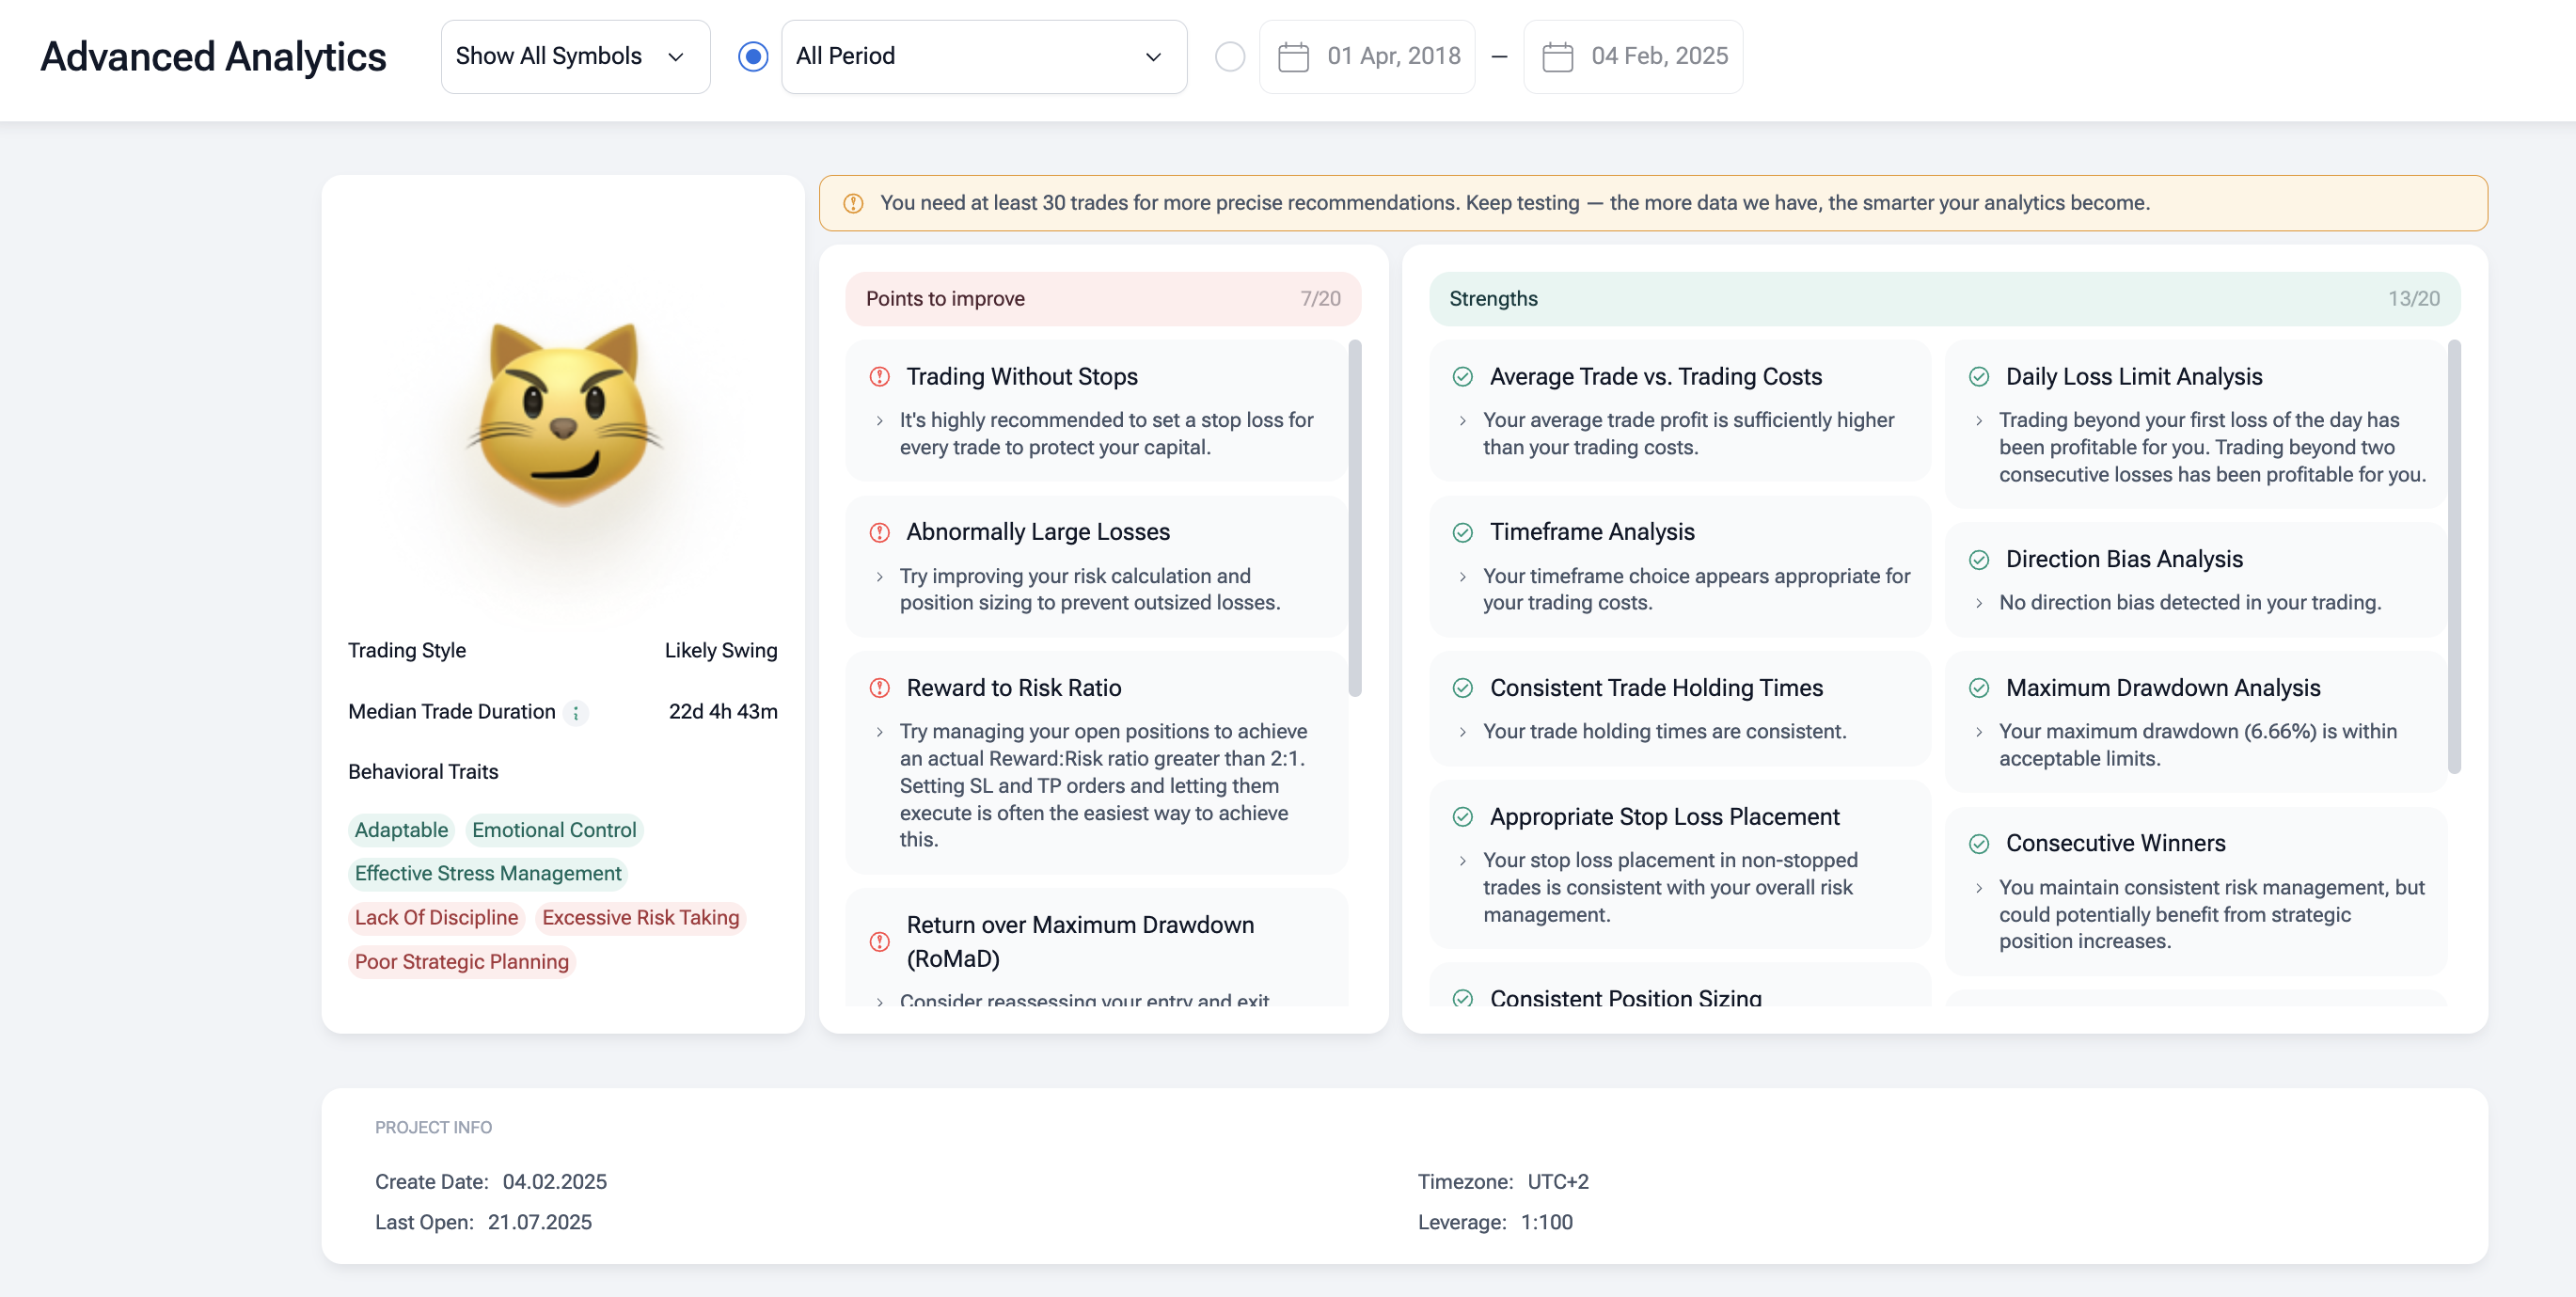
Open Analytics → check win rate, payoff, drawdown, MAE/MFE, equity curve. Export trades to CSV for deeper stats.
Optimize
Adjust Tenkan/Kijun/Span periods, ATR multiples, session filters. Re-run on out-of-sample dates. Do a simple walk-forward. Keep a version log.
Promote to live
Demo first. Track slippage and fills. Only then connect your trading bot to your broker/VPS.
Examining the Results: The First Descent Through the Clouds
As we unfurl the tapestry of our Ichimoku Cloud backtesting journey, we find ourselves peering over the edge of a rather steep cliff. The number crunching has spoken: a loss of $5,074, leaving our trading armor feeling a tad lighter. This outcome, akin to a samurai discovering his sword is actually made of bamboo, is, to put it mildly, quite disappointing.
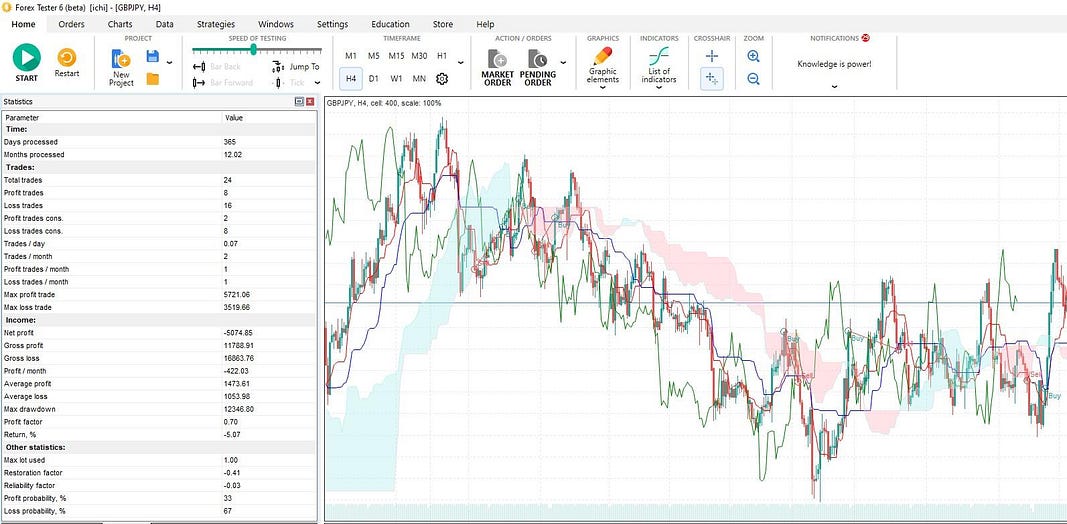
Despite the balance of average wins to losses sitting comfortably in what one might consider a “safe zone” with a risk-to-reward ratio hovering near 1:1.5 ($1,053 vs $1,473), it’s the outliers that have us raising an eyebrow. A solitary victorious trade netting $5,721 and a most ungenerous single loss of $3,519 have us questioning the loyalty of this strategy.
These rogue waves in our sea of data further erode our confidence, especially when considering the slim total of 24 trades over a year-long campaign.
Observations from the Front Lines:
- The Outlier Effect: With such erratic swings, these outliers have the power to flip our statistics on their head with just one more trade, profitable or not. It’s like relying on a fortune cookie for investment advice — one that could just as easily predict a windfall as a downfall.
- The Confirmation Conundrum: Our so-called confirmation signal, rather than being the trusty sidekick we hoped for, turned out to be more of a mischievous fox spirit. We found ourselves waving goodbye to several profitable trades that slipped through our fingers, suggesting this filter might not be the ally we thought it was.
- The Promise of the Cloud Breach: One silver lining (or should we say, cloud lining?) is the initial breach of the Ichimoku Cloud. This signal appeared to be a reliable herald of a trend ready to don a new kimono, indicating a potential trend reversal.
What’s the takeaway from this episode of our market saga? It seems we need a more cunning exit strategy, one that allows us to bow out gracefully from trades, retaining our honor and hopefully, some profits too. There lies the possibility that somewhere in the shadows, a more efficient method is waiting to be discovered, one that will allow us to harness the full power of the Ichimoku Cloud without getting caught in the rain.
As we contemplate our next moves, we must remember the old adage: “Even monkeys fall from trees.” Even the best strategies can falter, but with each misstep, we learn, adapt, and become more adept in the art of trading. Let’s sharpen our blades for the next iteration.
The Second Iteration of Backtesting: Hosting RSI
In the grand narrative of our backtesting odyssey, we’ve arrived at a new chapter, where we invite the RSI (Relative Strength Index) to the strategy table, hoping it will play the role of the wise sensei to our eager Ichimoku apprentice.
Rules Reforged for Ichimoku Strategy
- The Timeframe Transition. We switch our gaze from the 4-hour horizon to the bustling streets of the 1-hour chart. Here, the market’s heartbeat is quicker, allowing us more opportunities to draw our trading sword with the intention of gathering a larger sample size, thereby hoping to bolster the reliability of our statistics.
- The Stop Loss Strategy. With a pinch of superstition and a nod to cultural nuances, we set our stop loss at 400 points. In Japanese culture, the number 4, or ‘shi’, shares pronunciation with the word for death. So why not stop the life of unsuccessful trades at this point?
- The Confirmation Bypass. The conversion line’s position will no longer be our gatekeeper. Instead, we shall enter the trade based on the cloud breakout alone, forgoing additional confirmation like a warrior trusting his instincts.
- The RSI Profit-Taking Pivot. We aim to grab profits when the RSI ascends into the overbought realm above 70 for long trades or dips below 30 for shorts. These thresholds will be our signposts, guiding us on when to pocket our gains. However, should the RSI already dwell beyond these realms at the time of an Ichimoku signal, we shall bypass the signal, avoiding potential traps.
- The Lucky Number Eight. The RSI period is set to 8, an homage to Japanese culture where it symbolizes wealth and prosperity—may it bring abundance to our trades.
- The Art of Reversal. Should the winds change and we receive a signal opposite to our current position, we’ll perform a swift about-face, reversing our trade to align with the new direction.
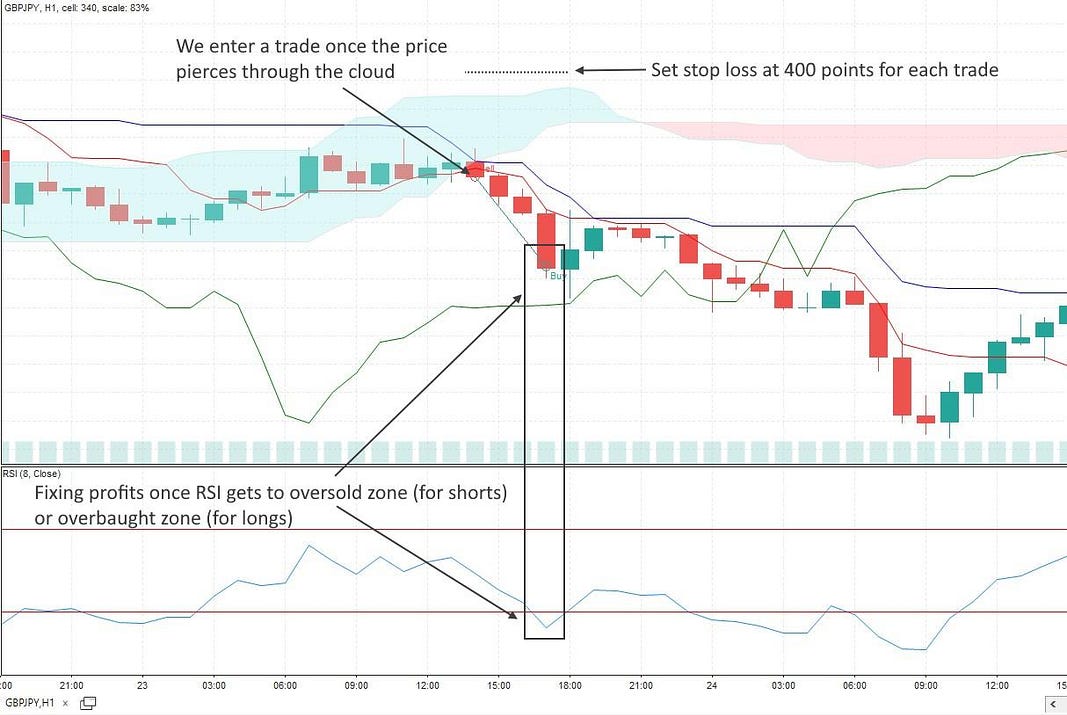
These changes aren’t just whimsical. They’re our way of folding in layers of strategy, much like a blacksmith forging a katana, hoping that each fold will bring strength and resilience to the blade. We venture into this with a blend of educated guesses and respect for the rich culture from which the Ichimoku indicator originates.
Reflections on the Second Iteration of Backtesting Ichimoku Strategy
The second iteration of our backtesting journey, with the RSI as our navigator, has brought us to a more prosperous port. The numbers tell a tale of uplifted spirits: a net profit of $8,900.46, with 85 trades over the course of the year.
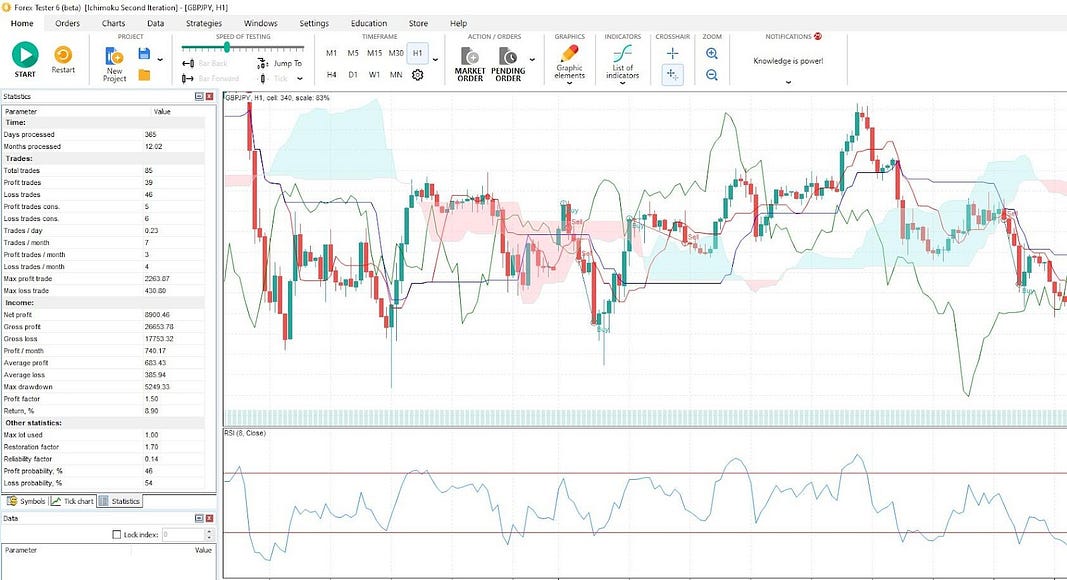
39 of these were profitable trades, an encouraging sign that our strategy may be aligning with the mysterious rhythms of the market. Yet, our trading sense tingles with the notion that our profits could flow more freely.
The Next Step. Third Iteration of Backtesting Ichimoku Strategy
As our backtesting tale unfolds, we find ourselves at a pivotal juncture, sharpening our tools and refining our tactics. Our previous forays have equipped us with valuable insights, and now we stand poised to adjust our grip, ready to double our efforts. Literally. It’s time to explore a strategy that wields not one, but two proverbial swords in the dojo of the market.
Strategizing for the Next Wave:
- Doubling. We’re considering doubling the lot size. It’s like sending in two ninjas instead of one. If the first one completes the mission at the RSI threshold of 70 or 30, we swiftly move the second to safety at break-even.
- Profit Maximization Maneuver. The second lot, now at less risk, awaits its moment of glory. If the RSI hits the heady heights of 90 or the depths of 10, we’ll take our profits, a bit like catching a falling star in the palm of our hand.
- Staying Agile. True to the way of the samurai, we remain ready to reverse our position with each new signal. Like a skilled warrior adapting to his opponent’s moves, we switch stance with each breach of the Ichimoku Cloud.
- The Dance of Entry and Exit. There will be moments of delicate balance, where the closing of the second lot and a new entry won’t align — specifically if the RSI is above 70 or below 30 at such times. In these instances, patience becomes our virtue, as we wait for the next clear call to action.
The Final Chronicle: Unveiling a Strategy in Bloom
As we unfurl the scroll to reveal the final act of our backtesting drama, the numbers gleam back at us, a testament to the evolving art of our strategy. With a net profit of $23,179.51, our trading journey has brought forth a garden of gains that could make even the most stoic samurai crack a smile.
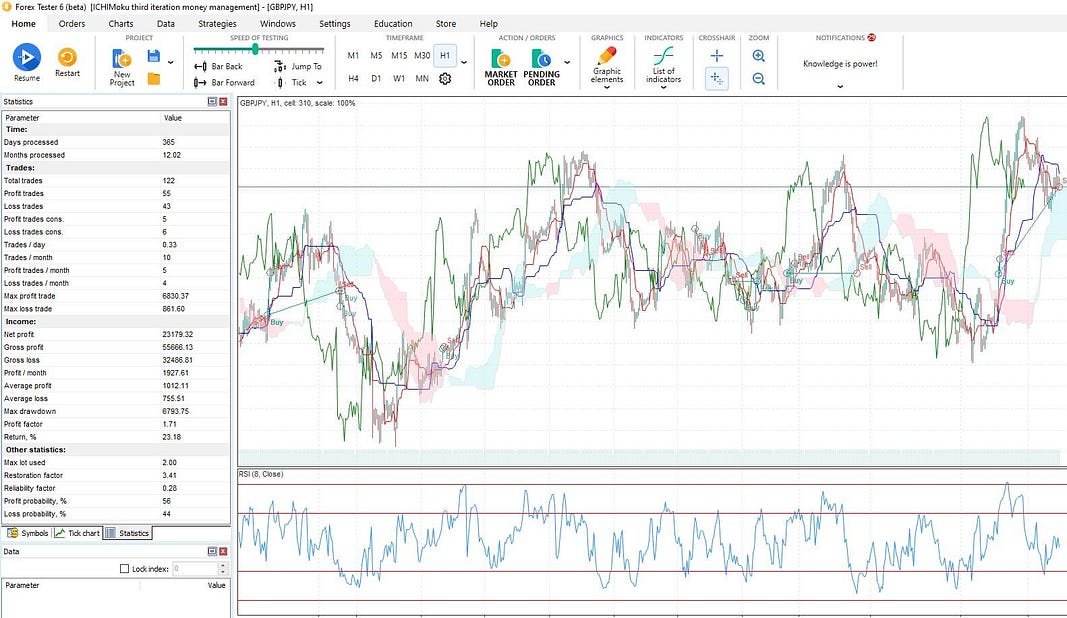
The strategic milestone is as clear as the full moon on a crisp Kyoto night: even as we ventured boldly, doubling our lot size, the shadow of risk did not stretch significantly further than before, with the drawdown in this third act (a manageable $6,793) only slightly upstaging that of the second ($5,249). It’s as if our trading katana has been sharpened to slice more deeply, yet without the blade growing brittle.
Yet, as any master of strategy knows, the quest for improvement is as endless as the horizon. Our current setup, while effective, is not the final brushstroke on this canvas. The Ichimoku settings whisper of untapped potential, the RSI levels beckon for a fine-tuner’s touch, and the fixed stop loss we’ve employed awaits scrutiny.
Adjust, experiment, and refine. There is a tapestry of data waiting for your interpretative eye, a wealth of charts yearning for your unique strategy. May your journey through the markets be as enlightening as it is profitable.
Conclusion
The Ichimoku Cloud gives clear structure: trend, momentum, and zones in one view. Turn those rules into algorithmic trading logic, then test on historical market data with an algo backtesting platform like Forex Tester Online. Keep signals simple, manage risk, and iterate. If the stats hold up, scale; if not, refine the trading strategy and test again.
Forex Tester Online
Trading simulator to backtest Ichimoku Kinko Hyo Strategy
 ไทย
ไทย
 Tiếng Việt
 Polski
 Türkçe
 Nederlands
 Română
 한국어
한국어
 Svenska

