Summarize at:
“Time to sell Bitcoin?”
This question has echoed through crypto trading communities when Bitcoin was at $50,000, $10,000, $1,000, and it remains just as relevant now that six-figure prices have transformed from a HODLer’s fantasy into a tangible reality.
Of course, there are those who plan to leave their cryptocurrency as an inheritance to their descendants, along with their ancestral estate in Dublin, but we’re not talking about long-term investments here.
Traders who profit from market fluctuations — or simply speculators — must know how to lock in profits from successful trades at the right time, perhaps adjust their trailing stops, or if their trading strategy involves counter-trend trades, identify reversals in a timely manner.
The strong trending nature of cryptocurrencies, combined with their volatility, favors both those who follow the trend and those brave souls who, like the protagonist of Dreiser’s “The Financier,” are willing to wait patiently for long periods until that moment when everything is crumbling and fear and chaos reign in the market — to then diligently strike while the iron is white-hot and build their fortune.
So when should you sell Bitcoin?
Looking at the historical chart, everything seems deceptively simple. “Look right here — well, practically anywhere — we buy, and here we sell.”
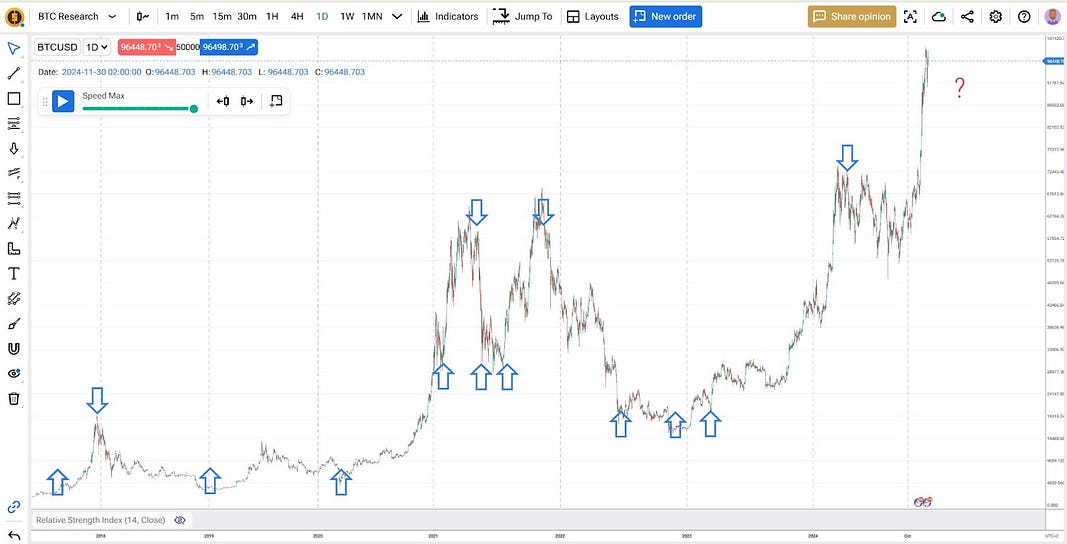
Laughing? Yes, it is rather amusing to think that by looking at a historical chart, one could so easily determine the perfect entry and exit points. Yet at each of these crucial moments, thousands of traders successfully sold Bitcoin at its peaks and bought at its bottoms. Many of them could honestly explain their reasoning and strategic planning behind these decisions.
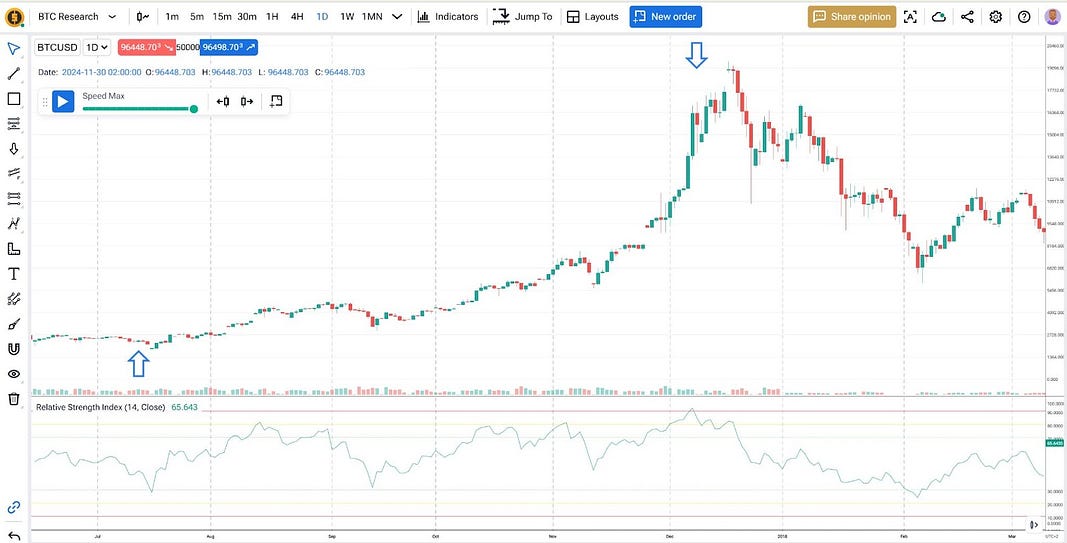
“It was obvious that Bitcoin was overbought,” a trader who sold at the end of 2017 would tell you, and they’d be absolutely right. Even the simplest 14-period RSI on daily charts showed readings above 90.
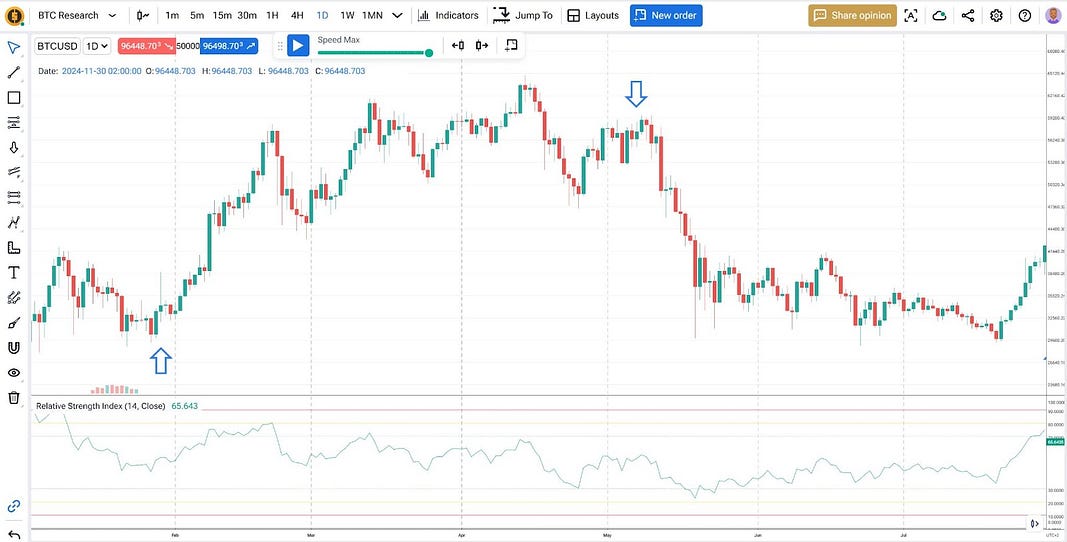
“You couldn’t ignore such a beautiful triple top pattern,” a technical analysis enthusiast would explain, describing how they went short from $60,000 down to $30,000 per BTC.
Moving average crossovers, volume analysis, ICT concepts, fundamental analysis — there might be more methods to predict trend reversals than there are traders in the world.
So again, when is the right time to sell Bitcoin?
Testing a Simple RSI Overbought Strategy for Selling Bitcoin
Let’s say those who recommend selling on overbought conditions are right. OK. But let’s put this to the test.
The statistics for a trading system of “sell when RSI>90 on daily timeframe and take profit after a 60% drop” would look impressive, but with one tiny detail — a sample size of one trade is considered statistically unreliable. Funny enough, the crypto market, in all its historical vastness, just hasn’t bothered to give us more of these situations. Who would have thought?
So let’s get a little more conservative and consider RSI reaching 80 as our trigger. We’ll also be more modest with our profit targets. We’ll use the first Fibonacci Retracement level for our take profit, closing our profitable short position when Bitcoin drops by 23.6%.
Here are the specific trading rules for this strategy:
Trading Rules:
- Timeframe: Daily chart
- Primary signal: RSI reaches or exceeds 80
- Entry type: Short (sell) position
- Entry timing: On the daily candle close after RSI signal
- Take Profit: First Fibonacci retracement level (23.6% drop from entry)
- Position size: One Bitcoin (1 BTC) per trade
- Order type: Market order for entry
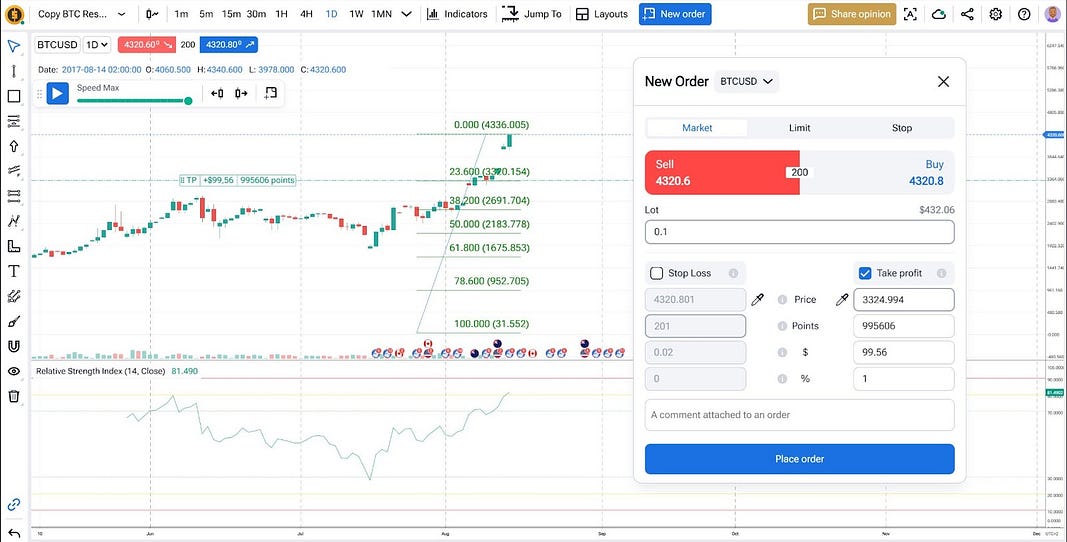
Let’s roll.
The beginning was quite promising. Trading with one lot yielded an average profit of $1,477, and the win rate across our backtesting history hit an impressive 80%.
But then we ran into one tiny little problem. Our “system” blew up to a margin call on just the fifth trade — a position that dragged on for a year and a half, from April 2019 to December 2020. Talk about a strategy stress test!
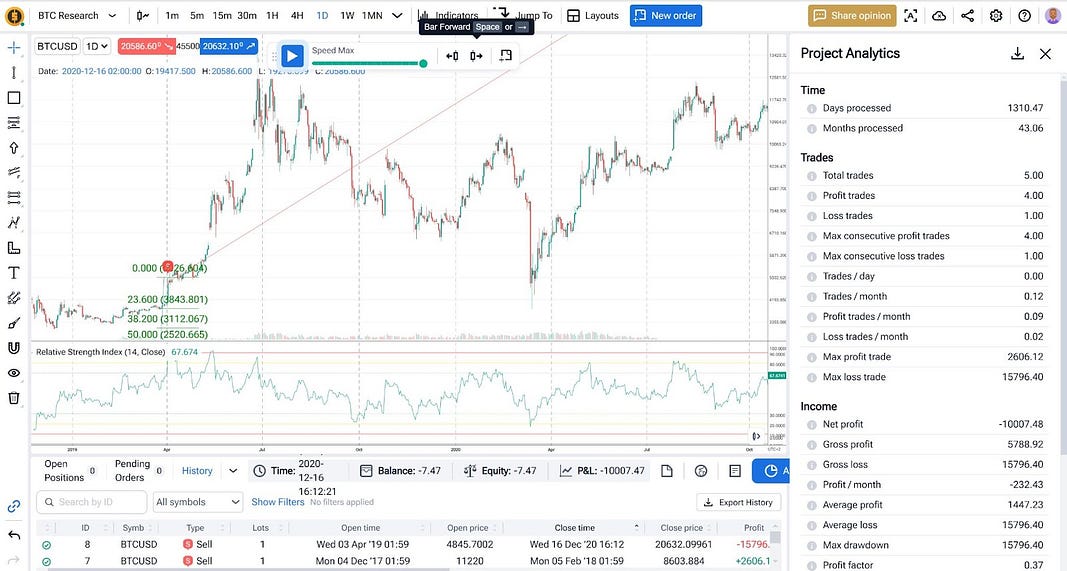
Let’s address three major issues our backtest revealed:
- Position Sizing Paradox. Sure, we could trade with smaller position sizes to reduce margin call risk. But we’re targeting rare market situations here — to profit significantly from these opportunities, the stakes need to be substantial enough.
- Capital Requirements Over Time. A crucial nuance revealed by this deep historical backtest is the ever-increasing margin requirements. A Bitcoin lot typically equals one coin, and the math is brutal: $10,000 in capital that could buy you ten bitcoins (10 lots) in early 2017 wouldn’t get you even a single lot a few years later.
- Missing Risk Management. Perhaps the most obvious improvement would be adding a stop loss. For counter-trend systems, this isn’t just an option — it’s a must-have. You wouldn’t drive a car without brakes, would you? Similarly, trading against the trend without risk limits is a recipe for disaster.
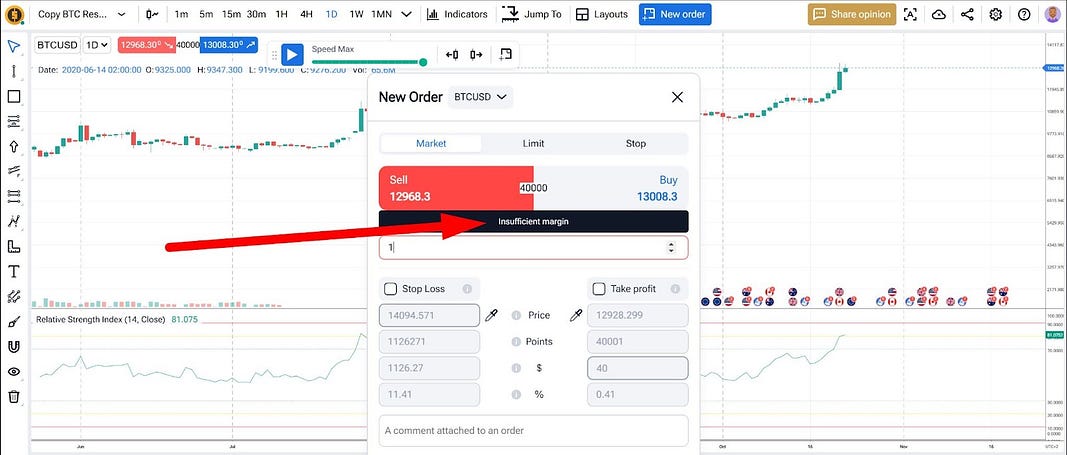
More sophisticated entry rules with additional filters might increase our success rate. But before we dive into complex filters, let’s address these fundamental issues first.
Second Iteration: A Fixed Risk Approach to Sell Bitcoin
Given our findings, our trading approach needs to be tied either to a percentage of capital or to a fixed dollar risk amount. Forex Tester Online allows us to test both variants. Let’s set a fixed risk of $1,000 per trade. Yes, this is still quite substantial for a $10,000 starting capital, but then again, this isn’t your standard trading research. We’re attempting to catch rare but highly potent situations where cryptocurrency prices experience severe shakeups — and with such opportunities come proportional risks.
Here’s our revised trading setup for the second iteration of our backtest:
Trading Rules:
- Timeframe: Daily chart
- Primary signal: RSI reaches or exceeds 80
- Entry type: Short (sell) position
- Entry timing: On the daily candle close after RSI signal
- Take Profit: First Fibonacci retracement level (23.6% drop from entry)
- Stop Loss: Mirror distance above entry (same distance as take profit)
- Position size: Calculated to risk $1,000 per trade
- Order type: Market order for entry
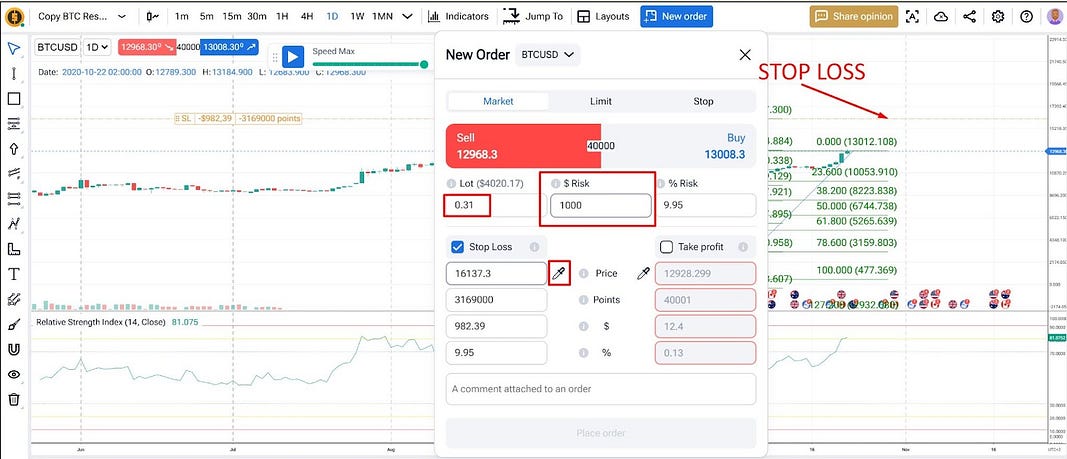
Backtesting proves to be an excellent opportunity to think through the finer details of our trading system. For instance, it doesn’t take long to realize that “RSI touching 80” is not a specific enough rule. Here’s a practical scenario: after taking a stop loss, we’re sitting in cash while the price continues to hover in the overbought zone. What do we do?
This highlights an important aspect of system design — we need clear rules for every possible market scenario. Let’s break down the specific situation:
- We enter a short position when RSI > 80
- Price moves against us and hits our stop loss
- RSI remains above 80
- Do we:
- Enter another short position immediately?
- Wait for some specific condition?
- Skip this opportunity entirely?
This is exactly the kind of edge case that backtesting helps us identify. Just saying “sell when RSI is overbought” isn’t enough. We need precise rules for re-entry scenarios.
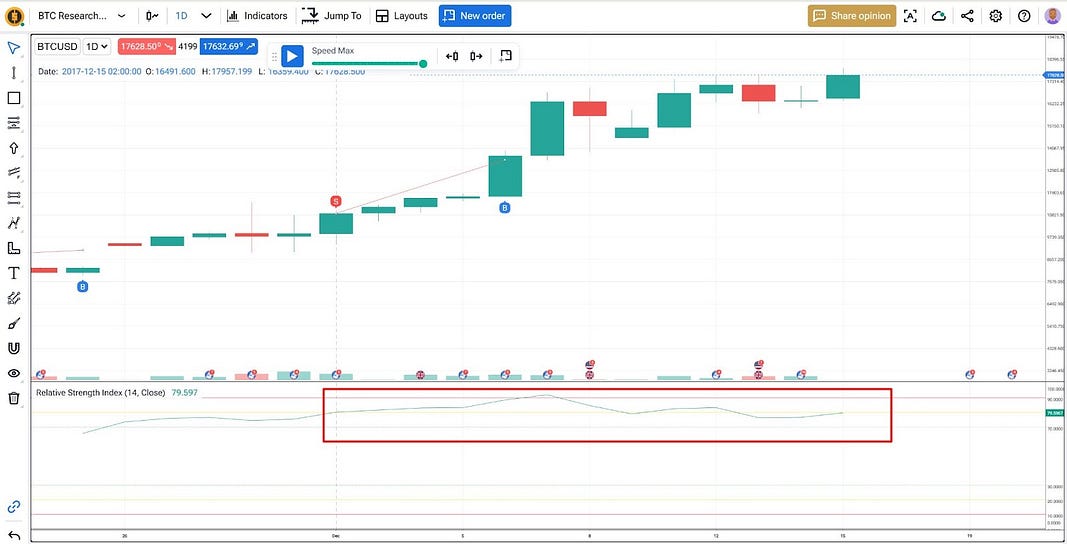
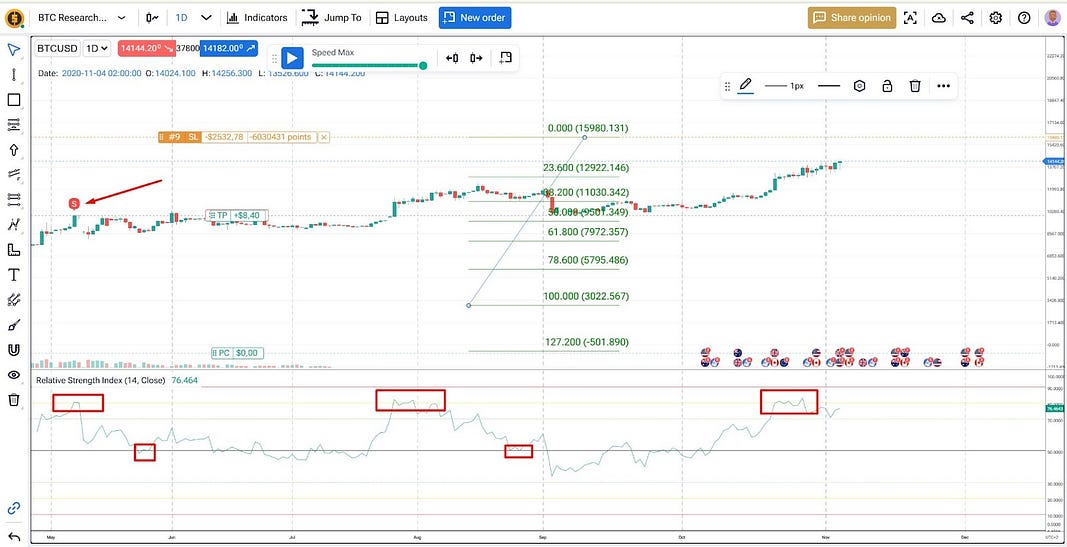
There are many possible solutions, but we’ll take the simple route. We’ll wait for RSI to pull back to its midpoint value of 50 before allowing ourselves to consider new trade entries when RSI touches 80 again on a closed candle.
But this raises another question. What if we have an open position and receive a new sell signal? Like in this situation:
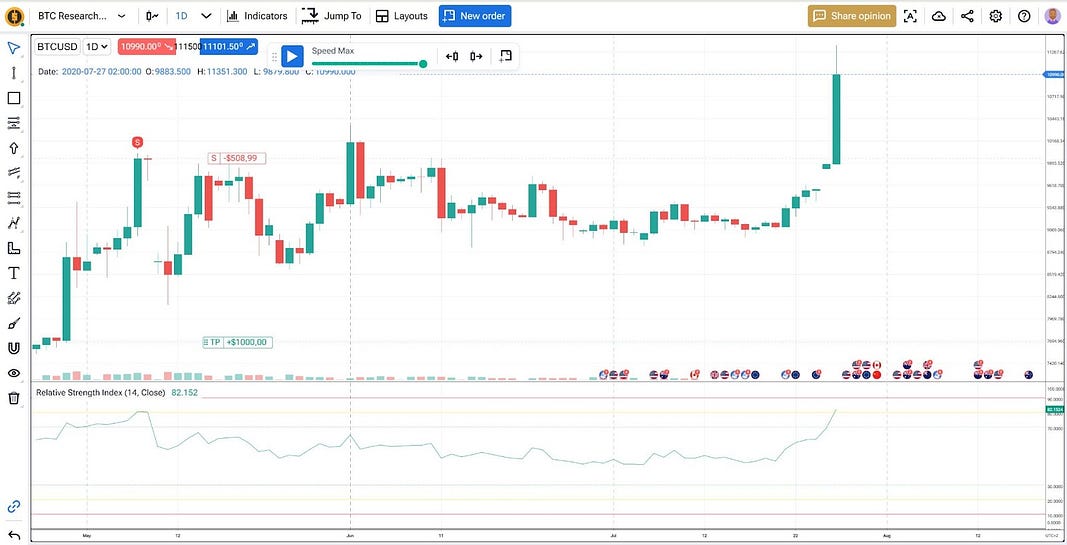
Should we add to the existing position? Move our stop and take profit levels? Or leave everything as is? While we can’t know in advance which choice would be most effective, we’ll take a pragmatic approach: we’ll adjust the stop and take profit levels of our current open position to align with the new market conditions. We’ll move both levels higher, to where we would have placed them if we were entering a new short position now.
Here’s the logic behind this decision:
- We avoid pyramiding (adding to position) which could increase our risk exposure
- We acknowledge the new signal by adjusting our risk points
- We maintain our original position size while adapting to new market conditions
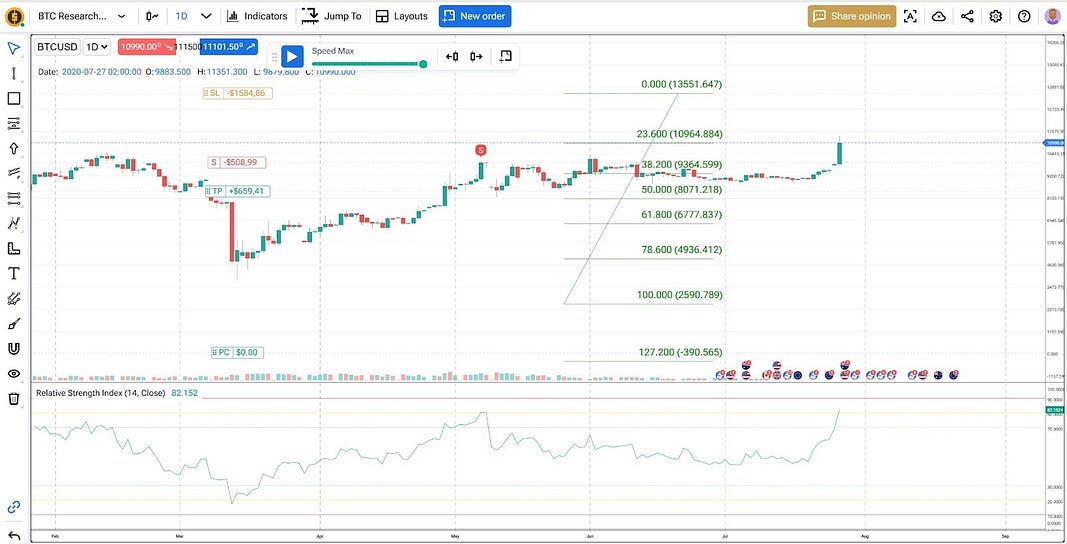
Sometimes this maneuver will need to be repeated several times in succession, as our trades on the daily timeframe can last for months, requiring constant adaptation to market conditions. Take this example: after opening our short position, the price has already pulled back to RSI 50 twice and then returned to the overbought zone according to our indicator.
Well, backtesting this strategy across Bitcoin’s entire available history has demonstrated the futility of shorting this cryptocurrency based on RSI readings.
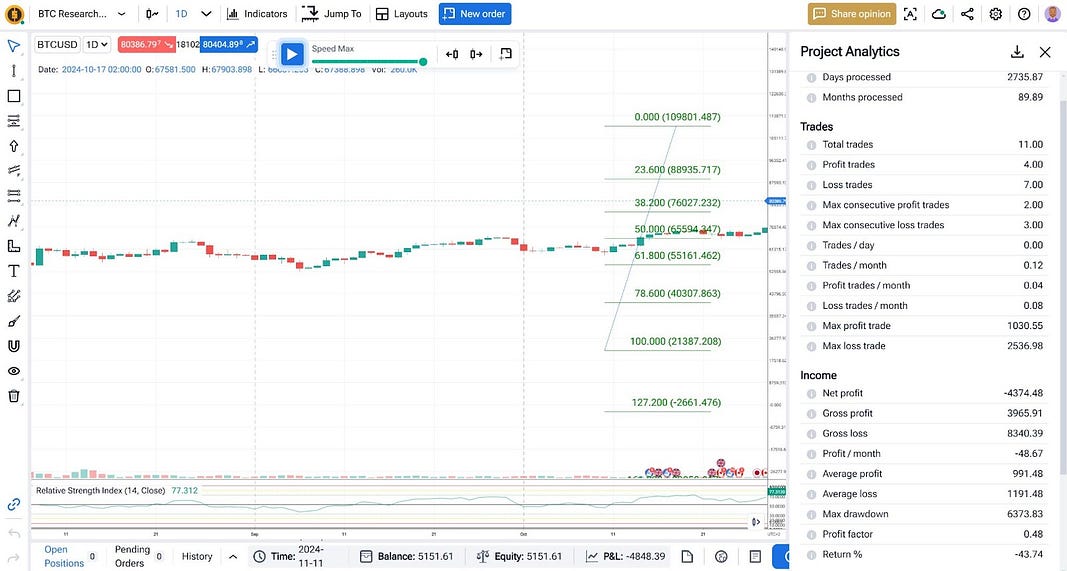
Here are the sobering statistics:
- 7 losing trades out of 11 total trades
- Maximum drawdown: $6,373
- Overall loss: 43.7% of initial deposit
Our sample size is still too small for truly reliable statistical conclusions, but let’s be real here — we’re looking for rare situations on higher timeframes, so the next generation of traders might be the ones to finally get a hundred trades for proper statistical significance. Based on our current data, though, we can make one clear conclusion: this is a very, very poor strategy.
Could we try to improve this strategy’s performance? Sure we could.
We could tinker with take profit and stop loss levels, add trailing stops, or adjust indicator parameters. We could even switch to using RSI divergence signals instead of straightforward RSI readings. Crypto market veterans will certainly remember late 2017, when RSI divergence predicted the 84% price drop that followed the new all-time highs.
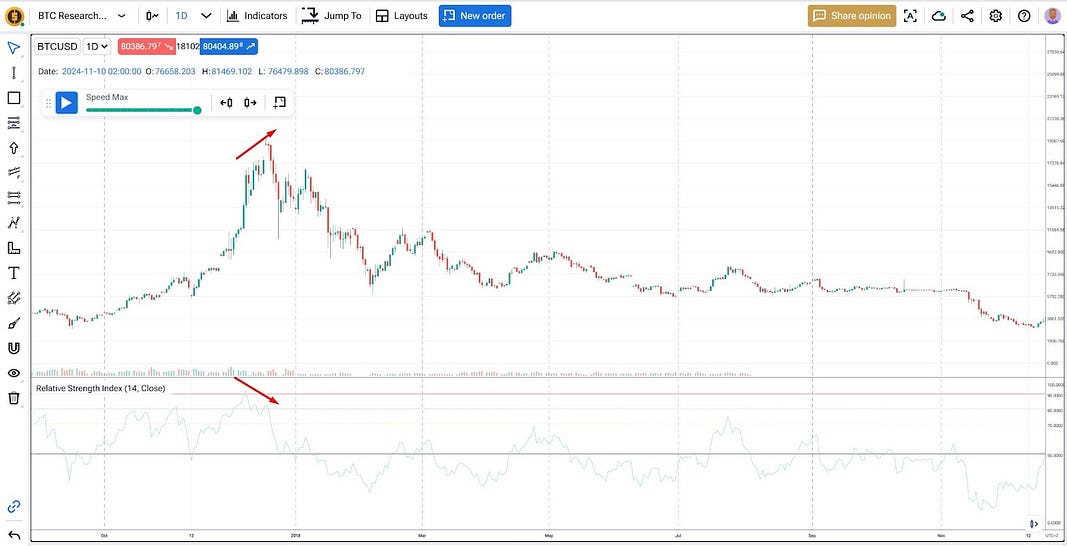
It’s a beautiful and memorable chart pattern, but that’s the beauty of manual backtesting — running just 1–2 passes through historical data gives us a solid grasp of a strategy’s potential, reveals its strengths and weaknesses, and shows us where adjustments might improve results.
But in this case — experienced traders would likely agree — it’s a dead end.
While such things are better verified independently and more thoroughly, a simple observation is enough: divergence signals on Bitcoin prove almost as unreliable as straightforward RSI interpretations.
The Bollinger Bands Experiment in Bitcoin Selling
Alright, so RSI proved to be a poor predictor of Bitcoin’s characteristic avalanche-like corrections. But there are other indicators we could try. Let’s give Bollinger Bands a shot.
We’ll keep the settings simple, eyeballing a few variations with different periods, deviations, and MA types based on a quick chart review.
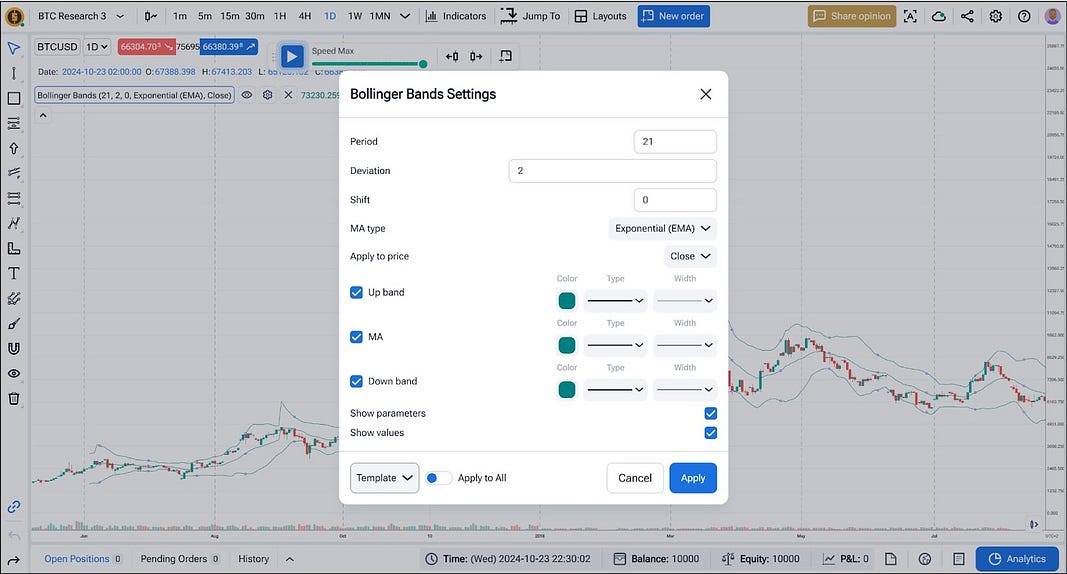
Trading Rules for Bollinger Band Strategy:
- Entry Signal: Candle close above the upper Bollinger Band
- Take Profit: First Fibonacci retracement level (23.6%)
- Stop Loss: Mirror distance above entry
- Position Size: Based on $1,000 fixed risk per trade
Let’s go.
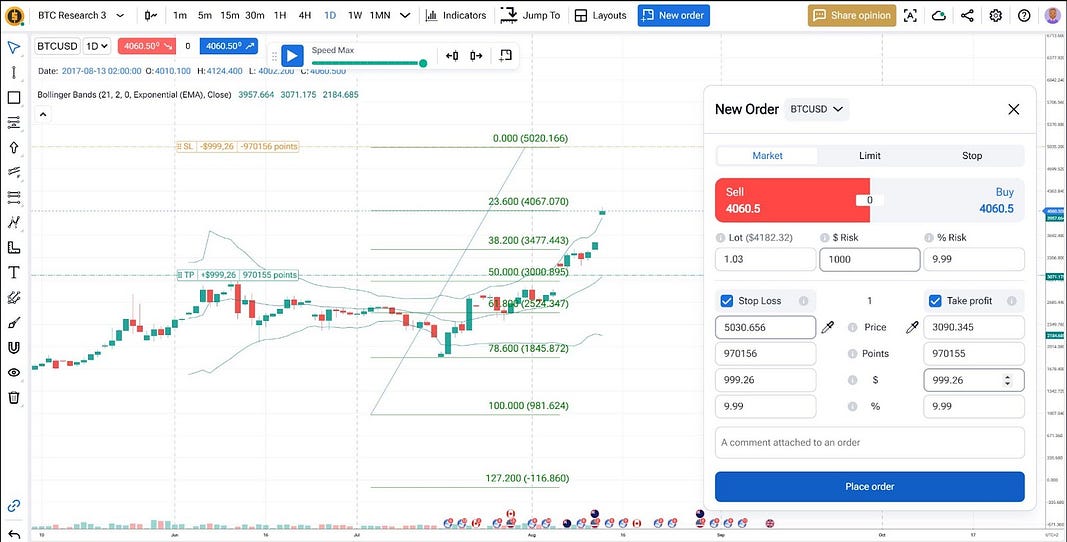
Perhaps with a larger starting capital or smaller risk per trade, we could have blown up our account more slowly and gotten a more statistically significant sample. However, by March 2021, we had already achieved:
- 68.7% loss of our deposit
- 11 losing trades out of 15 attempts
- Maximum drawdown of $7,821
With insufficient margin for new trades, we had to conclude our experiment.
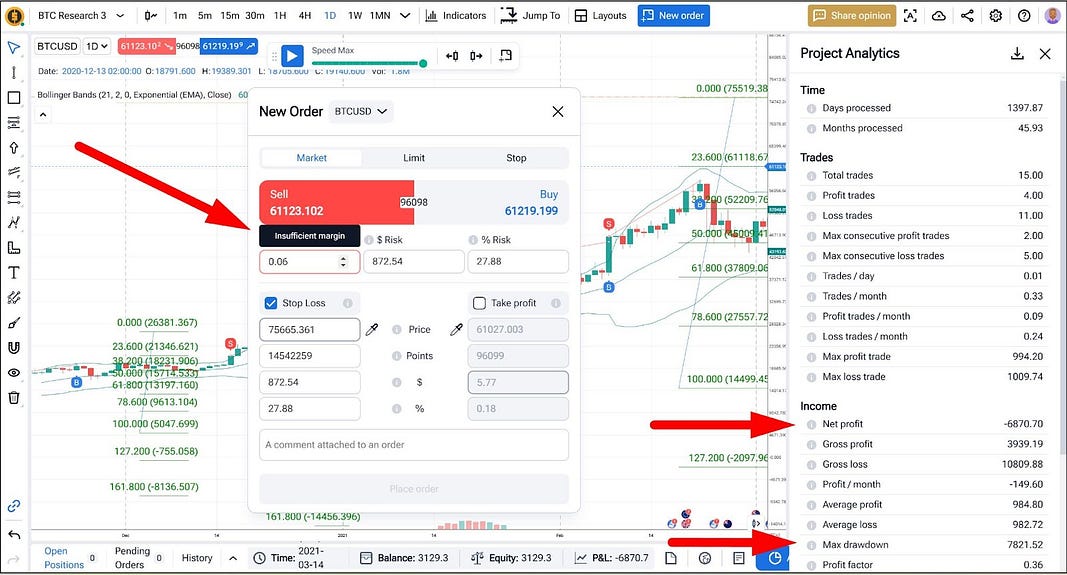
The conclusion is painfully obvious: catching a 23.6% Bitcoin correction against the trend is approximately three times harder than capturing a similar upward move.
The results paint a clear picture: counter-trend trading Bitcoin with standard technical indicators is a treacherous path, regardless of which indicator you choose.
What’s Next?
Perhaps more sophisticated and time-tested applications of Bollinger Bands deserve investigation. For instance, you might:
- Consider waiting for price to return inside the bands after breaking above — confirming it’s not just a strong trend but an actual reversal setup.
- Combine this with RSI readings for additional confirmation.
- Look for specific candlestick patterns at these critical points.
These are just starting points. The beauty of trading lies in finding unique combinations and approaches that others might have overlooked. After all, every major market move has traders who caught it — they saw something others didn’t, tested their ideas, and had the conviction to act.
So Obvious. So Boring. So Profitable: Strategies to Sell Bitcoin
Before we wrap up, let’s try the obvious solution. Instead of fighting the trend, why not use the old reliable trick — looking for trend-following entries on pullbacks?
RSI or Bollinger Bands? Let’s stick with the latter. In our previous iteration, it generated more trades historically, so for the sake of better statistics, we can apply it again — just mirror our approach.
Here’s our trend-following setup:
- Buy signal: Candle closes below the lower Bollinger Band
- Stop Loss: First Fibonacci level (23.6%)
- Take Profit: Mirror distance above entry
- Position Size: Based on $1,000 risk per trade
This simple trend-following approach represents an opposite to our previous counter-trend strategy.
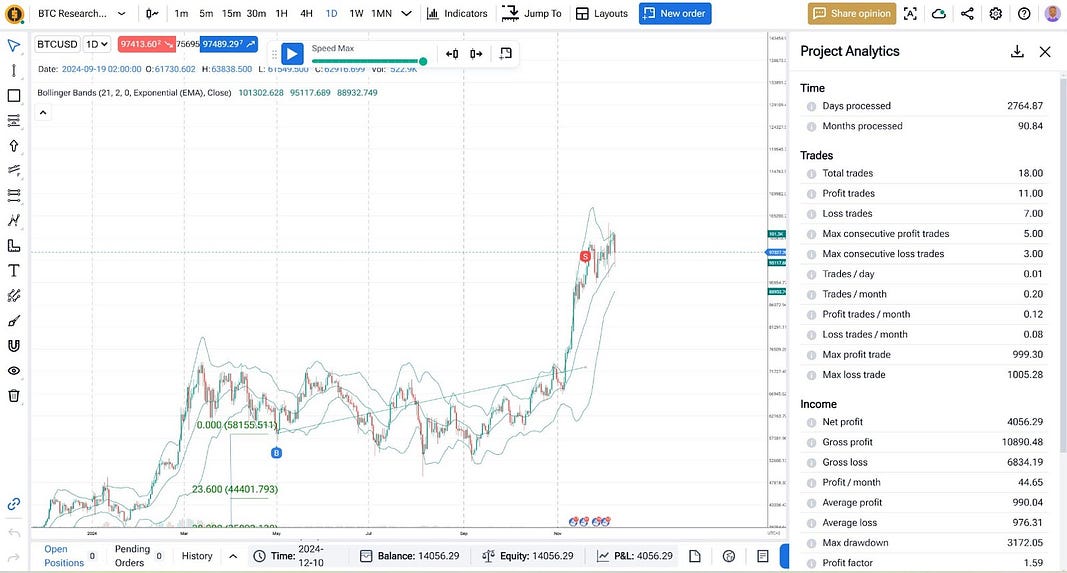
The 40% gain on our deposit over 7 years of backtesting might not seem impressive at first glance. But here’s the exciting part — this 40% could easily become 400% or more by simply adding a trailing stop to our long positions instead of using fixed take profits. The conclusion may be simple and obvious, but it’s powerful: buying with the trend has historically proven more profitable, showing better win rates and smaller drawdowns.
It’s your turn to explore.
We’re willing to bet that in your very next backtest iteration, you could achieve a tenfold increase in this long strategy’s profitability. But why stop there? Perhaps you already have ideas about how to profit from volatility — both buying and selling cryptocurrency based on different indicators, patterns, or even news events?
This is where Forex Tester Online becomes your laboratory for trading ideas. With FTO, you can:
- Test your strategies across years of historical data in minutes
- Experiment with different parameters and approaches
- See immediate results of your trading decisions
- Refine your ideas without risking real capital
Unlike automated backtesting that just follows rigid rules, FTO lets you combine systematic trading with human insight. You can pause, analyze market conditions, add contextual understanding to your decisions, and even note how various market factors influenced each trade. It’s not just about testing a strategy — it’s about developing your trading intuition while validating your ideas with historical data.
Think about it — some of your best trading insights might come from noticing subtle market behaviors that no indicator could catch. With FTO, you can explore these hunches systematically, building a trading approach that combines the best of both worlds: tested mechanical rules and seasoned trader’s judgment.
Ready to start developing your own unique edge in the market?
Forex Tester Online
Backtest your BTC trading strategy using FTO
 ไทย
ไทย
 Tiếng Việt
 Polski
 Türkçe
 Nederlands
 Română
 한국어
한국어
 Svenska

