We offer a classic tool of technical analysis, which first appeared in Chester Keltner’s book «How To Make Money In Commodities» in the far 1960s.
Initially, the author called this idea a «trading rule of the ten-day moving average», but the Keltner Channel indicator gained the biggest popularity in its modern form − as a dynamic «price envelope».
The technique of Keltner has been producing stable results for all types of trading assets for several decades and has practically no contraindications.
Keltner Channel: Logic and purpose
The task is standard: to determine the most probable range of price deviation from the trend line and to assess possibility of continuing or reversing of the current direction.
In fact, the author exploits the standard idea of building a price channel around the moving average line, but this is the first indicator that was «tied» to the current volatility of an asset.
To estimate the probability, the data of the ATR (Average True Range) indicator is used, which makes Keltner Channel sensitive to the speculative price movements.
As a result, its dynamic boundaries become more «relevant» and reliable support/resistance lines than in case of using the standard deviation.
In addition, using the typical price value in the calculation mechanism allows to filter the «market noise» correctly. It is especially important for the speculative trading assets.
For the Forex market, the calculation of the indicator still had to be modified, but we’ll talk about it later.
Keltner Channel: Calculation procedure
In the first version of Keltner Channel, the baseline was a simple moving average from a typical price ((High + Low + Close) /3) with a period of ten days.
The width of the channel is defined as the percentage of the average price change for a period:
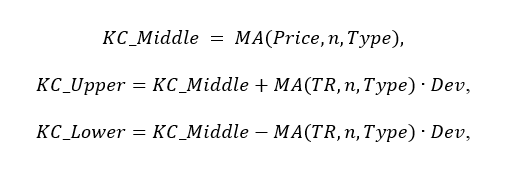 where
where
- KC_Middle, KC_Upper, KC_Lower − middle, upper and lower lines of the channel;
- Price − price of the current period;
- TR − true range;
- Dev − percentage of deviation.
Interestingly, the idea of using the ATR value (10) to calculate the channel’s width was suggested by the famous Linda Bradford Rashke only in 1980.
Another talented trader Robert Colby began to use the indicator with an exponential moving average.
As a result, it was this version of Keltner Channel that began to show more effective signals and gradually supplanted the classic version of the indicator from all trading platforms.
Keltner Channel: Parameters and control
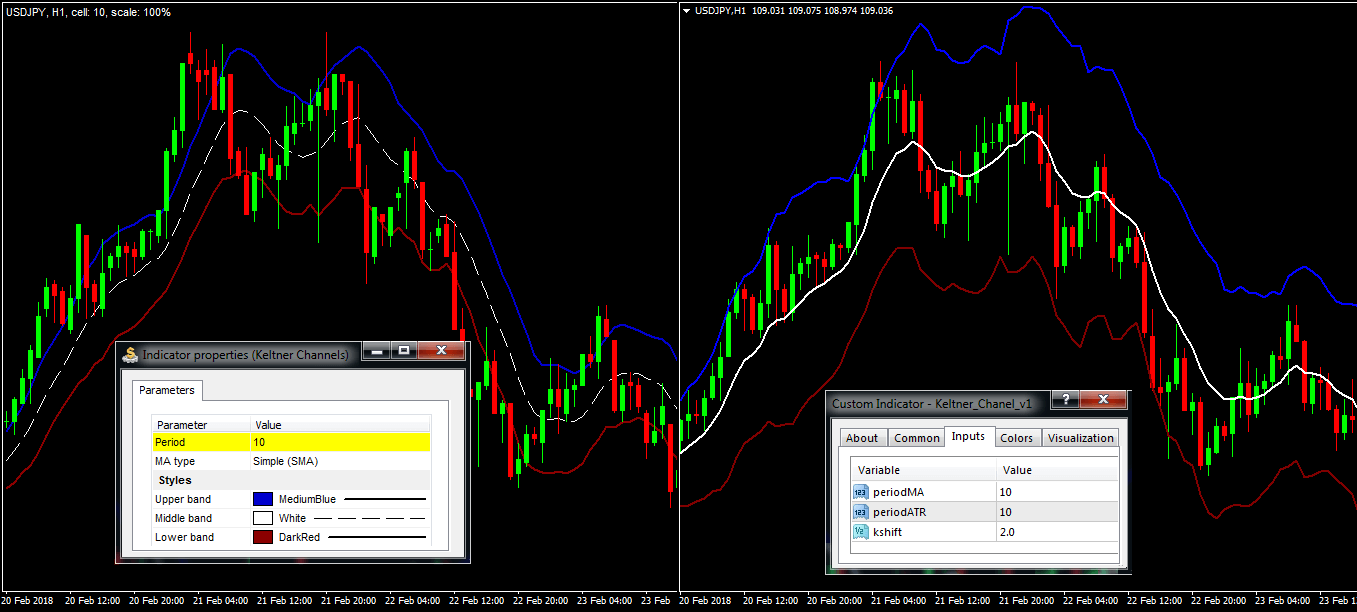
Keltner Сhannel is located on the main chart and is a set of three dynamic lines. The classical version of the indicator, except the color scheme settings, contains only the calculation period and the price type.
The modified version uses EMA with a typical price by default, but offers additional options for adjusting the channel’s width: period of the ATR volatility indicator and the offset (check Keltner channel).
Standard version of the Keltner Channel indicator
We will use the modified version. The Keltner Channel settings correspond to the usual logic.
- The higher the timeframe is, the more confidence the indicator signals cause. Experienced traders advise using periods of at least H1.
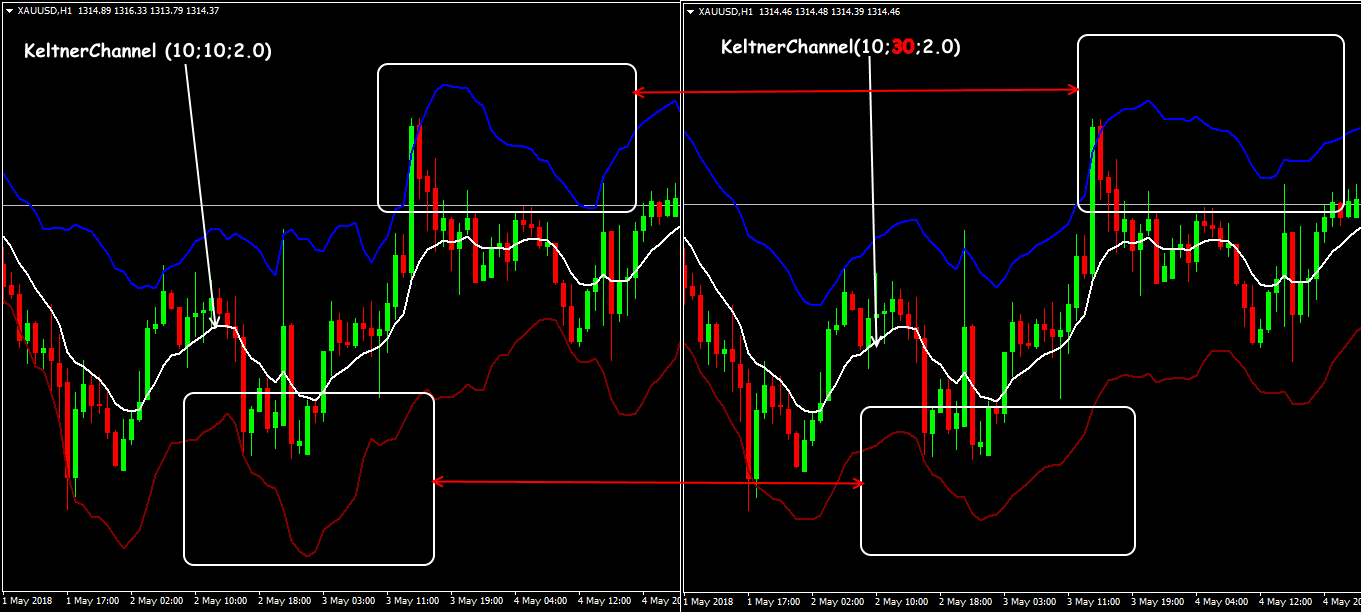
- The longer the calculation period (periodMA) is, the more the indicator will lag behind the current dynamics (the author recommended a value of 10, Linda Rashke − not less than 13).
Long and short ATR in the Keltner Channel indicator
- The bigger the periodATR coefficient is, the more seriously the indicator will take into account the volatility − boundaries of the channel are more smoothed out.
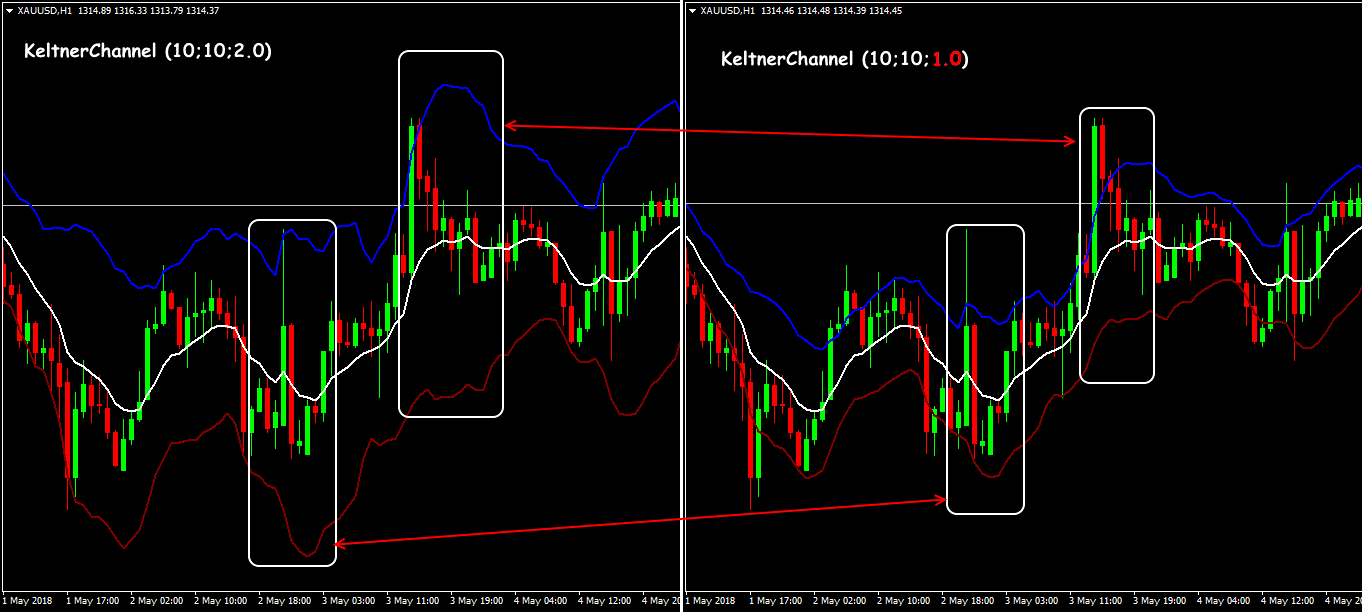
- Decreasing the kshift parameter makes the channel wider, but then it is more difficult for the price to break its boundaries. To get enough signals, you need to take into account the average volatility of a trading asset. For example, reducing the value from 2 to 1 will reduce the channel’s width twice and will identify the main trend correctly when there is high volatility.
Long and short deviation parameters in Keltner Channel
Classics of the market used Keltner Channel in the exchange trades exclusively.
Forex makes special requirements for analysis of volatility, therefore the optimal parameters can be found only after active testing. Trading signals, when working with the indicator, do not differ from the usual trend methodology.
Keltner Channel: Trading signals of the indicator
According to the signals of Keltner Channel, we enter the market only in direction of the trend, while the channel’s lines should be directed towards opening a deal.
For purchase:
- the general trend is going up;
- the price broke through the upper line of the channel and was closed higher.
Price movement above the upper line of the channel reflects the significant strength of the asset.
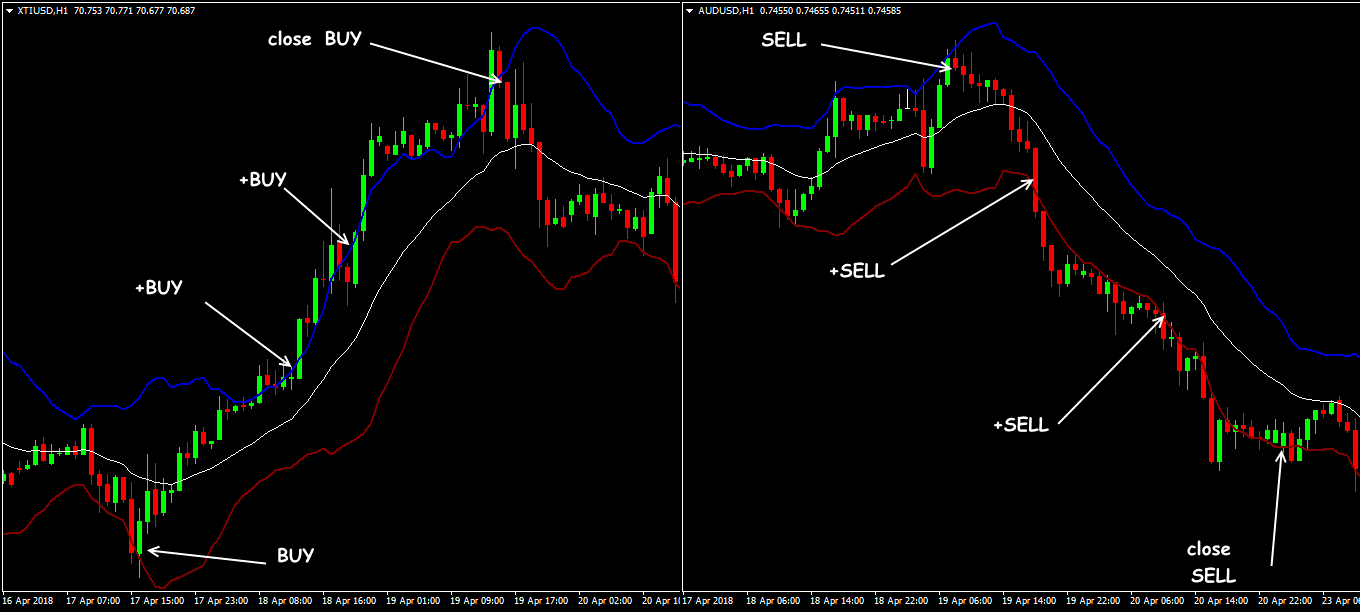
Keltner Channel: scheme of trading signals
For sale:
- the general trend is going down;
- the price broke through the lower line of the channel and was closed lower.
Movement beyond the bottom line of the channel means a stable fall in the trading asset.
Reminder: we enter the market at the moment of opening the next bar, best of all − with the help of a pending order.
Robert Colby recommends using exponential moving averages with a long period of at least EMA (50) for a sure definition of the trend.
That is, we buy according to the signals of the Keltner Channel indicator only if the price moves above the MA line (bullish trend), and sell while the price moves below the MA line (bearish trend).
Even if the price has not broken the boundaries yet, but the Keltner Channel indicator is turning upwards in general – it means the market appears to grow.
The rise of the channel and the breakthrough above the upper limit may signal a beginning of a rising trend. Similarly: the channel’s downward turn means that the sellers dominate the market.
During the flat periods, Keltner Channel’s boundary can be used to determine the overbought/oversold levels and to select trade targets for trading in the range.
You shouldn’t use the Keltner Channel indicator as the only signal to enter the market! We use it only in complex strategies.
Keltner Channel: Application in trading strategies
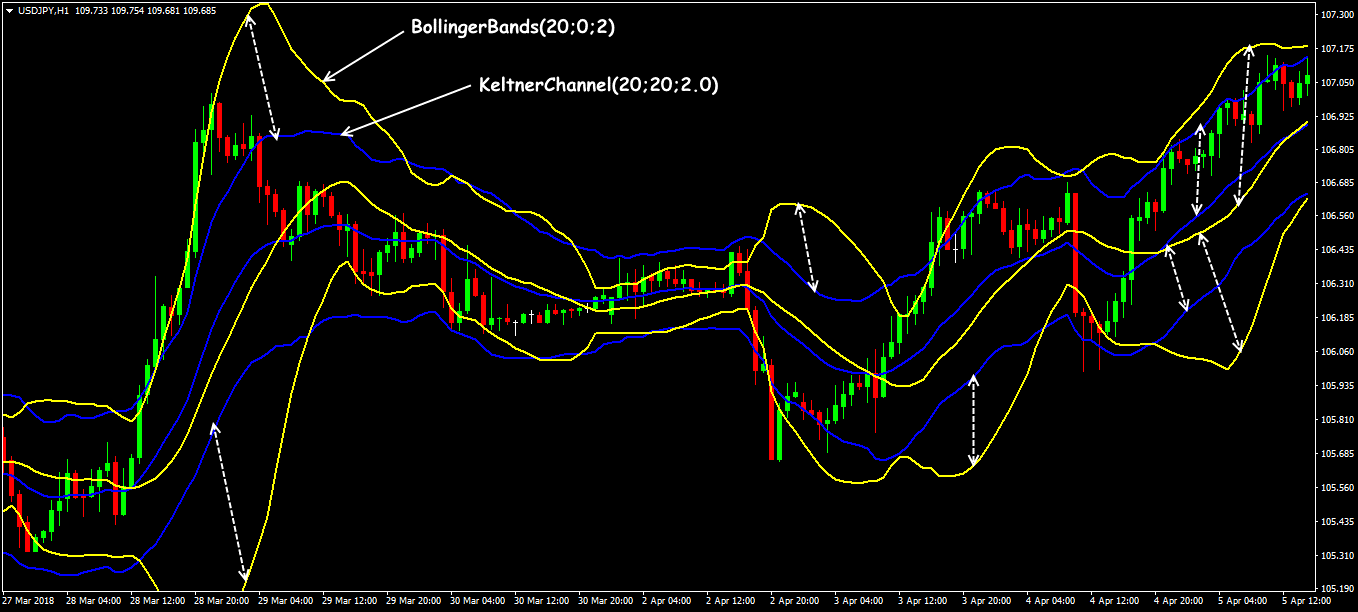
First, we want to say a few words about comparing Keltner Channel with its most popular counterpart. The main difference is that the channel is more smoothed, since its bandwidth is on Standard Deviation.
For most strategies this is an advantage, since the boundaries of the Keltner price envelope are closer to the price.
Scheme of trading signals of the Keltner Channel + BollingerBands strategy
In addition, Keltner Channel is built around an exponential moving average which is more sensitive than the simple moving average on which BollingerBands work. The signals of crossing the borders look more adequate even visually.
And one more remark.
Sometimes there is a reference to the so-called «rule of small trends of Keltner», but it has no relation to the indicator of the same name (check Keltner_channel).
As an exchange trader, Keltner worked with the medium-term positions of shares of the technology sector companies and adhered to the usual trend-following methodology:
- to buy if the max of the current period exceeds the max of the previous period by some fixed amount;
- to sell if the min of the current period falls below the min of the previous period by the same amount.
The whole idea is this value: Keltner used the value of 77% of the average trading interval of the previous day. As you understand, these recommendations are ineffective today, when Forex volatility is unstable.
As for the trading strategies, we will note only the most popular schemes.
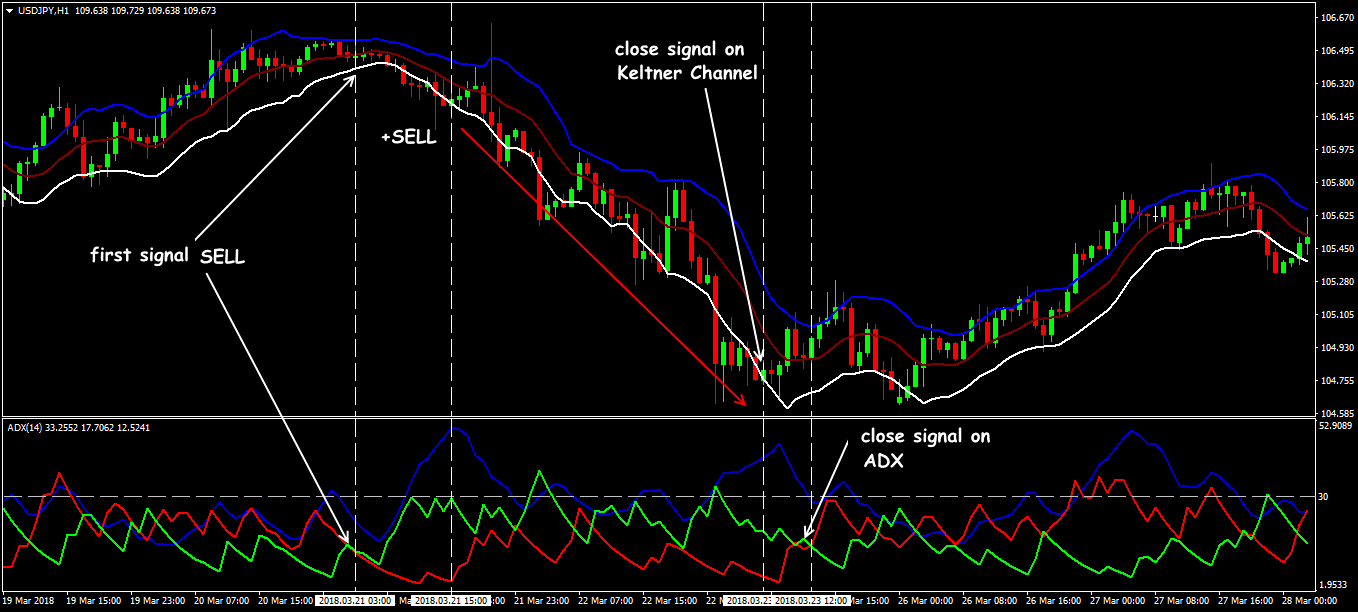
Keltner Channel + ADX
This multi-currency intraday strategy is quite old, so it uses the classic version of Keltner with a period of 10. As an additional indicator, ADX (14) with level 30 is used.
On the timeframes from H1 and higher, it is suitable for any asset with an explicit trend. You can see an example of a sell signal below.
Scheme of trading signals of the Keltner Channel + ADX strategy
The author recommended to consider closing of the candle behind the bottom line as the first signal, but the entry at the intersection of the lines (+) DI and (-) DI will be correct too. Further, if the downtrend is strengthened, you can add the volume according to the Keltner Channel’s signal.
We put Stop Loss beyond the local max above the blue line of the channel and then move it after the trend using trailing stop.
Trading with a pullback from the upper (or lower) border of the channel will be a less profitable and potentially more dangerous variant of the strategy – with the appropriate confirmation from ADX, of course.
Keltner Channel + MA
In addition to Keltner Channel (40; 20; 2.0), we need EMA (8; close). Timeframe − M15 and higher.
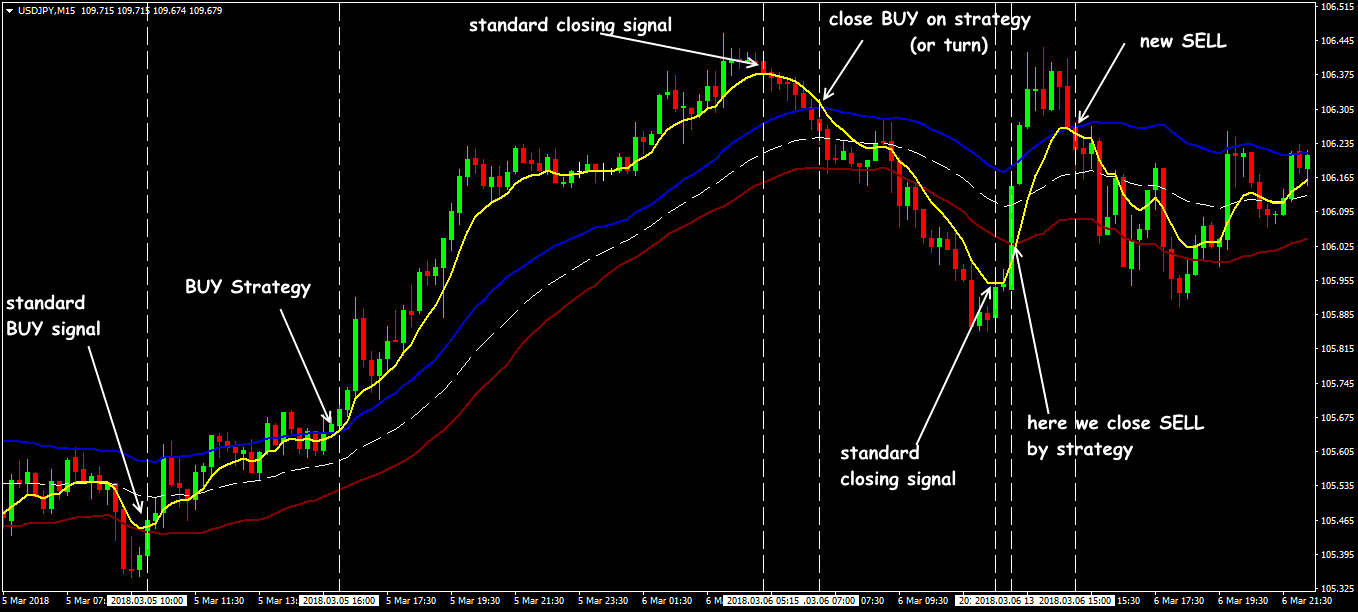
Scheme of trading signals of the Keltner Channel + MA strategy
We open positions when crossing the moving average of the Keltner Channel boundaries:
- for purchase − the upper boundary from the bottom up;
- for sale − the bottom boundary from top to bottom.
We enter after the key bar is closed.
We set Stop Loss a little above (below) the middle line of the channel, but not less than 10 points. Enthusiasts of aggressive scalping can open positions when the EMA line crosses any line of the channel.
Keltner Channel for range trading
In order to confirm the signals additionally, the oscillators’ data (CCI, RSI, Stochastic Oscillator) is used.
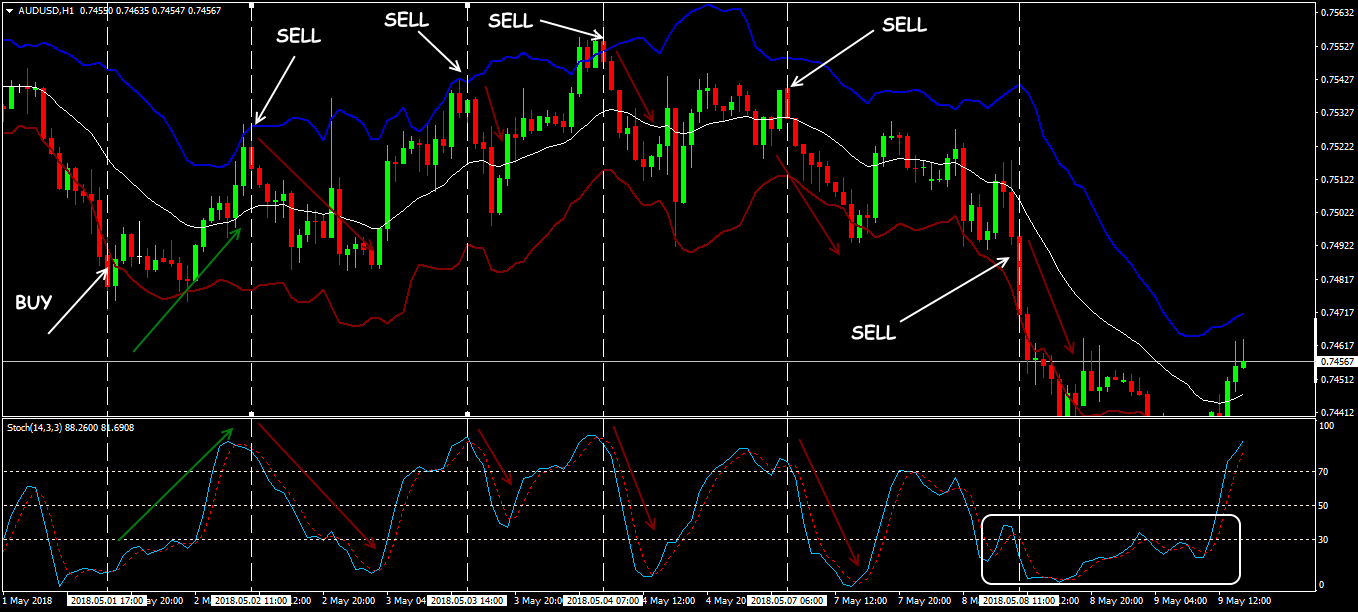
Scheme of trading signals of the Keltner Channel + Stochastic strategy
Several practical remarks
Like all technical instruments containing a «true range» calculation, the Keltner Channel indicator is not recommended for timeframes less than H1.
The indicator suffers from «uncertainty», traditional for all instruments of the price channel: breakthrough of the border can inform both of emergence of a strong trend and of the price entering the overbought/oversold zone.
Forex-specific speculative volatility constantly creates false border breakdowns, so it is not recommended to use Keltner Channel without additional filters (ADX, RSI, MACD).
Strangely enough, this indicator is rarely recommended by popular Forex mentors and training courses, maybe because it gives far fewer false signals than its «brothers» Envelopes or Bollinger Bands.
If you need to build a dynamic price channel, then Keltner Channel can be very profitable for this purpose.
After all the sides of the indicator were revealed, it is right the time for you to try either it will become your tool #1 for trading.
In order to try the indicator performance alone or in the combination with other ones, you can use Forex Tester Online with the historical data that comes along with the program.
 Try Forex Tester Online
 ไทย
ไทย
 Tiếng Việt
 Polski
 Türkçe
 Nederlands
 Română
 한국어
한국어
 Svenska
