Summarize at:
The revolutionary idea of Bill M.Williams reveals that trade volume is the main driver of the price’s movement. The correct analysis of the «relations» volume/price gives a clear understanding where (and how attentive!) the market is «watching» at the moment. And the MFI indicator, together with other developments of the author, has to be one more assistant to the trader in fight for profit.
So let’s begin.
Logic and purpose
The main task of the indicator is to evaluate correctly the efficiency (or in other terms − the productivity) of the market. Highly liquid market is considered to be effective, where all groups of participants − buyers and sellers, speculators and hedgers, small and large − act actively and purposefully.
If any group of participants (bulls, bears or neutral players) is declining or growing in commercial interest, this fact is immediately reflected in the productivity of the market.
If volumes do not enter the market (in the form of open trade deals), and in a particular direction (purchase or sale), then the price amplitude drastically decreases and the market goes into a flat state.
Change of market volume begins much earlier, than the new trend will become obviously visible on a price chart. The indicator calculates how many points have changed the price for tick − it is and there is a reaction of the real players to the dynamics of the volume.
According to the famous Theory of Trade Chaos, we are not interested in the absolute value of the indicator, only the general trend and the probability of a change of direction are analyzed. The author believes that the dynamics of MFI simulates the situation more objectively than all modern stochastic oscillators and trend indicators.
Calculation procedure
As there are no actual volumes at the Forex market, it is necessary to use the data on the number of changes of the quotation of an asset.
The Market Facilitation Index indicator measures price amplitude for the specified period; as a base period one tick is selected. Is calculated as a ratio (parity) of a difference of the price extreme to the volume of the bar.
BW_ MFI = (High – Low)/Volume
where:
High − maximum price of the current bar;
Low − minimum price of the current bar;
Volume − the trading volume on the current bar.
The indicator uses tick data, does not demand installation of the period of calculation (the current period of the diagram is applied).
Parameters and control
As there are no actual volumes at the Forex market, it is necessary to use the data on the number of changes of the quotation of an asset.
Standard version of the indicator Market Facilitation Index
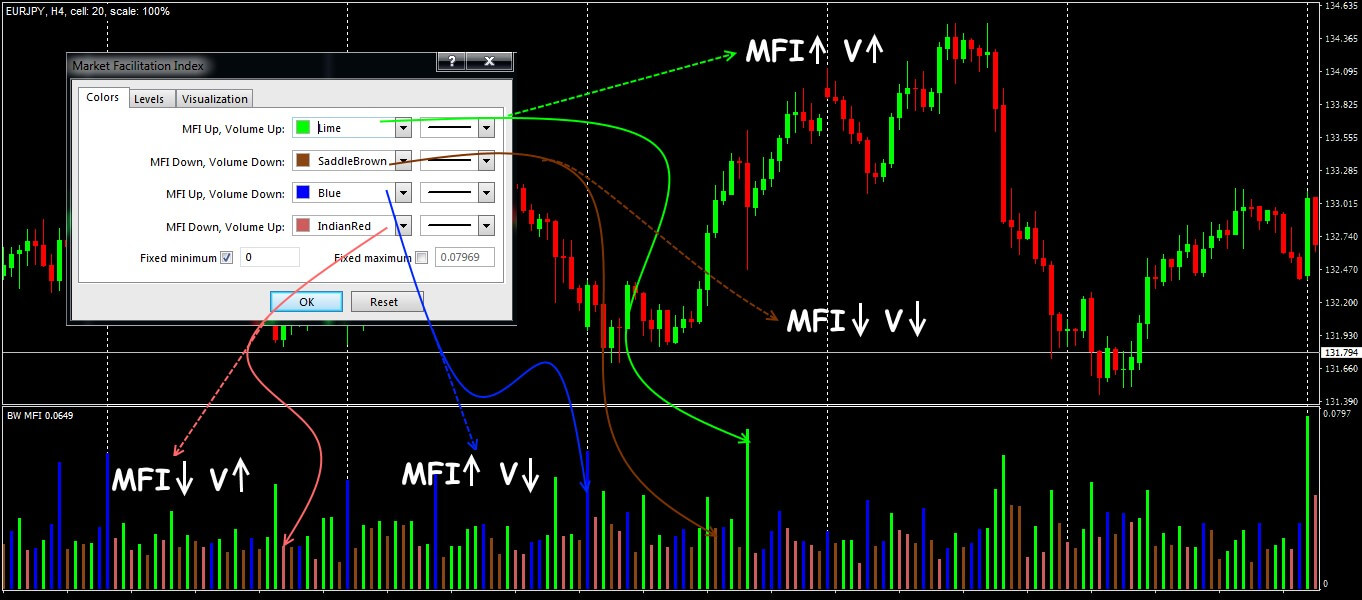
Bars of the histogram show different options of the joint dynamics of the price and volume. Calculation is carried out only at the prices of the current bar. The trade decision is made after the analysis of colour and amplitude of bars of the histogram.
Let’s look at it in detail.
Trade signals of the indicator
The Market Facilitation Index methodology offers only 4 possible combinations of price and volume.
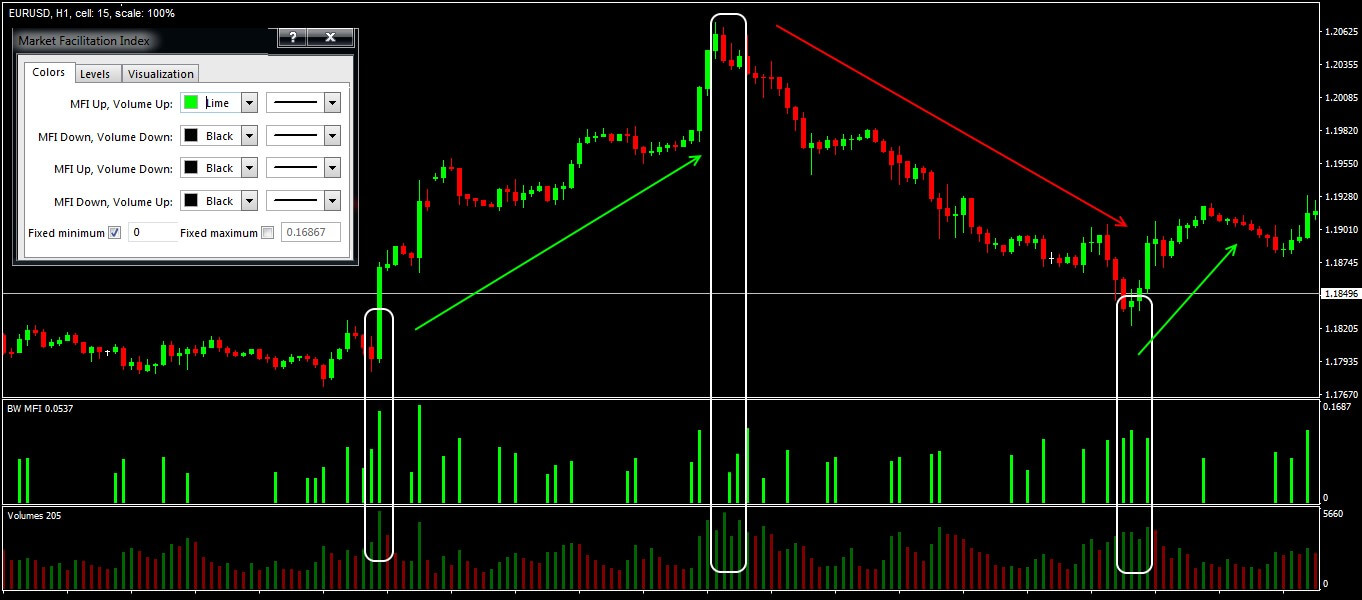
Green bar
- MFI value and volume grow synchronously. It means that the number of the transactions made by traders increases and happens the active movement of the market in the direction of a trend. New players add the volumes to the market in hope for continuation of a tendency.
- If before that position had already been opened against the market − they are recommended to close.
- If the trader managed to open the transaction on a trend before emergence of green bar, then this situation only confirms the correctness of the accepted trade decision.
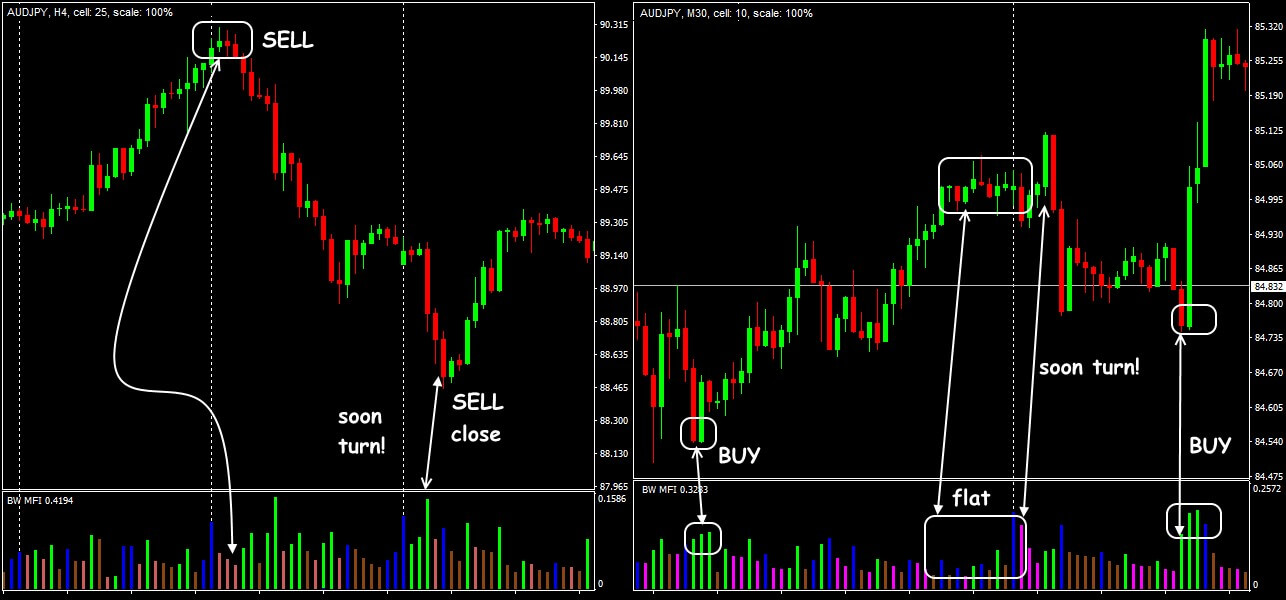
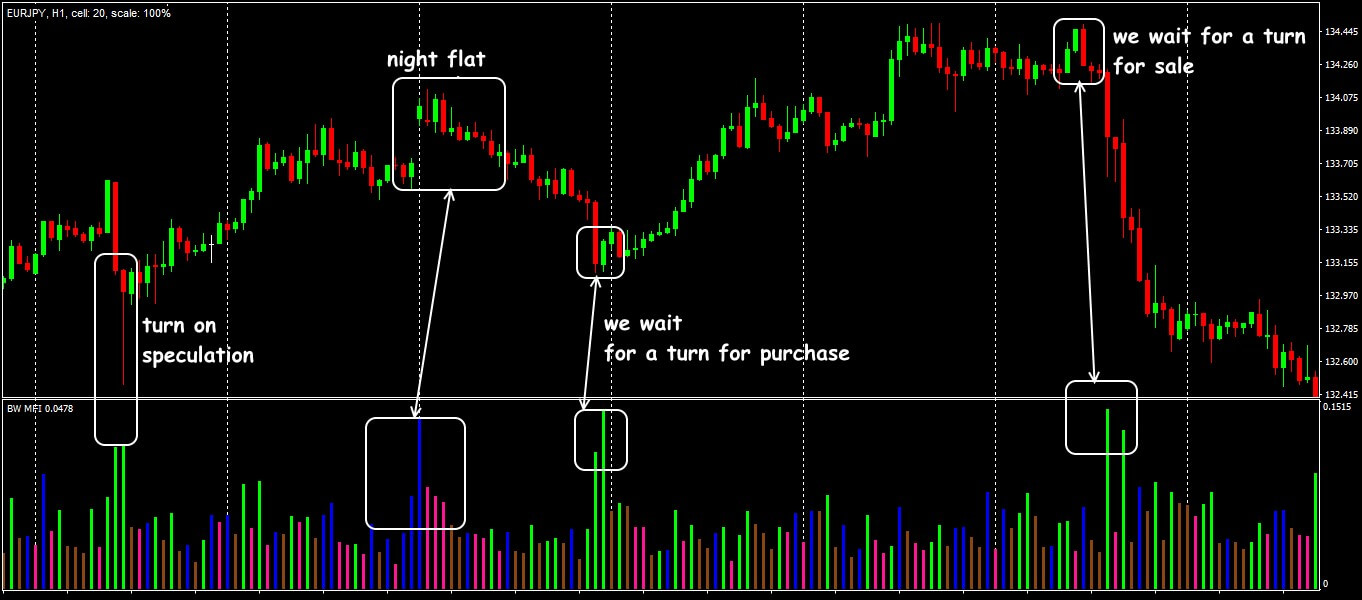
However, for the first entry into the market this bar of the histogram is useless, the optimal point of the market has already been missed and it is very risky to open a deal. The appearance of three green bars in a row means that the market is overbought or oversold and it is worth waiting for an active price turn.
Scheme of signals of the BW MFI indicator
Brown bar
The situation occurs when the volume and indicator values fall simultaneously. Bill Williams called this bar «withering bar».
Players lose interest in the current trend, preferring to close positions, the dynamics of prices slows down.
It is not recommended to open new deals in such a market. A few brown bars in a row − wait for the trend reversal.
«Withering bar» often appears on top of the first wave of Elliott.
Blue («false») bar
This bar appears during the decrease in trading volume against the backdrop of the rising prices. It signals about weak movement in a direction that for some reason is not supported by trade volumes. The price moves by inertia at the expense of small participants
There is a high probability of speculation or currency interventions. Before finding out the reasons for such strange behavior of the price, it is recommended to abandon new trades.
Histogram of the Market Facilitation Index indicator
Pink («squatting») bar
It appears most often at the end of a protracted trend. Market activity is increasing, but volumes are declining. There is a struggle between «bulls» and «bears», many transactions are being made, but − in different directions, so there is no clear price dynamics. There can be several such bars in a row.
The result?
The market is going to make the strong movement − either in the direction of a trend, or against it; it is necessary to look for confirmation from additional indicators.
If the «squatting bar» matches PIN bar, or is in an expected target zone of the current wave of Elliot, and at the same time on the MACD indicator there is divergence, then the probability of a turn reaches 95%.
Inexperienced traders are not recommended to open deals when a pink bar appears. If the volume starts to grow on subsequent bars and a green bar appears on the BW MFI histogram, you can open the transaction in the direction of the current price movement.
Application in trade strategy
MFI at Forex market is often used as an additional filter in the zone of the strong price levels, as well as for the analysis of volumes in complex strategies.
Let’s consider some options how to use the characteristic features of the indicator’s histogram.
Strategy on the «pink» bar
We remind: the «squatting bar» of the histogram of BW MFI carries out a role of a compressed spring − the market accumulates energy before the strong movement (volume grows, but the price does not move yet).
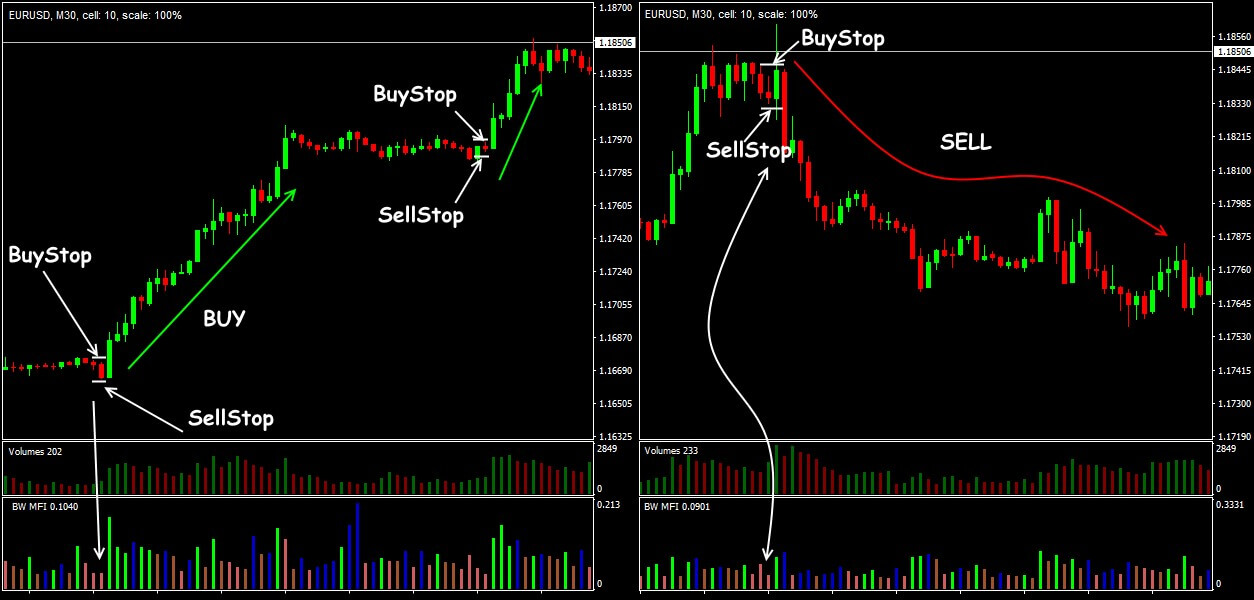
Once Bill Williams proposed an elementary trading strategy: After the appearance of the «squatting bar», you need to set the postponed warrants of SellStop and BuyStop 2-5 points below/above the boundaries of the last closed candle. Stop Loss − is obligatory.
As a rule, one of the orders is opened already at the next bar and then the price continues to move, at least 2-3 bars. This is quite enough to «take» a profit of 10-30 points. After one of the postponed warrants opens, the second warrant needs to be deleted.
Scheme of trade signals of strategy «Pink bar»
Strategy Forex Cream
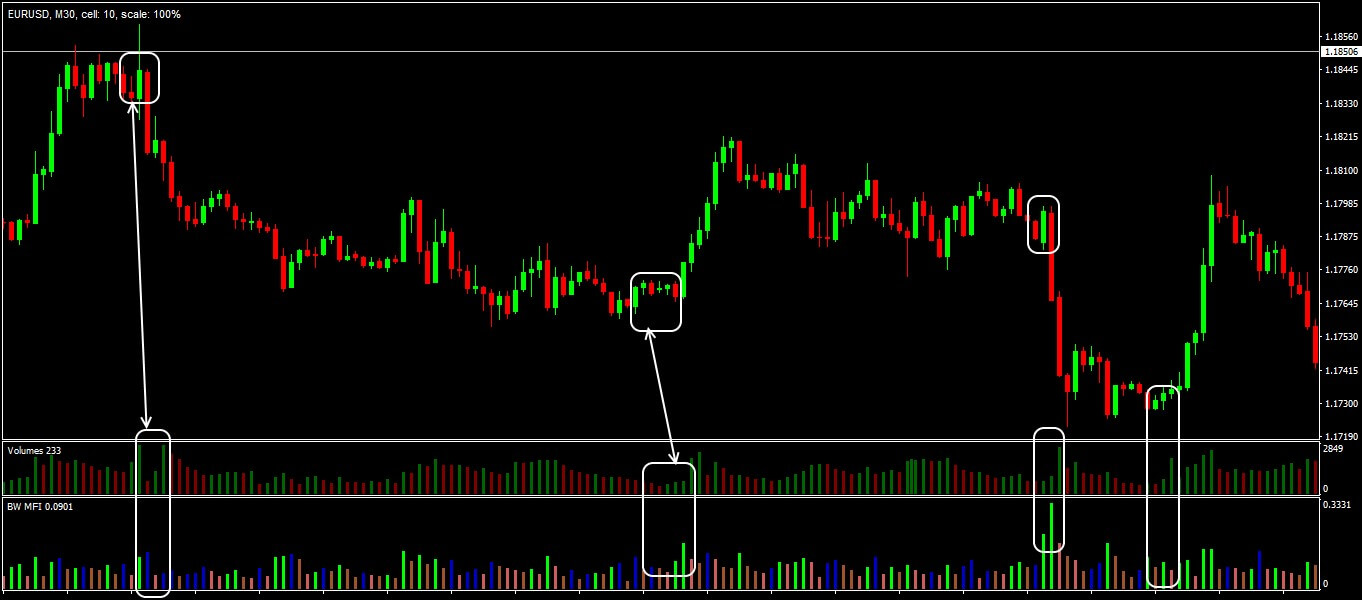
Indicators required: Market Facilitation Index and Volume (Tick or Real), timeframe M30.
It is assumed that if the BW MFI is growing, but volumes are decreasing, then this is a sign of a stable trend.
- For BUY: the price is a green bar with small shadows, MFI is the blue bar, MFI’s growth relative to the previous bar is more than 20% (or better − 30%!). The sign of quality is a candle with a body larger than the sum of the shadows.
- For SELL: the price is a red bar with small shadows, MFI is the blue bar, the MFI drop in relation to the previous bar is more than 20-30%.
- Stop Loss for purchase: (LowPrice − (High-Low) / 3); for sale (HighPrice + (High-Low) / 3).
Scheme of trade signals of the BW MFI indicator in the strategy of Forex Cream
Strategy of a volume scalping
One more scheme of the Market Facilitation Index and Volume indicators (Tick or Real) usage. We will configure MFI so that only the sharp growth of volume (green bar) will be displayed. Depending on the direction of a candle on which there is a green bar MFI, we define the direction of the transaction − we sell or we buy, Stop Loss is set below/above a signal candle.
However, what this means is:
Such system will generate too many false signals. It is not important for the MFI indicator how much the previous volume has decreased − by 1 tick or 100 ticks − it will «draw» a green bar in any case. Therefore, for the more accurate assess to the market’s interest, a Volume indicator is added to the strategy. We open the transaction, only if the MFI signal is additionally confirmed by the dynamics on the volume histogram.
Several practical remarks
Indicator BW MFI has a special, rather complex philosophy. This is an excellent tool for assessing the seller/buyer balance, its effectiveness is virtually doesn’t depend on the type of the trading asset and the analysis period. The link to the current volatility allows you to make an assessment as objectively as possible.
Naturally, if there is information about real volumes, for example, for currency or commodity futures, the signals of the Market Facilitation Index, especially the peak ones, will be more accurate.
But to use the indicator for making a trading decision is not recommended even by Williams himself, as the skills of the correct interpretation of its signals come only with practical experience.
Try It Yourself
After all the sides of the indicator were revealed, it is right the time for you to try either it will become your tool #1 for trading.
In order to try the indicator performance alone or in the combination with other ones, you can use Forex Tester Online with the historical data that comes along with the program.
Simply try Forex Tester Online. In addition, you will receive 23 years of free historical data (easily downloadable straight from the software).
Share personal experience of effective use of the indicator Market Facilitation Index. Was this article was useful for you? It is important to us to know your opinion.
 Try Forex Tester Online
 ไทย
ไทย
 Tiếng Việt
 Polski
 Türkçe
 Nederlands
 Română
 한국어
한국어
 Svenska
