Summarize at:
In a pursuit of profit, we often do not notice the standard tools capable to simplify the routine engineering analysis without loss of quality of signals.
So let’s begin:
We offer dynamic trend Moving Average of Oscillator (OSMA). The indicator evaluates a difference between the value and its smoothing, and on the basis of it draws conclusion about force of the current tendency.
Logic and purpose
The OSMA indicator is continuation of classical MACD and is constructed on the basis of a ratio of two moving averages. As the oscillator in calculation the base line of MACD is used, for smoothing its signal line is used.
The less difference in indications of OSMA and MACD – the weaker the current short-term trend is and even if this is a temporary phenomenon (the general trend remains), the trader receives an additional occasion to pay to the market special attention.
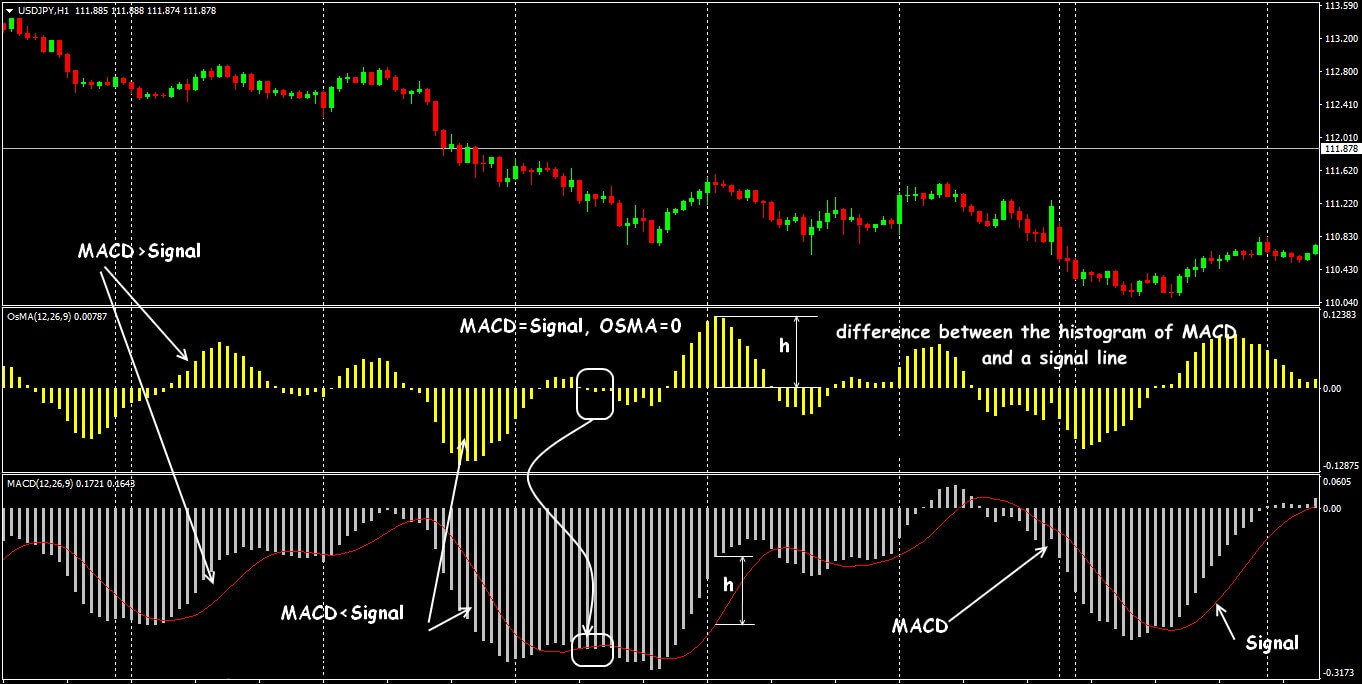
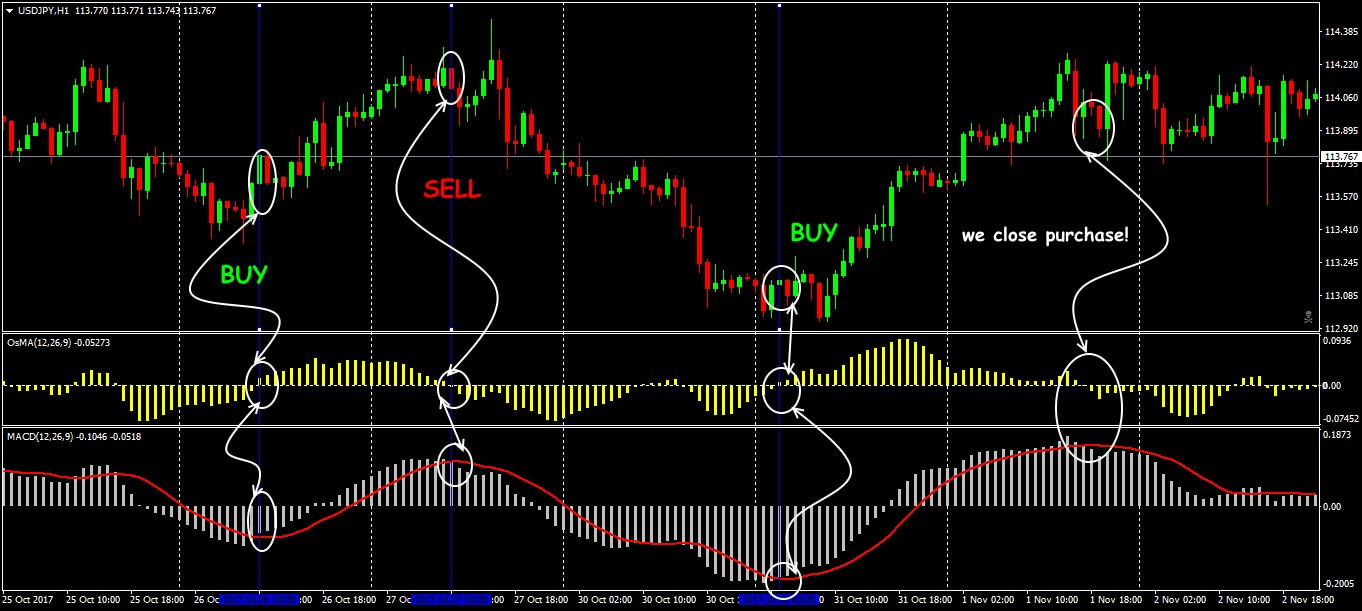
Scheme of mutual signals OSMA+MACD
Calculation of the additional difference in the MACD readings allows you to evaluate its internal dynamics and signal quality, find problem points, in particular − for a turn or timely increase/closing position.
It is OSMA that is considered the best tool for finding internal divergences.
If to consider that the stability of MACD signals is very dependent on the period of application, then signals of Moving Average of Oscillator give additional opportunities for profit, while its more popular «relative» is working out on a long-term trend (see OsMA).
Calculation procedure
The value of the indicator is the difference between the values of the MACD histogram and its signal line (this is the middle one mentioned in the name Moving Average of Oscillator).
The difference between the fast and slow EMA values is considered the value of the MACD indicator and the signal line is applied to this value.
- If the difference is positive (MACD > Signal), the OSMA histogram is located above the centre line; tendency to increase in priority;
- If the difference is negative (MACD < Signal), the OSMA histogram is located below the zero line; the price of the asset is reduced;
- If MACD = Signal is the value of OSMA = 0, there is no strong trend in the market.
Parameters and control
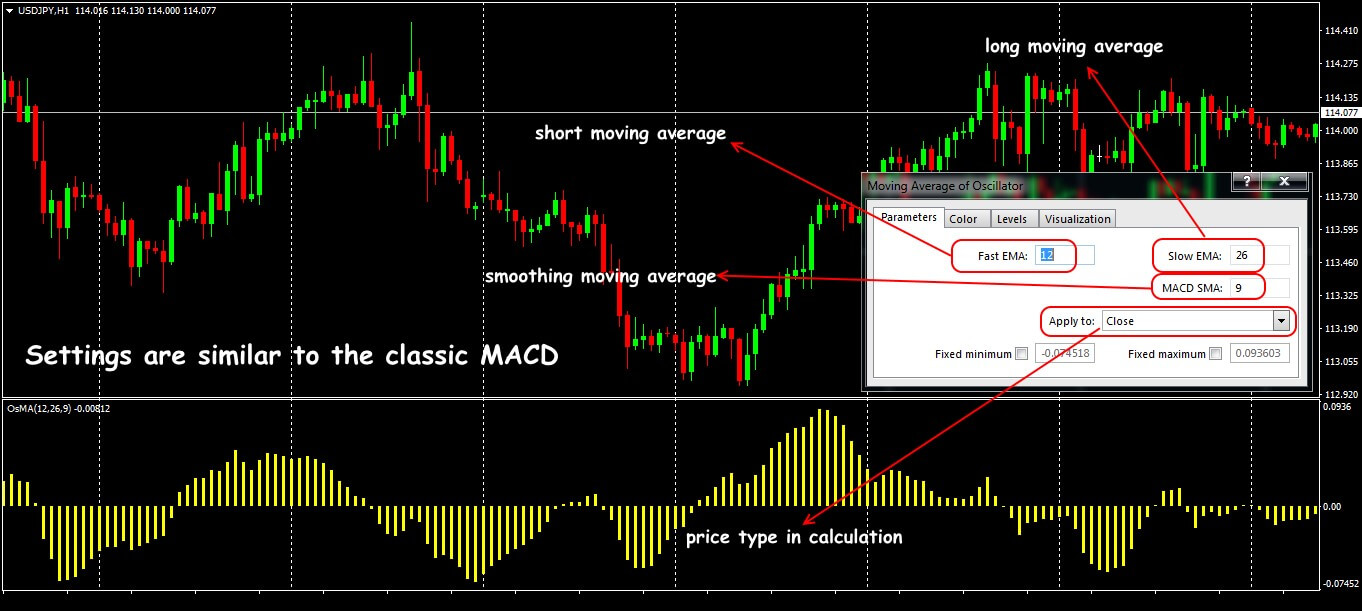
Configuration of the indicator is identical to classical MACD, only the graphical representation of the result changes − that is why both indicators are often used in the bundle.
Standard version of the OSMA indicator
There are four options for OSMA settings:
- Fast EMA (the default period is 12);
- Slow EMA (default is 26);
- Signal line MACD SMA (default is 9);
- The price type for the calculation of the moving averages, traditionally − the price Close, other options − Open, Low, High and various options for average prices are considered exotic and rarely used.
The indicator is a traditional histogram with a center line, located in an additional window below the price chart. Height of the histogram is equal to a difference (MACD – Signal). The central line is dynamically shifted, depending on the amplitude of the oscillations. Each point on the histogram has special trade value.
Let’s look at it in detail.
Trade signals of the indicator
Let’s remind:
the strongest trading signals of the basic MACD indicator arise at the time of crossing of the alarm line the histogram. Everything depends on its further behaviour: if the histogram after crossing went down – a signal to sale, up – to purchase (see more).
The histogram of the OSMA shows us force of the current tendency − bear or bull, and it follows the same principle of the signals’ forming, including situations of divergence and behaviour in a zone of crossing of the zero line.
So, necessary conditions …
- For a long position:
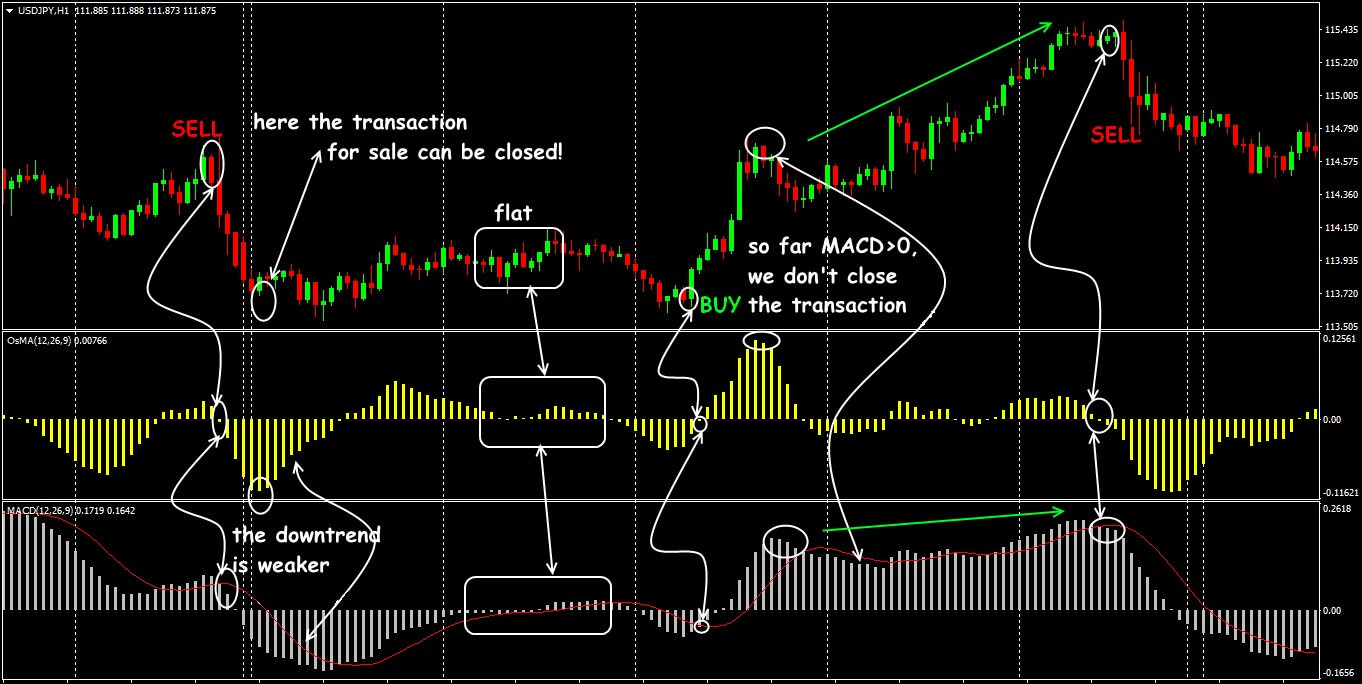
The histogram of the Moving Average of Oscillator crosses zero level from below up (the market is oversold) − continuation of the histogram’s growth means strengthening of a growth’s tendency. At the same time on the MACD indicator, the signal line has to cross the histogram – also from the bottom up.
Further, when maintaining an open transaction, it is necessary to monitor the histogram of OSMA: its reduction (provided the general trend remains) can be considered as the first sign that the upward momentum is weakening.
Trade schemes Moving Average of Oscillator
- For a short position:
The histogram of OSMA crosses zero level from top to down (the market is in overbought zone) and further fall of the histogram will mean gain of the downward motion. At the same time, on the MACD indicator, the signal line should also cross the histogram from the bottom down.
In process of support of the transaction, we control the histogram of OSMA – its increase (on condition of the general descending trend) will be the first sign of weakening of growth.
- Divergence:
For necessary constructions, we use Graphic Tools in FT/FTO, further we act according to the standard scheme:
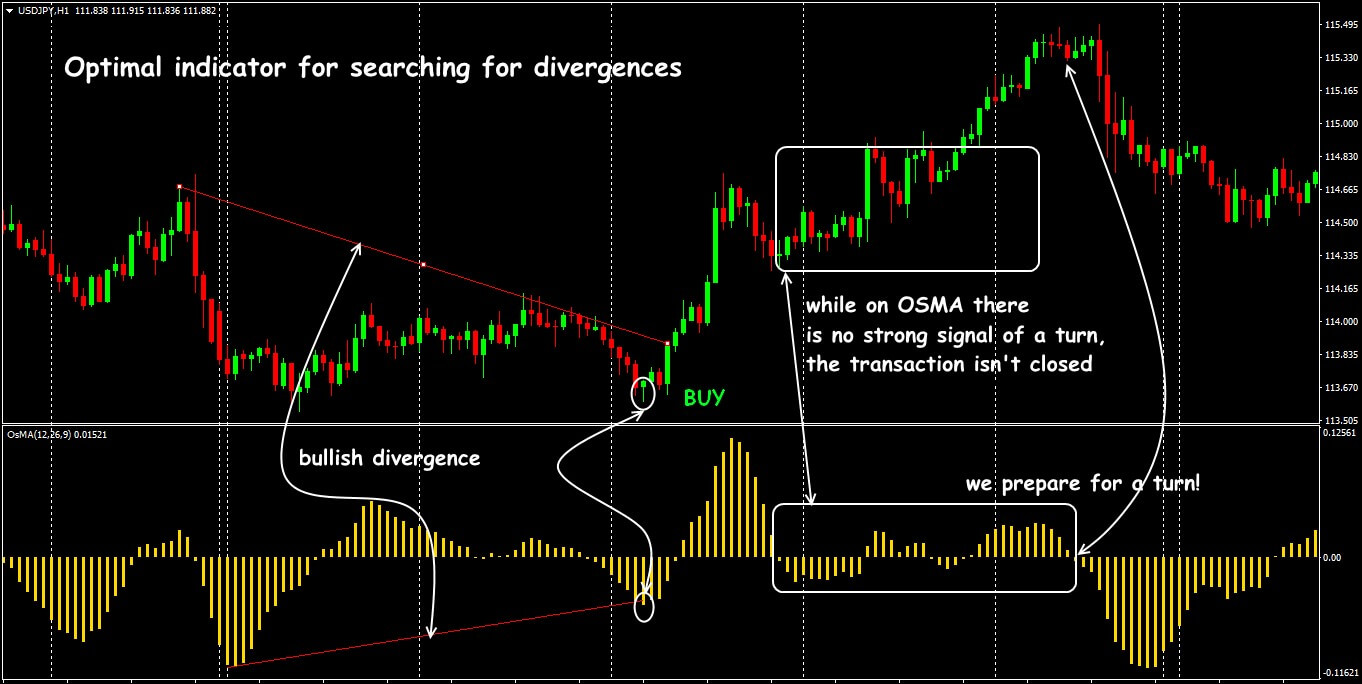
Bull divergence − the price falls, the histogram of the OSMA grows − a signal to open the long position.
Bear divergence − the price goes up, the histogram down − a signal for a position for sale.
On the OSMA indicator the situation of the triple divergence appears much more often than on the MACD indicator, and is considered to be stronger.
Trade situation of divergence in OSMA
Sometimes on the OSMA indicator there are periods of the internal flat – in such situations the trades opened due to the MACD signals can be not closed as the general trend remains.
Even when the price and the histogram of MACD externally decrease – we draw attention to the histogram Moving Average of Oscillator.
The result?
If the «waves» of the OSMA do not support this new trend, then the previous trend is maintained.
Application in the trading strategy
The scheme for the OSMA is similar to the MACD indicator, but anticipated signals of OSMA turn out to be more exact.
What this mean is:
Moving Average of Oscillator gives not only additional trading signals on an input, but also allows closing the transaction in the time until MACD hasn’t decided on such «solution» yet.
Trade signals of OSMA+MACD
A set of indicators is the best used in periods of the market with a large but stable amplitude (without speculation!), and it is possible in periods without an explicit direction, but in a wide channel (see more).
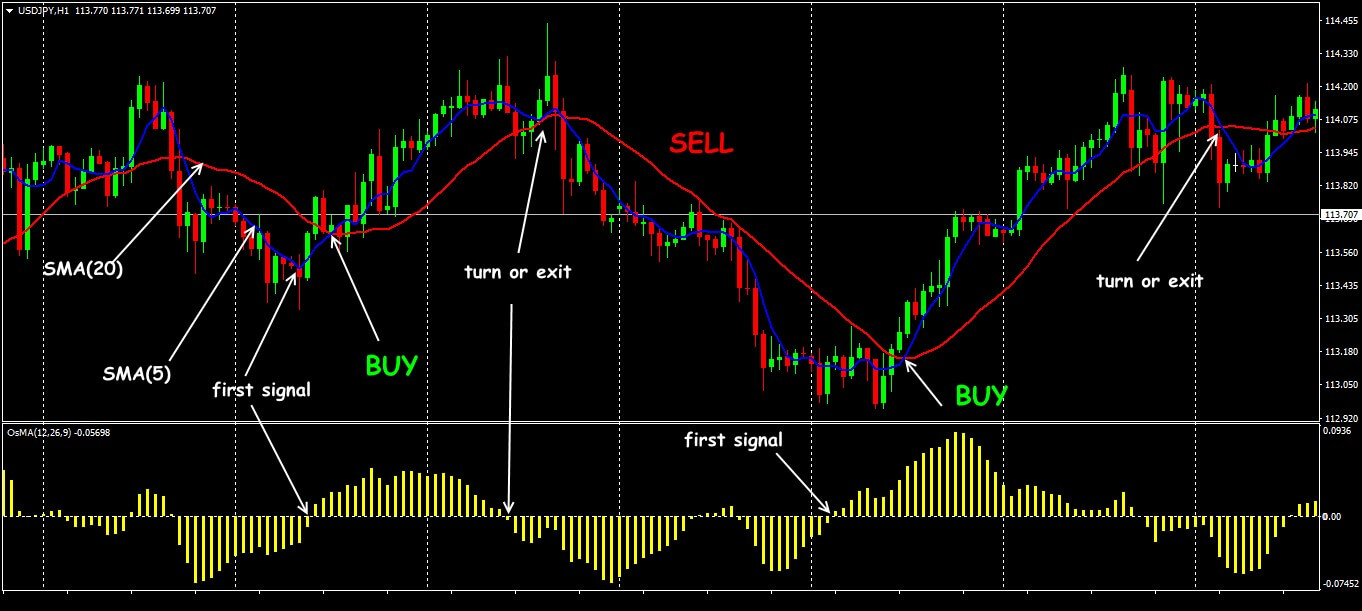
Trading signals of OSMA+SMA
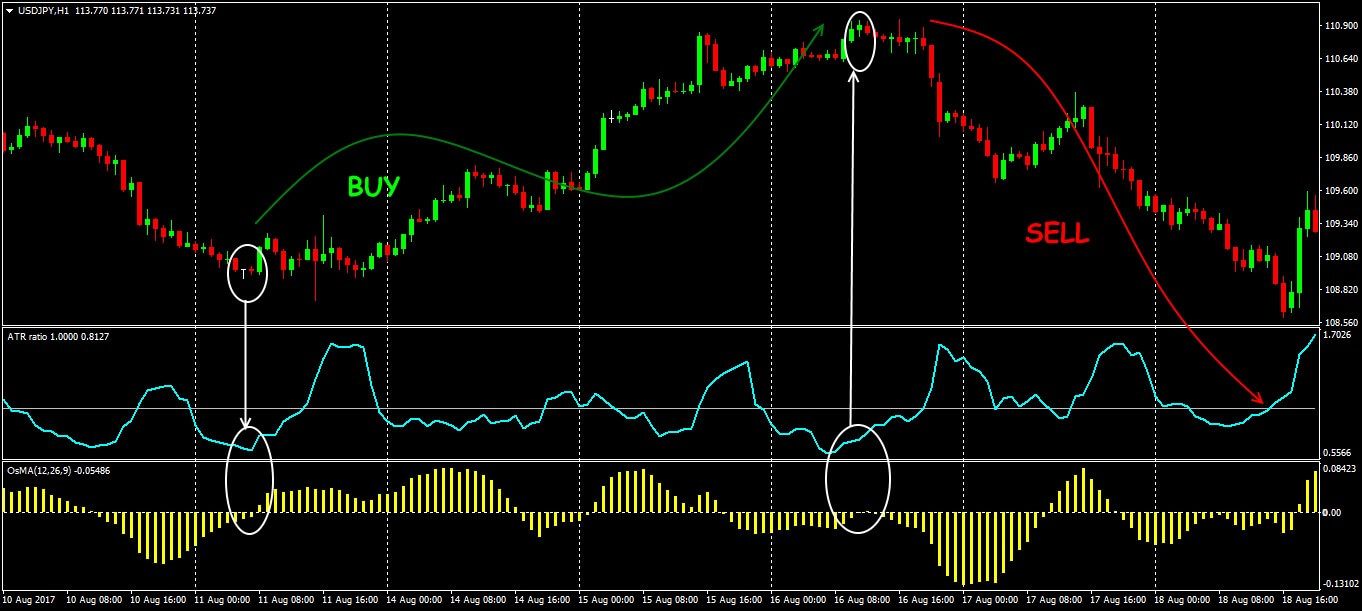
Example of strategy with use of the indicator of volatility.
Trading signals of OSMA+ATR_Ratio
Several practical remarks
Despite the fact that the Moving Average of Oscillator looks like an oscillator, according to the analysis mechanism it is a trend indicator, and therefore has problems similar to its «older relative».
Generally, it is connected with the fact that calculation of OSMA includes moving averages, and even sharing with the MACD indicator does not allow eliminating effect of delay.
In practice, an additional filter, for example, the ADX volatility indicator is necessary to «diagnose» false signals. The greatest benefit can be obtained using OSMA to search for divergence situations.
The OSMA indicator is recommended for medium-term trading on timeframes not lower than H1, during an unstable market − it is unstable.
Try It Yourself
After all the sides of the indicator were revealed, it is right the time for you to try either it will become your tool #1 for trading.
In order to try the indicator performance alone or in the combination with other ones, you can use Forex Tester with the historical data that comes along with the program.
Simply try Forex Tester Online for free. In addition, you will receive 23 years of free historical data (easily downloadable straight from the software).
Share personal experience of an effective use of the OSMA indicator. Was this article useful for you? It is important to us to know your opinion.
 Develop Moving Averages Trading Strategy
 ไทย
ไทย
 Tiếng Việt
 Polski
 Türkçe
 Nederlands
 Română
 한국어
한국어
 Svenska
