Summarize at:
The first version of the Price Channel was created by the legendary Richard Donchian back in 1934, and most of its trading principles are as relevant today as they were during the “golden age” of technical analysis.
Donchian is considered the progenitor of the trend trading strategies. The famous “Turtle Trading System” was based on the Donchian Channel indicator and brought the author worldwide fame.
The modern Price Channel – a classic representative of the Envelopes family – allows the trader to respond in time to the price coming out of the channel that is set for it.
The indicator offers a fair and straightforward price calculation without additional correction – a necessary minimum for a confident trade.
Logic and purpose
Any channel trading scheme suggests that the price should be up to 90% of the time in the range between the support/resistance lines.
What happens when the price reaches a critical zone? The most likely option is to disconnect from the power line and return to the range until the opposite “wall” is touched.
The required entry point is formed in the border zone; therefore, high demands are always placed on the accuracy of constructing the price range.
The Price Channel indicator suggests building a range of pure extreme values. The upper limit is at the level of the highest High price fixed for the billing period; likewise, the lower limit is at the level of the lowest Low price.
It is probably the simplest and most accurate method for analyzing current volatility, but how profitable it is for real trading – read on.
The calculation procedure
Price_Channel_Upper = Max(PriceHigh(n));
Price_Channel_Lower = Min(PriceLow(n));
Price_Channel_Middle= (Price_Channel_Upper+Price_Channel_Lower)/2)
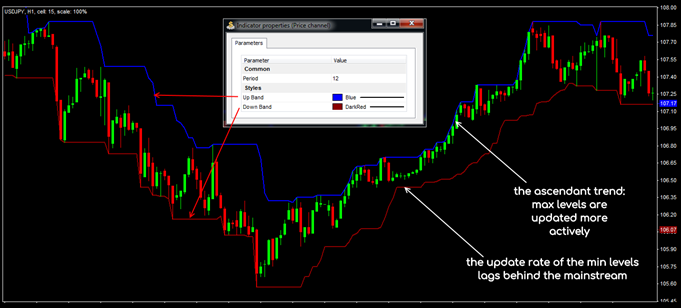
While extrema are relevant, the indicator displays rectilinear sections of the upper and lower boundaries of the channel, the central line (present not in all versions of the indicator!) is calculated as the usual arithmetic mean.
No averaging or smoothing mechanisms are used. The calculation involves data on the price of N previous bars.
When the value of the upper or lower extremum changes, the corresponding part of the boundary is dynamically rearranged, and the points of change of the upper and lower levels are asymmetric. Only the midline shifts following the new upper or lower boundary.
Parameters and control
The standard version of the Price Channel indicator (or Donchian Channel) uses only one parameter − the number of bars to calculate. For convenience, the channel lines can be displayed in different colors.
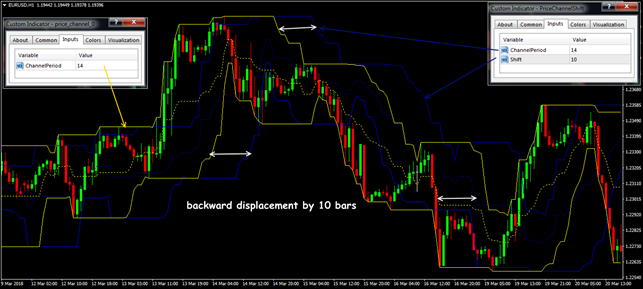
Modified variants of the indicator with an additional parameter of displacement Shift are used. It can have both positive and negative meanings.
In the first case, the shift is carried out to the right, in the second — to the left. The presence of a shift makes it easier to identify the price breaking through the channel boundaries.
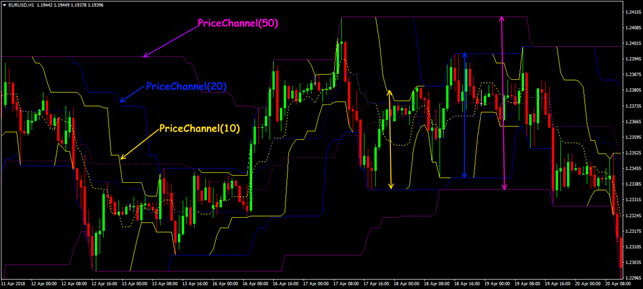
The calculation parameter is determined by the working timeframe: a too-short period will respond to all speculative throws and change the channel boundaries too often, a too-long period will not take into account fresh extrema inside the channel. In general, a range of 10–25 is recommended.
Richard Donchian recommended using the period of 20 – the average number of trading days per month; the parameters of 12 (14), 24, 50 give stable results for long-term strategies. By the way, “Turtles” used the parameter of 55 (to enter the deal).
The time has come for trading signals − let’s take a closer look!
Trade signals of the indicator
The Price Channel indicator lines represent the dynamic support/resistance levels. The classical trading with Price Channels provides for two approaches: the transactions at the breakdown of borders and transactions on a rollback to the range.
In the first scheme, we place a sell order at the breakdown of the lower limit, and a buy – at the breakdown of the upper limit. The best option is to work with pending orders and necessarily − after a retest of boundaries. The expansion of the channel zone indicates a strong trend (high volatility); if the boundaries converge – volatility falls – the market goes into a flat.
When working with Price Channel, the probability of breakdown is observed when the middle line approaches the lower or upper limit. If the channel width allows, it is possible to trade on the call/breakdown of the central line with targets, at least in the border zone.
Stop Loss is usually located outside the channel, but at a reasonable distance – not too far.
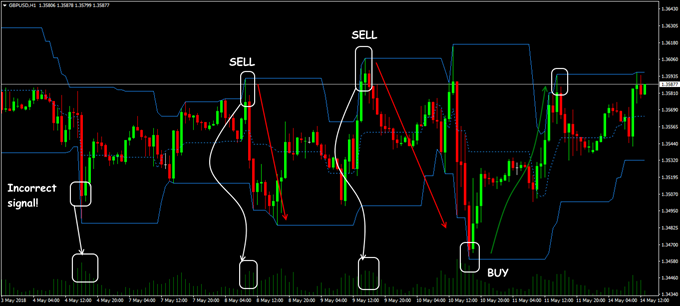
Sometimes there are situations when the price breaks the upper or lower limits of the Price Channel, but the candle closes within the range.
As a rule, such a candle has a long shadow, and the volumes exceed the average value. The work strategy, in this case, is obvious – it will be inverse to the classical scheme.
After the formation of “shadow breakdown”, a long position is opened at a breakdown of lower boundary, and a short position − at the breakdown of the upper one. Then the first goal is the middle of the channel, and the second is the opposite border. Stop Loss, in this case, is set very close – 1 to 3 points above/below the value of the key bar.
Countertrend trading in the Price Channel will be confident if there are additional serious signals of the upcoming reversal.
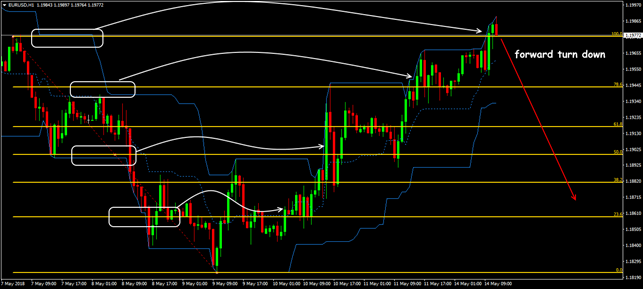
Critical points at the channel boundaries are effective for constructing Fib levels: shifting new boundaries to the zone of strong levels increases the signal reliability significantly.
What is the result?
Price Channel can be successfully used as a basic indicator of the channel for both the trend and the countertrend trading systems. But as you all know, one indicator doesn’t make a difference in the market. We’ll talk about it in the next section.
Application in trading strategies
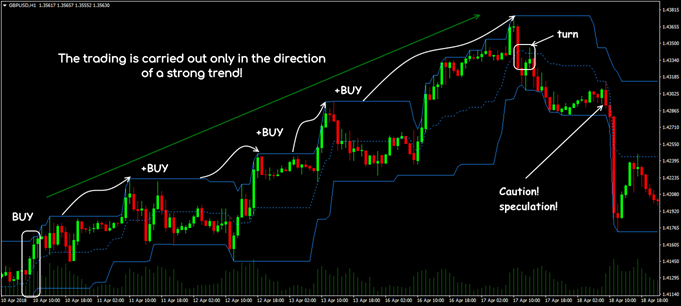
The main trend determines the direction of entry into the market, that is, in the bull market − only purchases are conducted, in the descending − sales only.
Particular attention is paid to the current market volumes: the price movement in the direction of the main (long) trend should occur at an increased volume and the movement against the trend − at a reduced volume. The culmination of volume may indicate the completion of the trend.
Long (narrow) consolidations can be a sign of a reversal and the formation of future strength levels. Short periods of flat are treated as temporary stops before the trend continuation (see EMA and Price Channel Trading Strategy).
Be sure to note that the indicator is being redrawn. Speculative price spikes quickly change the boundaries of the channel, and trading signals may not be correct. To reduce the risk of an unsuccessful entry, you should use the Price Channel in conjunction with any trend tool and try to trade only on a strong trend.
The most popular strategy on Price Channel indicator is described in a book «Street Smarts: …» by Linda Bradford Raschke and Laurence A. Connors, and it is called
«Turtle Soup Plus One»
The work rules for a long position (build yourself the algorithm for a sell):
- The market shows a new min, and the current bar closes outside the channel (the previous min − at least 3 candles earlier).
- We put the pending buy order at the next bar at the level of the previous min; if the order does not work out during this bar, the transaction is canceled.
- After the position opening, we set a Stop Loss of 1 to 3 points below the lower min.
- We close part of the transaction volume after 2 to 6 bars and then move Stop Loss using trailing until the price movement is fully worked out.
The classic Donchian Channel technique assumes the constant presence of open positions, so the trader has another problem – the exit points (or reversal).
The author of the strategy believed that a long position closes only at the moment a sell signal arrives (and vice versa). Perhaps this behavior is justified on the stock market, but it can be dangerous on Forex.
Therefore, for the correct output, we combine the Price Channel with indicators such as ADX — to control the trend strength, or ATR — to assess the current volatility.
The problem of the correct output can be solved using the following procedure.
The strategy with two indicators of Price Channel
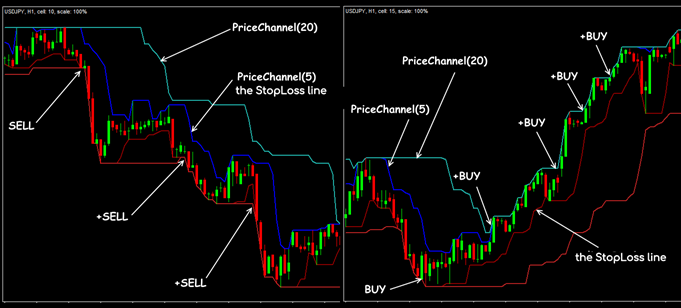
We build two channels with different periods on a chart. It means that we consider a buy signal to be a retreat of the support line with a shorter period from the line with a longer period.
Conversely, a sell signal is a rollback of the resistance line with a shorter period from a similar line with a longer period. For convenience, you can change the colors of the indicator lines so that they differ.
A few practical notes
The Price Channel indicator makes it much easier to work with support/resistance levels; it allows you to quickly determine the state of the market and the direction of the trend.
As for the significant drawbacks, only frequent adjustment of the channel boundaries can be noted, which makes it difficult to work at the time of a breakthrough, but this problem can be solved by applying the additional price filters.
We remind you: the analysis of fundamental factors and a clear risk management system make your trading with the Price Channel indicator more meaningful and profitable.
We recommend the Price Channel indicator to anyone who appreciates the accuracy and efficiency of technical analysis.
Try It Yourself
After all the sides of the indicator were revealed, it is right the time for you to try either it will become your tool #1 for trading.
In order to try the indicator performance alone or in the combination with other ones, you can use FTO with the historical data that comes along with the program.
Simply try Forex Tester Online now. In addition, you will receive 23 years of free historical data (easily downloadable straight from the software). Click the button below.
Share your personal experience of effective use of the Indicator Fractals. Was this article useful to you? It is important for us to know your opinion.
 Try Forex Tester Online
 ไทย
ไทย
 Tiếng Việt
 Polski
 Türkçe
 Nederlands
 Română
 한국어
한국어
 Svenska
