Summarize at:
Quantitative trading turns raw numbers into trading strategies. We feed historical market data into mathematical models, build a trading strategy, and let code make every trade. This method removes emotional bias, works in stocks, Forex, and crypto, and suits retail investors who want logic over gut feel. In this guide we explain what quantitative trading is, outline core principles, walk through key quant analysis – mean reversion, momentum, statistical arbitrage, algorithmic pattern recognition, and trend following – and show the exact steps to create and backtest a quantitative trading strategy.
By the end, you will know how to design a quant trading strategy, run a backtest, and turn data into trades. Let’s start already.
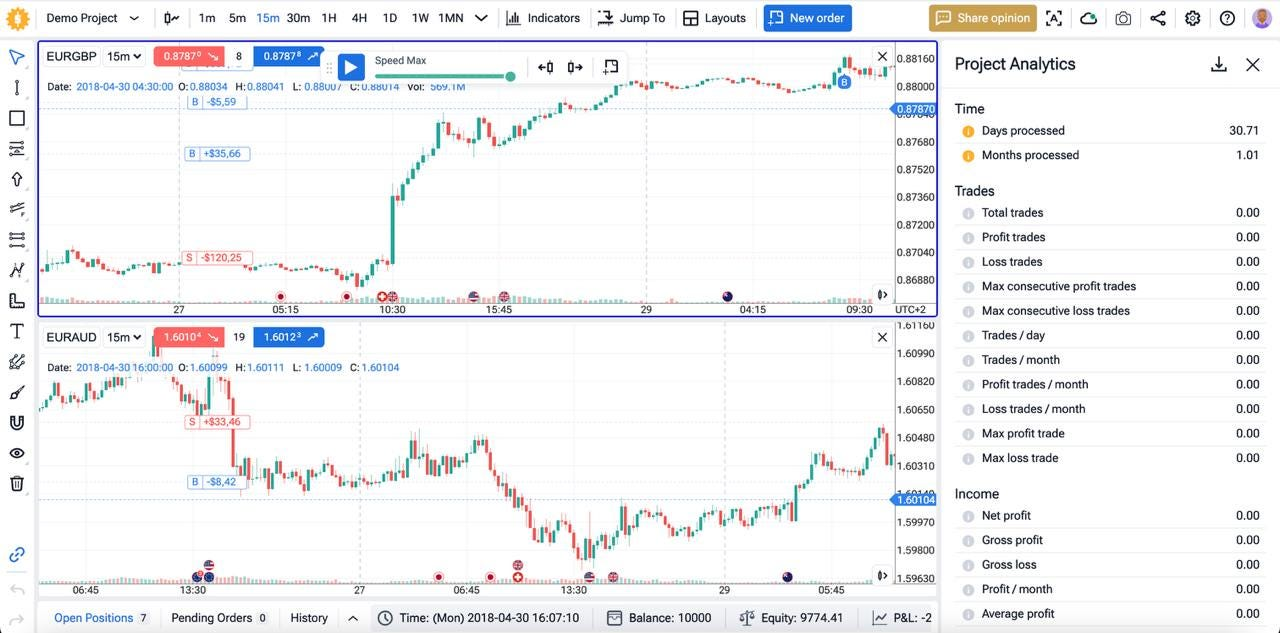
Image: Forex Tester Online interface
What Is Quantitative Trading?
Quantitative trading – often shortened to quant trading – uses mathematical formulas and computer code to spot trades. We build a quantitative trading strategy by feeding historical market data into a model, letting the model find patterns, and then automating orders through broker APIs.
The role of algorithms
Algorithms turn the math into action. They scan thousands of ticks per second, test each signal against preset rules, and place orders without hesitation. This speed and discipline beat manual clicks.
Core components
- Mathematical models: equations that predict price moves, volatility shifts, or spread changes.
- Data analysis: clean, high‑quality historical market data for backtesting and live feeds for execution.
- Automated code: Python, C++, or MQL scripts that translate the model into a trading strategy.
- Risk management: position sizing, stop‑loss logic, and portfolio limits baked into every function.
Put together, these parts form a self‑contained system that finds, tests, and trades edges across stocks, Forex, and crypto – all while keeping emotional bias out of the loop.
Make Numbers Work for You: Quantitative Strategy Principles
This part requires some technical skills and thoughtfulness. Read carefully.
- Start with a clear hypothesis. Every quant trading strategy begins with a testable idea – “price snaps back when two standard deviations from the mean” or “strong volume drives short‑term momentum.”
- Gather clean data. Use high‑quality historical market data. Filter out bad ticks, adjust for splits, and align timestamps. Dirty data breaks models.
- Translate the idea into math. Express the hypothesis as equations or logical rules. Moving averages, z‑scores, and probability thresholds are common tools.
- Code the algorithm. Write concise functions: data input, signal generation, order execution, risk management. Keep modules separate so bugs stay contained.
- Control risk at the code level. Hard stops, max daily loss, and position limits belong inside the script, not on a sticky note.
- Avoid overfitting. Split data into training and test sets. Use walk‑forward validation to see if the edge survives new market regimes.
- Measure everything. Track win rate, drawdown, Sharpe, latency, and slippage. Numbers tell you if the quantitative trading strategy still works.
- Automate reviews. Schedule scripts to flag unusual variance in PnL or execution speed. Fast alerts let you cut risk before damage spreads.
Follow these principles and the numbers will guide your quant trading decisions, not emotions.
Quantitative Trading Strategies List
Here are 5 basic strategies for example.
Mean Reversion
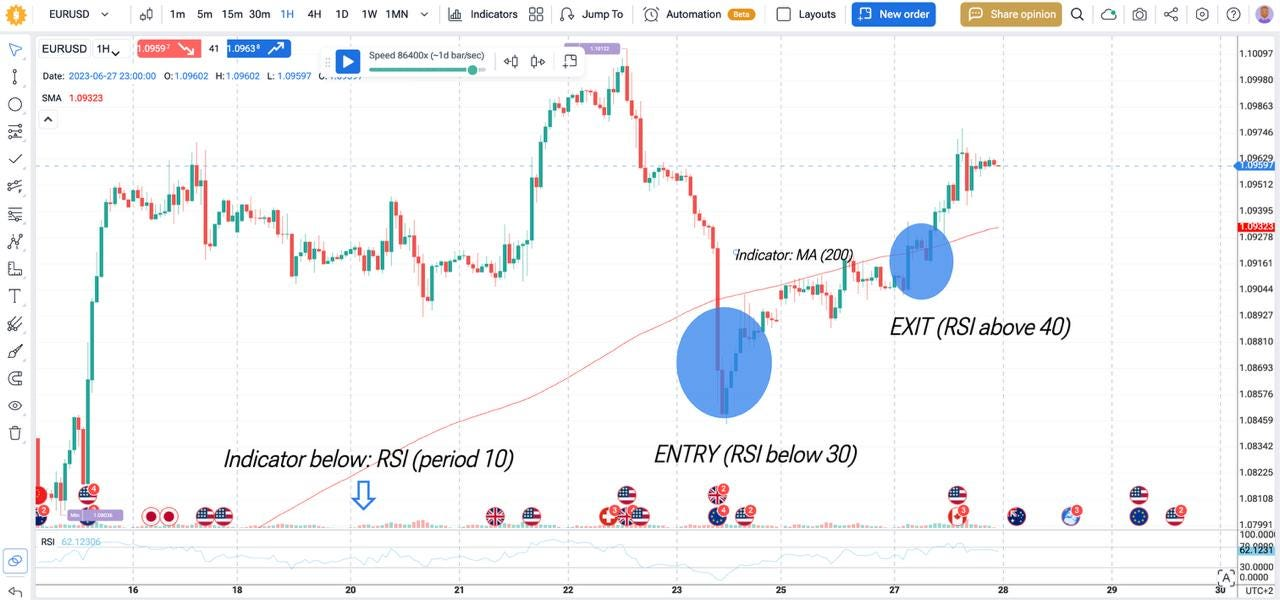
This quant trading strategy bets that price swings snap back to an average. We program the algorithm to watch a moving average, z‑score, or Bollinger Band. When price drifts two standard deviations away, the model fades the move and rides the “rubber‑band” pull toward the mean. Stop‑loss sits just outside the band to cap tail risk. Take‑profit lands at the moving average or half the gap, whichever comes first. Historical market data shows mean reversion works best in range‑bound Forex pairs and high‑liquidity equities with low news flow. Overfitting is a danger – always backtest on out‑of‑sample years. Add volatility filters so the script stands aside during trend days.
Momentum
Momentum is the opposite edge. This quantitative trading strategy buys strength and sells weakness. The algorithm ranks assets by 3‑ and 12‑month returns or a relative strength index. Top decile goes long; bottom decile goes short. Rebalance monthly to rotate into fresh leaders. Momentum thrives in equities and crypto where crowd psychology drives extended runs. Risk comes from sharp reversals, so the code pairs a trailing stop with a time stop. Use diversified baskets to cut single‑name shocks. Momentum remains one of the most studied quantitative trading strategies because it persists across markets and decades.
Statistical Arbitrage
Stat‑arb looks for temporary mispricings between related instruments. We build a pairs model that tracks the spread of two correlated stocks or ETFs. When the spread widens beyond a z‑score threshold, the algorithm goes long the cheap leg and short the expensive leg. Profit comes when the spread mean‑reverts. This quant trading strategy demands tight execution and low fees; slippage eats edge fast. Run high‑frequency data, model half‑life of the spread, and set hard exit timers to avoid drift. With proper risk management, stat‑arb delivers market‑neutral returns and low drawdown.
Algorithmic Pattern Recognition
Large orders leave footprints. Pattern‑recognition scripts scan real‑time order books, trade prints, and quote updates to detect hidden accumulation or distribution. We train the model on labeled data, then let it flag unusual volume clusters or iceberg orders. When the pattern shows up, the strategy joins the institutional flow ahead of price breakout. This automated method suits high‑liquidity futures and large‑cap stocks where depth data is rich. Latency matters: co‑located servers give the pattern‑recognition algorithm the microsecond edge needed to enter before the move.
Trend Following
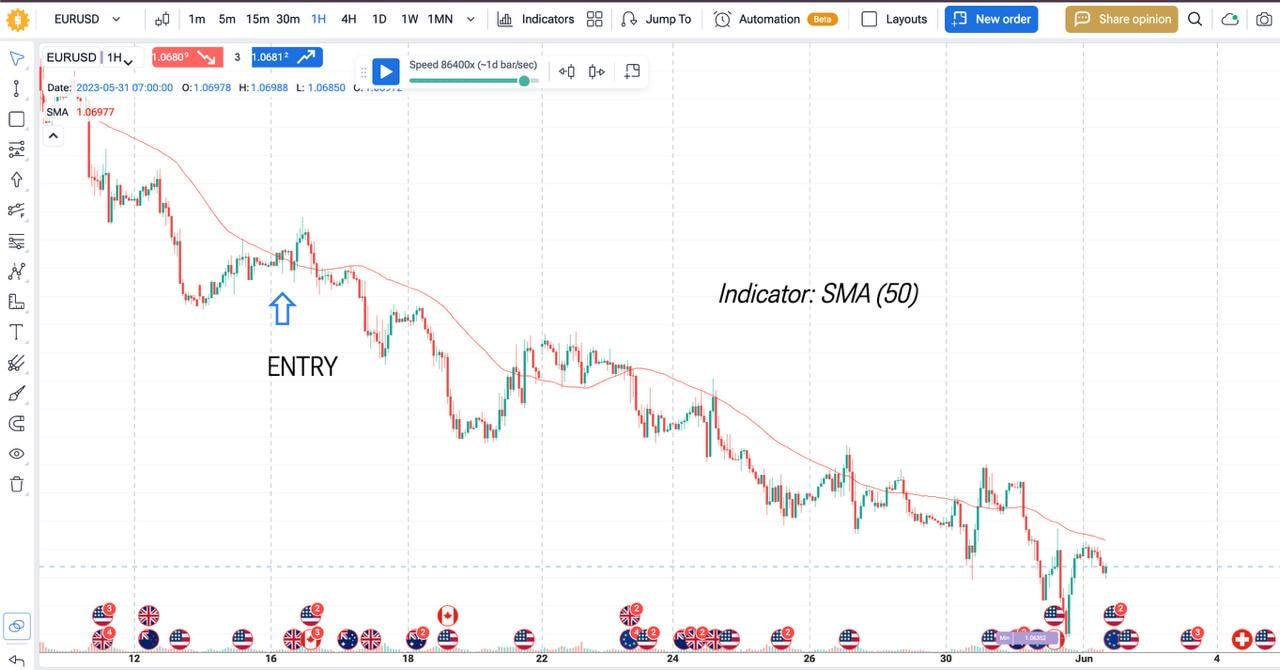
Trend following is timeless: ride the direction until it bends. The quant trading strategy uses moving‑average crossovers, ATR filters, and price‑action channels to confirm a trend. Long entries fire above the channel high; shorts below the channel low. Stops trail at a set ATR multiple. This strategy wins few trades but catches the big runs that pay for small losses. It works across futures, Forex, and crypto because it uses pure price data – no need for fundamentals. Backtesting on decades of historical market data shows trend following stays profitable, though drawdowns can be deep. Diversification across assets and timeframes smooths the curve.
Quant Traders Steps
It’s simple as long as you have basic trading and technical skills. Follow the steps.
Decide on a Strategy
Pick one quantitative trading strategy that fits your skills and market. Mean reversion suits calm price action; momentum favors fast trend. Retail investors often begin with simple algorithmic models, then scale to multi‑factor systems. Write the hypothesis down before you touch code.
Backtest
Pull clean historical market data. Run the model tick‑by‑tick. Use walk‑forward validation to spot overfit rules. Keep a log of every entry point, exit, and slippage figure. If the edge vanishes out‑of‑sample, rewrite the rules.
We will describe backtesting steps in the next part of this article.
Execute Trades
Connect the script to the broker’s API. Send automated orders only during liquid hours to cut spread cost. Monitor fill speed, error codes, and market sentiment shifts that may freeze the model. A slow fill can erase thin profit.
Apply Risk Management
Cap position size at a set account percentage. Add stop‑loss and time‑based exits into the code. Diversify across uncorrelated trading strategies to soften drawdown. Review risk metrics weekly; kill any quant trading strategy that breaches limits.
Build & Backtest a Quant Trading Strategy in Forex Tester Online
Forex Tester Online lets retail investors turn an idea into numbers fast. Key tools:
✅ 20 + years tick data
✅ News integration
✅ Mystery Mode to hide future bars if needed
✅ Custom technical indicators
✅ Ready‑made market scenarios
✅ Detailed analytics and latency logs
✅ Automation tab for Python or no‑code rules
We will now use FTO to backtest the “Trend Following” strategy as an example.
Follow these steps to start:
- Get access
Visit the site, compare plans, click Get Started, open an account, and finish payment.
- Create a project
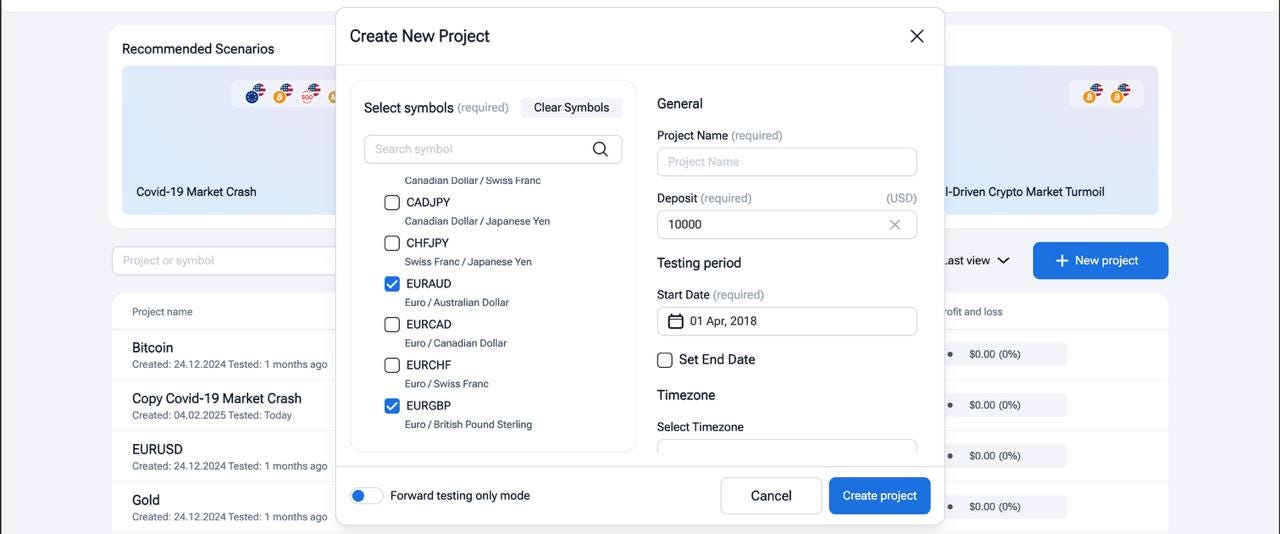
On the dashboard hit + New Project. Pick symbols, name the file, set a virtual deposit, choose start‑end dates, select your time zone, then press Play. Need inspiration? Load a preset scenario.
- Load or write your algorithm
Open Automation. Paste Python or MQL, or drag‑and‑drop rule blocks. Click Create Automation and link data feed, signal, and risk limits.
- Set test options
Enable Floating Spreads for real‑world costs. Toggle News Marks if your quant trading strategy filters events. Choose tick‑by‑tick for HFT or bar mode for slower systems. For example, let’s test the “Trend following” strategy.
- Run the backtest
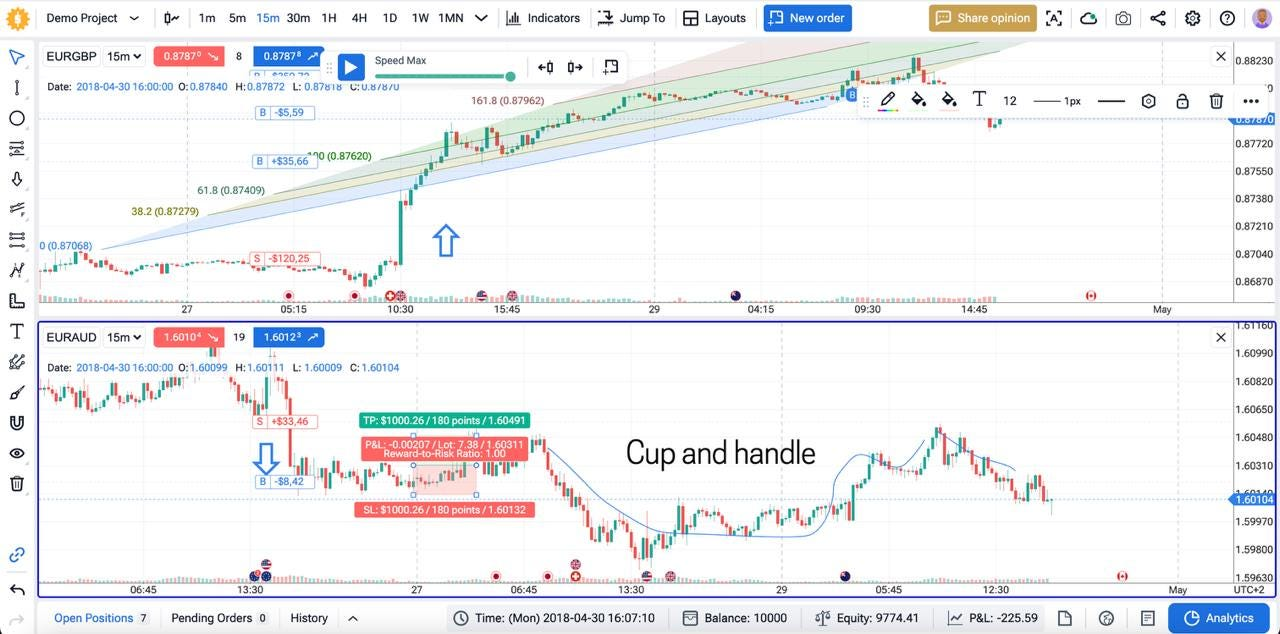
Press Start. The engine replays historical market data, shows each entry point live, or jump forward with Jump To for speed.
- Review analytics
Click Analytics. Check win rate, drawdown, Sharpe, and slippage. Export the CSV to study price breakout stats and execution speed.
- Iterate and optimize
Tweak parameters, re‑run, then walk‑forward on out‑of‑sample years. Keep versions; pick the curve that stays stable across market regimes. - Move toward live trading
Switch to real‑time demo. Log at least 50 trades to confirm fill speed and market sentiment shifts. If stats hold, deploy the script on a VPS near your broker.
Test your quantitative trading strategies in Forex Tester Online before risking a cent of real capital.
Conclusion
Quantitative trading strategies give numbers the final say. We code a quant strategy, feed it historical market data, and let the automated script trade. Good results come from clean data, strict risk limits, and steady reviews. Retail investors who follow the stats – not emotions – can scale these strategies across stocks, Forex, and crypto.
Disclaimer
Trading involves risk. The indicators in this article are for educational purposes only and are not financial advice. Past performance does not guarantee future results. Always test strategies before using real money.
FAQ
Is quantitative trading the same as algorithmic trading?
Not quite. Quantitative trading builds the math – statistical models, data filters, risk rules. Algorithmic trading automates the execution of those models. Most quant strategies become algorithmic once coded, but you can run quant logic by hand, and you can run simple automated rules with little math.
What is the best quant strategy?
No rule fits all. Mean reversion works in quiet ranges; momentum wins in a strong trend. Test several quant trading strategies and keep the one with the lowest drawdown.
Is quantitative trading profitable?
Yes, if the edge survives out‑of‑sample tests and live fills. Profit fades when fees, slippage, or new market conditions erase the model’s math.
Where can I find ideas for new strategies?
Read academic papers, scan GitHub code, and study open data sets. Use Forex Tester Online to run each idea on fresh historical market data before risking cash.
Forex Tester Online
Test your quant strategy before trading live
 ไทย
ไทย
 Tiếng Việt
 Polski
 Türkçe
 Nederlands
 Română
 한국어
한국어
 Svenska

