Summarize at:
Everyone has probably heard about the topic we want to reveal in the following article but the disputes among the traders seem to never stop. Support and resistance levels are the cornerstones of trading no matter what instrument you want to make use of. It is the most significant branch of knowledge that one should know to get profits on any kind of market.
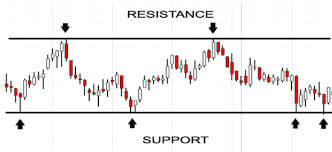
Support is the price area on the market when the price reaches some area, then pushes off this level and then eventually comes back some time later. If it happens twice then the double bottom or peak is formed. Here is a simple strategy everybody knows: buy at the support level and then close the trade and go short at the resistance level. Do this a couple of times a week and then you can quit your meaningless job.
How to draw these support/resistance levels in a proper way?
How to make money using it? Even the simplest strategies require skills and some basic knowledge.

At first we should distinguish what timeframe we should take a look at in order to succeed. We suggest that the best one to do that is a weekly chart. Of course there is also a monthly chart and you can look at it as well if you have a really long-term relationship with the market, but it is not a must – a weekly chart should be just enough.
After looking at a weekly chart and having the approximate levels of support/resistance drawn, you need to go to the smaller timeframe because there is a big deviation might occur when you will look at any smaller timeframe (for example, H1).
The next step we have to take is to look at a daily chart to adjust this level and set it a bit higher or a bit lower. Remember that a pixel on your monitors on a weekly chart can include ten or more pips so it is so important to go to a daily chart and fix this possible misunderstanding.
People often ask if they need to go to even smaller timeframes. Well, on our opinion it is not that important because the level is not a particular price but the area of prices and finding an extremely accurate price is not necessary. So, do not get obsessed with drawing a perfect line. The reason for that is simple: support/resistance levels are not lines but rectangles. Yes, rectangles that have a very short but still visible height.
And now we can hear your question about what prices should we use: open, high, low or close?
All the people ask that and we are glad you ponder at this question too. The most important prices are the close prices because they are formed by professionals, especially when it comes to the week chart. It is not that important on lower (H1 or H4) timeframes and it is absolutely beyond our interest at what price an M15 or an M5 bar was closed. But for daily and weekly charts it is crucial.
An open price of the week is just the first price when the trading has begun. It should be mentioned that on every market and with every instrument novice set those open prices because they think that the earlier they get up the more trades they will be able to accomplish and therefore the more money they can make. Do not let others to trick you so please do NOT take into consideration these prices.
Highs and lows are usually formed when the big news with macroeconomic data is released. After a swift motion either up or down within the week the prices usually return back to its real value. That is why do not rely on these ones too.
Returning back to close prices we must say that they appear when the amateurs are already gone and there is no big news. The close price is the price on which the traders of the entire world will concentrate their attention during the next week.
Now we encourage you to consider the piece of advice above and check whether we are right or not. Because we all know that someone else’s advice is nothing until it is incorporated into your trading system with some adjustments for it and your personality.
 Try our Forex Backtesting Platform
 ไทย
ไทย
 Tiếng Việt
 Polski
 Türkçe
 Nederlands
 Română
 한국어
한국어
 Svenska


