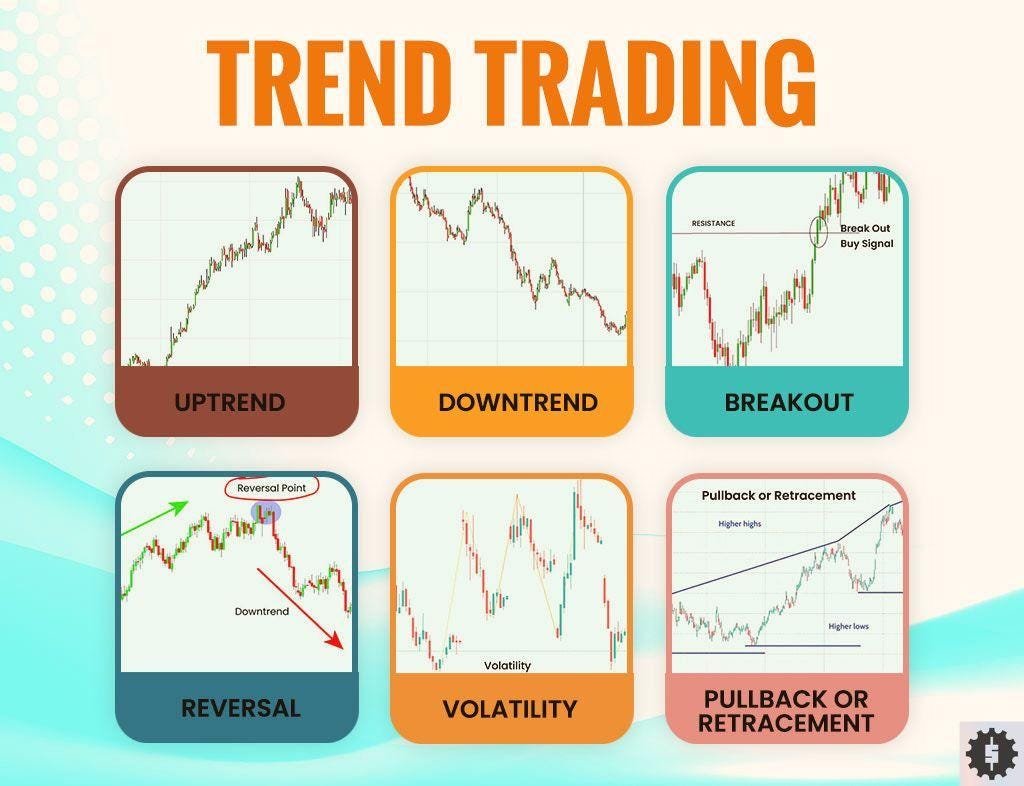
Trend trading means trading the trend you can see, not guessing the next turn. Traders spot a clear uptrend or downtrend, enter with the flow, and let profits run while cutting losses fast. The core rule is simple: “ride strong moves, exit weak ones.” Because market trends repeat across stocks, forex, commodities, and futures, trend following remains one of the most used and tested trading strategies for retail and institutional desks alike. This guide shows how to identify trends, pick indicators, plan entries and exits, and manage risk. Let’s start.
What Is Trend Trading and How to Follow It?
Trend trading is a systematic way to profit from sustained market trends. The trader waits until price action proves a clear direction – higher highs for an uptrend, lower lows for a downtrend – then trades in that same direction. No forecast, only reaction.
Trend followers accept that most markets move in ranges but occasionally break into strong runs. Those runs deliver outsized gains that cover many small losses. The method tracks the move with fixed trading rules: enter on confirmation, trail a stop loss, and exit only when price shows a real trend reversal.
Because price patterns are fractal, the strategy works on any liquid asset:
- Stocks – long a tech share making new 20‑day highs.
- Forex – short a currency pair hitting fresh lows.
- Commodities – ride a gold rally above a rising 100‑day average.
- Futures markets – follow a bond sell‑off through multi‑month lows.
Tools vary, yet the mindset stays the same: obey signals, ignore noise, let math – not hope – dictate trades.
Core Principles of Trend Following Trading
Trend following stands on a few clear ideas:
Identify the trend
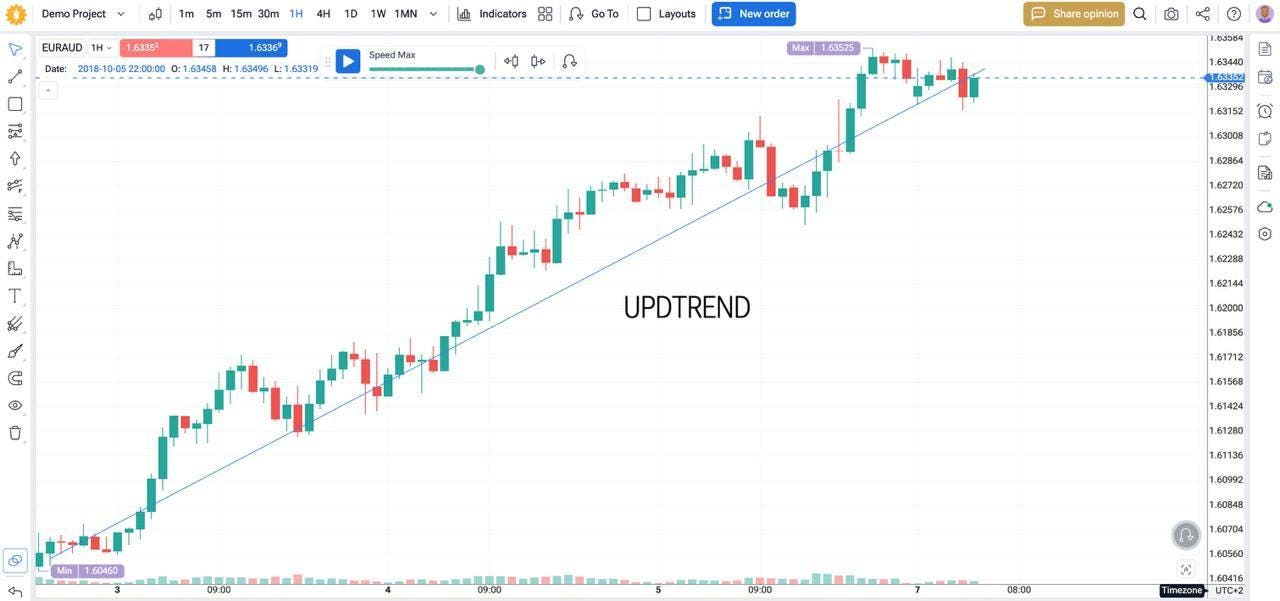
- Uptrend: price prints higher highs and higher lows.
- Downtrend: price makes lower lows and lower highs.
- Sideways: price moves inside a flat range; trend traders often wait.
Draw clean trendlines or use moving averages to see the direction quickly.
Pick the right timeframe
- Short‑term trends of trading live on 15‑minute to four‑hour charts.
- Long‑term trends live on daily and weekly charts.
Match your trade duration to the chart you watch. Short charts bring more trades and more noise. Long charts bring fewer trades and larger swings.
Follow trading rules, not feelings
Create a written set of trading rules for entry, exit, and stop loss. Then follow them every time. Systematic trading cuts second‑guessing and keeps discipline when market trends stretch or stall.
Manage risk first
Size each position so one loss hurts little. Move the stop loss as the trend moves in your favor. A strict risk plan protects the account during inevitable drawdowns.
Stay patient, respect the rules, and the trend will tell you when to trade and when to stand aside.
Trend Trading vs Swing Trading
Swing trading aims to catch shorter price swings inside a wider move. Trades last a few days, sometimes a week. Trend trading holds positions for weeks or months until the main direction bends. Both use technical analysis, but their timing and goals differ.
| Factor | Trend trading | Swing trading |
|---|---|---|
| Typical holding period | Weeks to months | Days to a week |
| Trade frequency | Low; a few trades per month | Higher; many trades per month |
| Risk/reward focus | Larger targets, wider stop loss | Tighter targets, closer stop loss |
| Key tools | Moving averages, Donchian channels, long trendlines | RSI, Fibonacci retracements, candlestick patterns |
| Market aim | Ride full market trends | Capture interim pullbacks and bounces |
Trend traders wait for confirmed breakout signals and accept more open‑profit volatility. Swing traders time entries near support or resistance, looking for quick wins with smaller drawdowns. A trader can learn both: use swing trades to add or peel off size within a bigger trend position, improving overall trading strategy and market flexibility.
Key Technical Indicators for Trend Trading
Moving averages
Simple and exponential moving averages smooth price action. A rising 50‑day average signals an uptrend; a cross above the 200‑day average gives a long entry signal. Many traders use the 20‑50 cross for short‑term trend following.
MACD
The moving average convergence divergence plots the distance between two moving averages. When MACD crosses above its signal line, momentum is rising; below, momentum is falling. The histogram helps spot early trend shifts.
RSI
The relative strength index shows overbought and oversold zones. In trend trading the RSI is most useful for filtering entries – avoid fresh longs when RSI is already above 70; look for longs when RSI holds above 50 during a pullback.
Trendlines and channels
Draw a straight line under higher lows in an uptrend or above lower highs in a downtrend. Channels add a parallel line to map potential exit levels and support and resistance.
Parabolic SAR
Dots appear below price in uptrends and above price in downtrends. A flip in dot position offers simple exit or stop loss adjustment signals.
Donchian channels
Created by Richard Donchian for systematic trading, the channels plot the highest high and lowest low over a chosen period, often 20 days. A breakout above the upper band is a classic entry and exit signal for long‑term trend following systems like Turtle Trading.
These technical indicators give clear entry and exit signals, confirm price momentum, and help manage trades inside a trend trading strategy.
Entry and Exit Strategies
Entry signals
- Moving average crossover: buy when the 20‑day average crosses above the 50‑day in an uptrend; sell when it crosses below in a downtrend.
- Breakout strategy: go long on a daily close above the 20‑day Donchian channel; go short on a close below the lower band.
- Confirm with MACD or RSI to avoid weak moves.
Exit rules
- Stop loss: place it just beyond the most recent swing low in an uptrend or swing high in a downtrend.
- Trailing stop: move the stop using Parabolic SAR dots or a fixed ATR distance to lock in gains as price momentum continues.
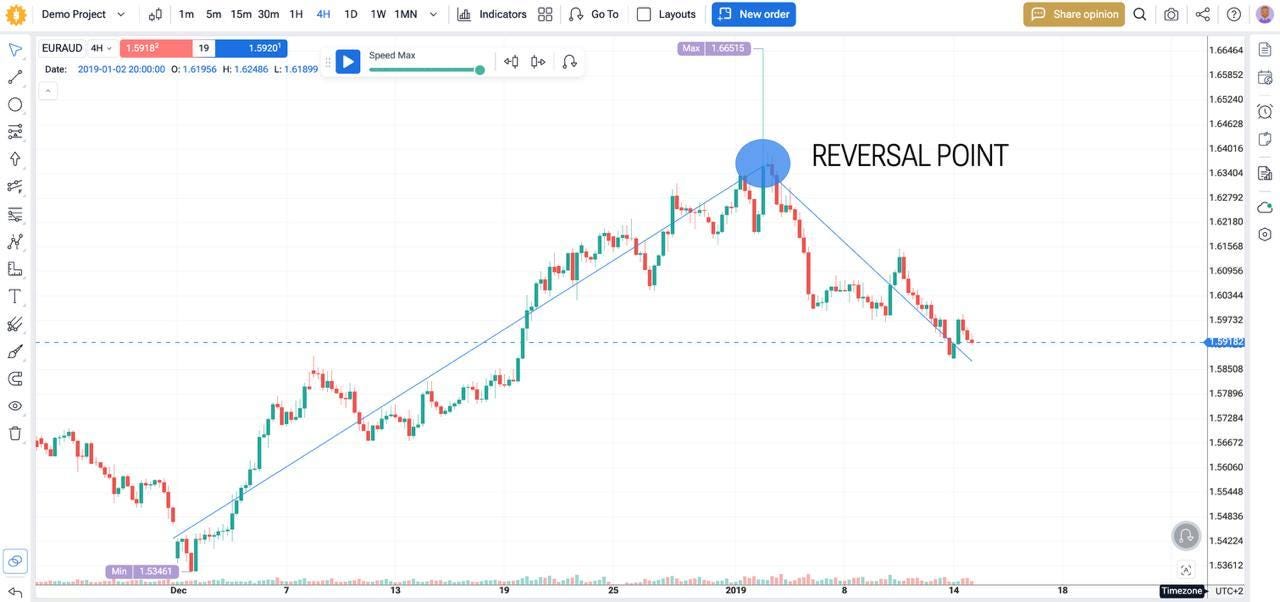
- Trend reversal: close the position when the 20‑day average flips against your trade or when MACD crosses the signal line in the opposite direction.
Common mistakes
Late entries happen when traders chase a breakout after a long candle. Set alerts so you act at the close, not hours later.
Early exits cut winning trades short. Trust the trailing stop and ignore small pullbacks.
Skipping a stop loss can ruin the win rate. Always set a stop before sending the order.
Risk Management in Trend Trading
Effective risk management keeps trend followers in the game when markets whip back.
Position sizing
Risk a fixed fraction of equity – often 1 % – on each trade. Calculate lot size by dividing the dollar risk by stop‑loss distance. This caps losses during losing streaks.
Managing drawdowns
Use a daily or weekly loss limit. If losses hit 4 % in a week, stop trading and review the system. Small pauses protect the account and trading psychology.
Trailing stops and breakeven moves
Once price gains one ATR in your favor, move the stop loss to breakeven. As the trend strengthens, trail the stop one ATR behind price or follow Parabolic SAR dots.
Avoid overtrading
Stick to verified trading rules. Skipping setups reduces emotional mistakes and filters weak trends.
Diversify across assets
Spread risk across uncorrelated markets – forex, commodities, and indices. Portfolio diversification smooths equity curves and lowers overall drawdowns.
Also read: Best Forex Risk Management
Tools and Software to Support Trend Trading
Modern traders rely on good screens and solid data.
Charting and live execution
- TradingView offers clean charts, trendlines, and moving average alerts.
- MetaTrader and Thinkorswim let you place orders, run indicators, and set automated alerts for breakouts.
- Many platforms now allow simple algorithmic trading scripts for systematic trading of crossover or breakout rules.
Backtesting trends
Forex Tester Online turns historic price data into a trading simulator.
- Import 20 + years of tick data for forex, crypto, stocks, or commodities.
- Code a moving average crossover, Donchian breakout, or momentum investing rule in the Automation tab.
- Hit Start and watch trades fire tick‑by‑tick.
- Review win rate, drawdowns, and equity curve, then tweak stop loss and position size until the trend trading strategy stays profitable out‑of‑sample.
Optimizing strategies via Forex Tester Online
Use the built‑in optimizer in Forex Tester Online or platform‑specific tools to scan parameter grids – moving average lengths, ATR stops, channel widths – and find stable zones. Always forward‑test the final set on live demo data before risking cash.
Besides basic backtesting tools, FTO has mystery mode, custom indicators, scenarios, “Jump to”, news integration, and more.
Here is a short quick-start guide:
1) Register on the FTO website to get started.
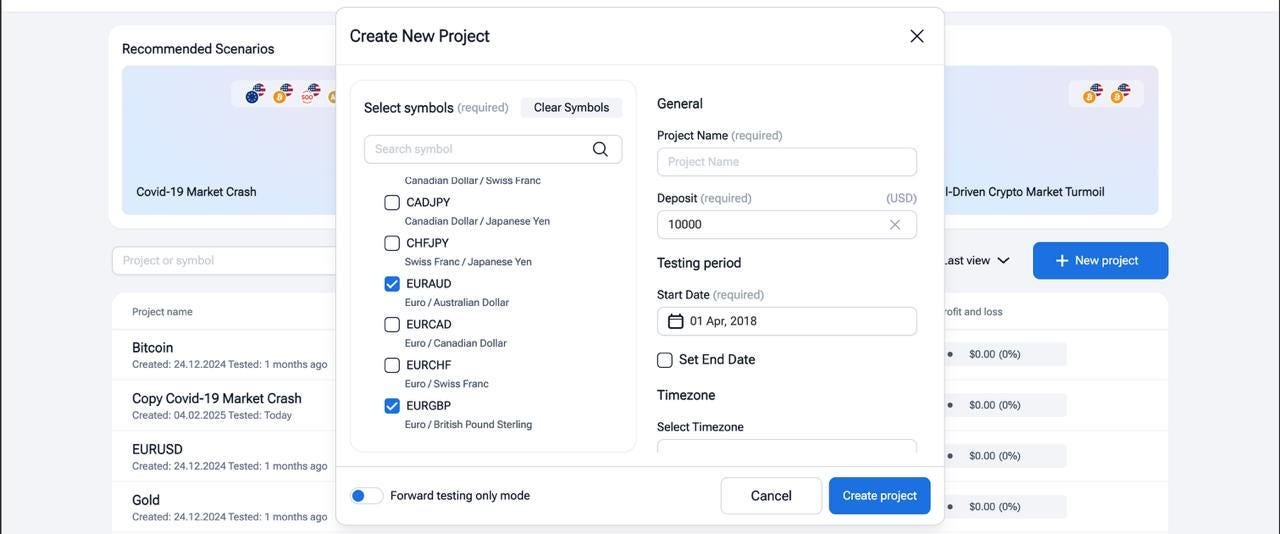
2) Then, create and launch a project.
3) Finally, you can use all the backtesting tools you need to test your strategy!
With the right trading platforms and disciplined backtesting, trend traders can follow trends with confidence and clear trading rules.
Conclusion
Trend trading remains a proven trading strategy because it follows one simple truth: strong market trends can run far longer than most traders expect. By waiting for clear trendlines, confirming with moving averages or MACD, and using strict risk management, traders can capture those big moves while keeping drawdowns small. Combine solid technical analysis with thorough backtesting in Forex Tester Online, and you give every trend following system a real‑world stress test before money is on the line. Start small, trust your rules, and let winning trends do the heavy lifting.
Disclaimer
Trading involves risk. The indicators in this article are for educational purposes only and are not financial advice. Past performance does not guarantee future results. Always test strategies before using real money.
FAQ
Is trend trading suitable for beginners?
Yes, if beginners follow simple trading rules and keep risk per trade low. Backtesting first helps build confidence.
What markets are best for trend trading?
Liquid markets with clear price momentum – major forex pairs, large‑cap stocks, commodities, and stock index futures.
How much capital do you need to get started?
You can begin with a small account, but risk only 1% of equity per trade. Position size matters more than account size.
Can trend trading be automated?
Absolutely. Many traders run systematic trading scripts that enter on moving average crossovers and trail stops automatically.
 Backtest Trend Trading on Forex Tester Online
 ไทย
ไทย
 Tiếng Việt
 Polski
 Türkçe
 Nederlands
 Română
 한국어
한국어
 Svenska


