Summarize at:
🤪 Noob: doesn’t know trading patterns
😅 Beginner: knows some trading patterns
🤔 Amateur: knows patterns and knows how to use them
🥷 Pro: knows patterns, knows how, and WHEN to use them
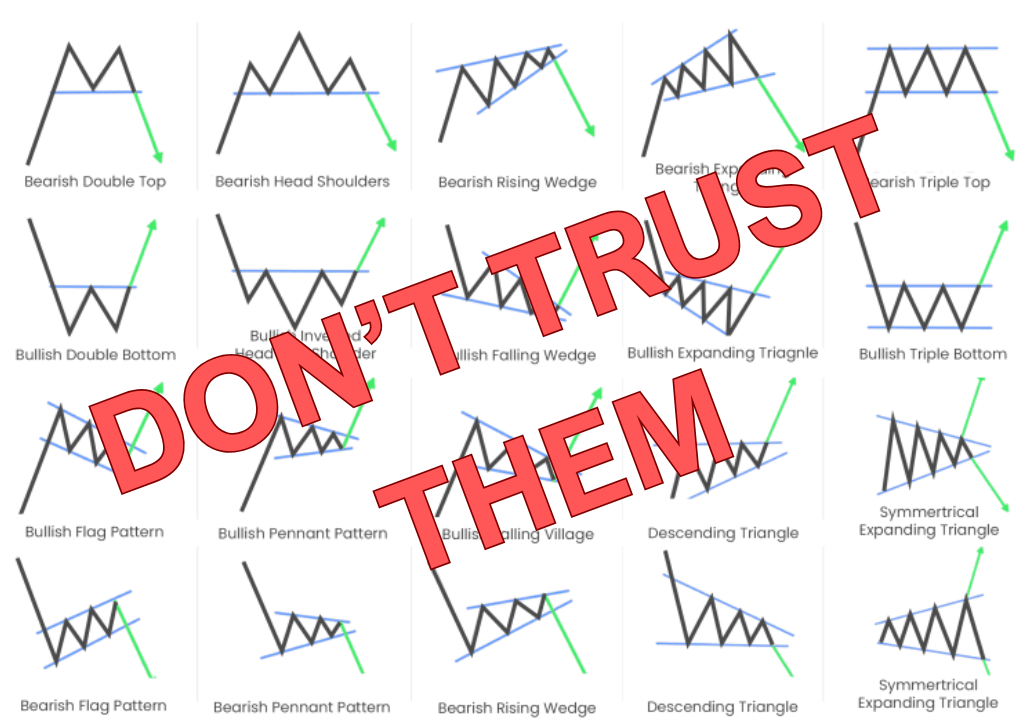
Trading patterns are a go-to tool for many traders. They help identify potential price movements and provide a structured way to approach the markets. But here’s the catch — patterns don’t always work. Markets are unpredictable, and even the most reliable setups can fail under certain conditions. Understanding why patterns fail is just as important as knowing how to trade them.

In this article, we’ll cover 4 common cases where trading patterns can mislead you: false breakouts, market noise, and improper context. Knowing these pitfalls can save you from costly mistakes and improve your trading edge.
1. False Breakout
Those fake signals that can fool you and ruin a solid trade setup. Let’s look at this trap using a real case example.
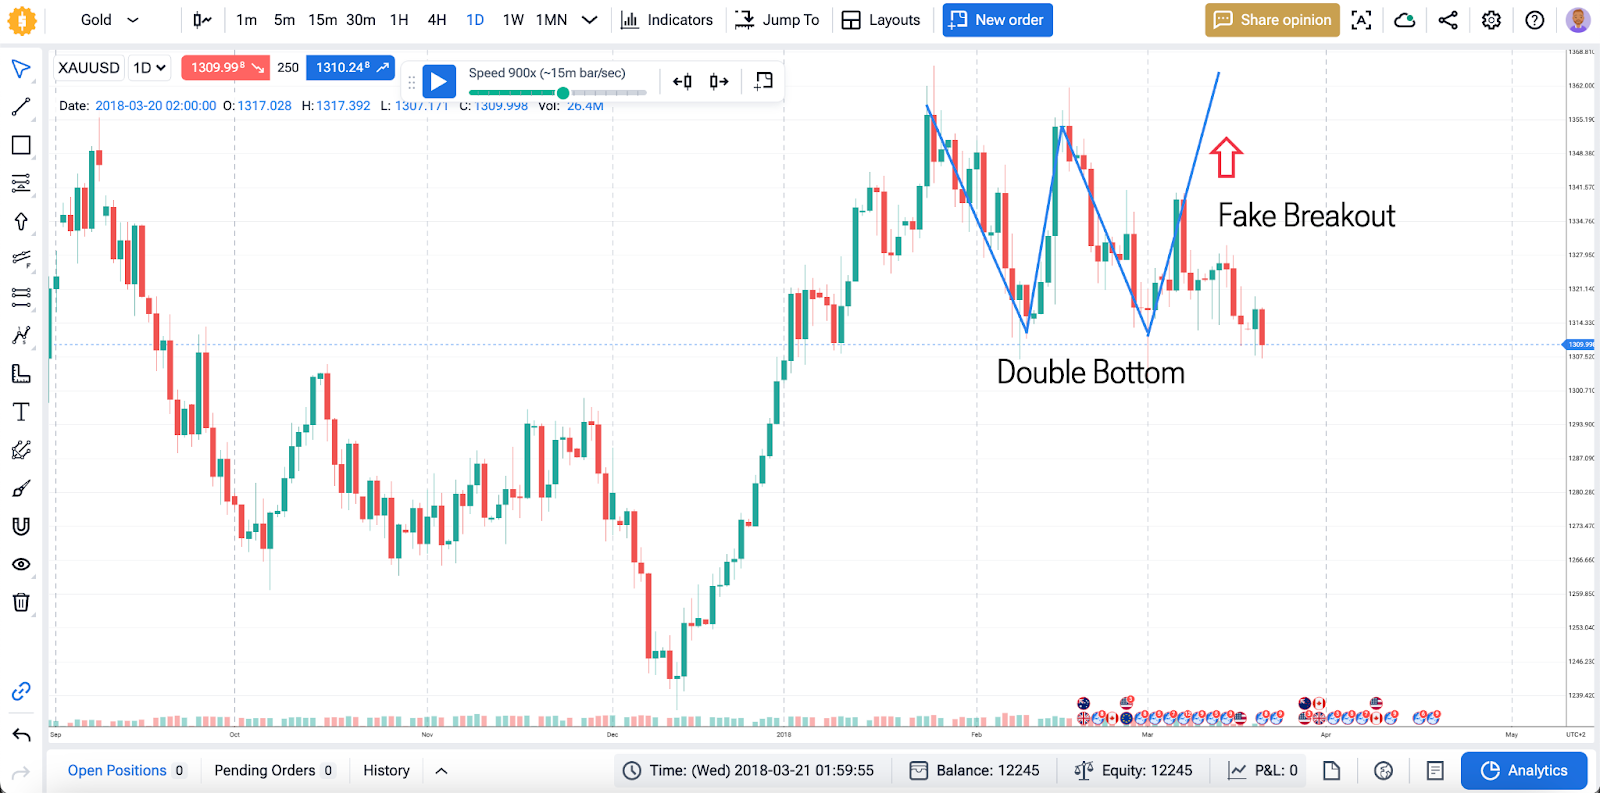
Imagine that you’re watching the XAUUSD pair. that’s been stuck in a range for days. The price keeps bouncing between $1310 and $1350. You notice the potential “Double Bottom” pattern. You’re pumped because it looks like a classic breakout is about to happen.
Finally, the price hits $1320, then $1335, and pushes higher. It breaks out of the range, climbing to $1350 and up. You’re convinced this is it — the start of a new uptrend, the pattern can’t lie (can it?). You jump in long, placing your stop just below $1320, where the breakout happened. Looks safe.
But here’s what happens next. Suddenly, sellers come out of nowhere. The price drops back below $1320. You think, “Okay, just a small pullback.” But it keeps falling — fast. It crashes back into the range, hitting $1310, and risking falling even more. Your stop gets hit, and you’re out, watching your money vanish.

Turns out, it was a fakeout. The big players, like institutions or market makers, might’ve pumped the price to lure traders like you. Once you’re in, they dump their shares, sending the price back down. You got shaken out.
What can you learn?
- Don’t trust breakouts without volume confirmation. If there’s no strong volume, it’s often fake.
- Wait for a retest. After the breakout, see if the price holds above the level before entering.
- Use a wider stop or smaller position size if you’re unsure.
False breakouts happen to everyone. Don’t let them get in your head. Stay cool, and remember — it’s all part of the game.
2. Market Noise
Now, let’s talk about market noise - annoying junk that messes with your trades.
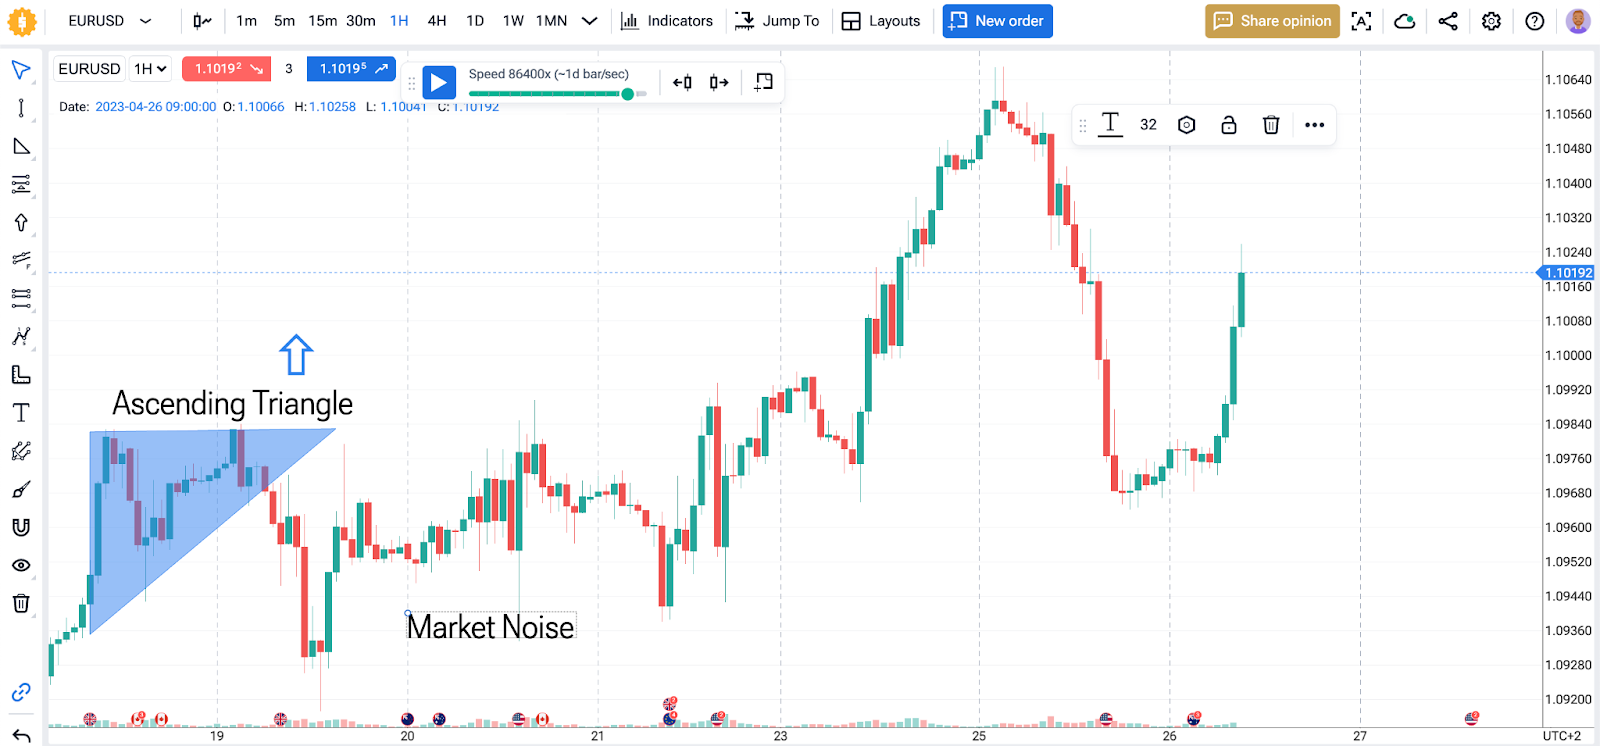
You’re checking out a currency pair, EUR/USD. It’s been moving sideways, but you spot a triangle pattern forming. Nice. You’re thinking, “This thing’s gonna break soon. I’ll catch the move.”
You watch like a hawk. Suddenly, the price breaks out to the upside. Boom! It’s exactly what you were waiting for. You go long, feeling pretty smart. But then, out of nowhere, the price starts to whipsaw. It drops back into the triangle, shoots back up, then dips again.

You’re staring at the chart, confused. “What’s going on here?” No clear trend. Just random wiggles up and down. Your stop gets hit on one of the dips. Then, a minute later, the price takes off in the direction you first thought. Too late — you’re already out.
What happened? That’s market noise — random price movements caused by low volume, algo trades, or traders reacting to nothing important. It’s like static on a radio. No real direction, just chaos. This time, the trading pattern didn’t work.
How do you deal with it?
- Stick to higher timeframes. Noise is worse on short timeframes like 1-minute or 5-minute charts.
- Wait for clear signals. If the move looks messy, it probably is. Don’t force it.
- Avoid trading during low-volume times. Late at night or right before big news? Skip it.
Market noise is like quicksand — it’ll drag you down if you’re not careful. Stay patient, and don’t let it mess with your head.
3. Fundamental Events
Let’s talk about how fundamental events can completely flip a trading pattern. Here’s a real example involving S&P 500 index in late 2024.
It’s late October, and SPX500 has been forming a bearish Inverted Cup and Handle pattern. Traders are watching closely. The price keeps bouncing lower, with support around $5700. Some expect a breakdown soon. The pattern is textbook — lower highs and flat support. Classic bearish vibes.
But then, the U.S. election results start to take shape. By November 6–8, it becomes clear that Donald Trump is the likely winner. Traders start celebrating — Trump is viewed as a more favorable candidate for most American businesses, as an opponent of raising taxes on large businesses and a supporter of creating conditions for American industry. Expectations of better regulations and friendlier policies send a wave of optimism into the market.

Suddenly, S&P breaks out — but upward, not down. It blasts past $6000, completely invalidating the bearish pattern. This event was too obvious to miss. But if you only see technical patterns and ignore the fundamental events, you could not pay enough attention to the elections.
This lesson can also be extended to smaller, more local events that can also break a technical pattern.
Takeaways:
- Fundamental news overrides technicals. Patterns work until big news changes the narrative.
- Keep an eye on macro events. Elections, regulations, or major policy shifts can completely reshape markets.
- Be flexible with your trades. Don’t marry a bearish view if the fundamentals suddenly turn bullish.
Traders underestimated how quickly sentiment could shift due to political events. Pay more attention to the big picture.
4. Improper Context
Let’s talk about improper context — a mistake that misleads you, even when you are confident about the pattern.
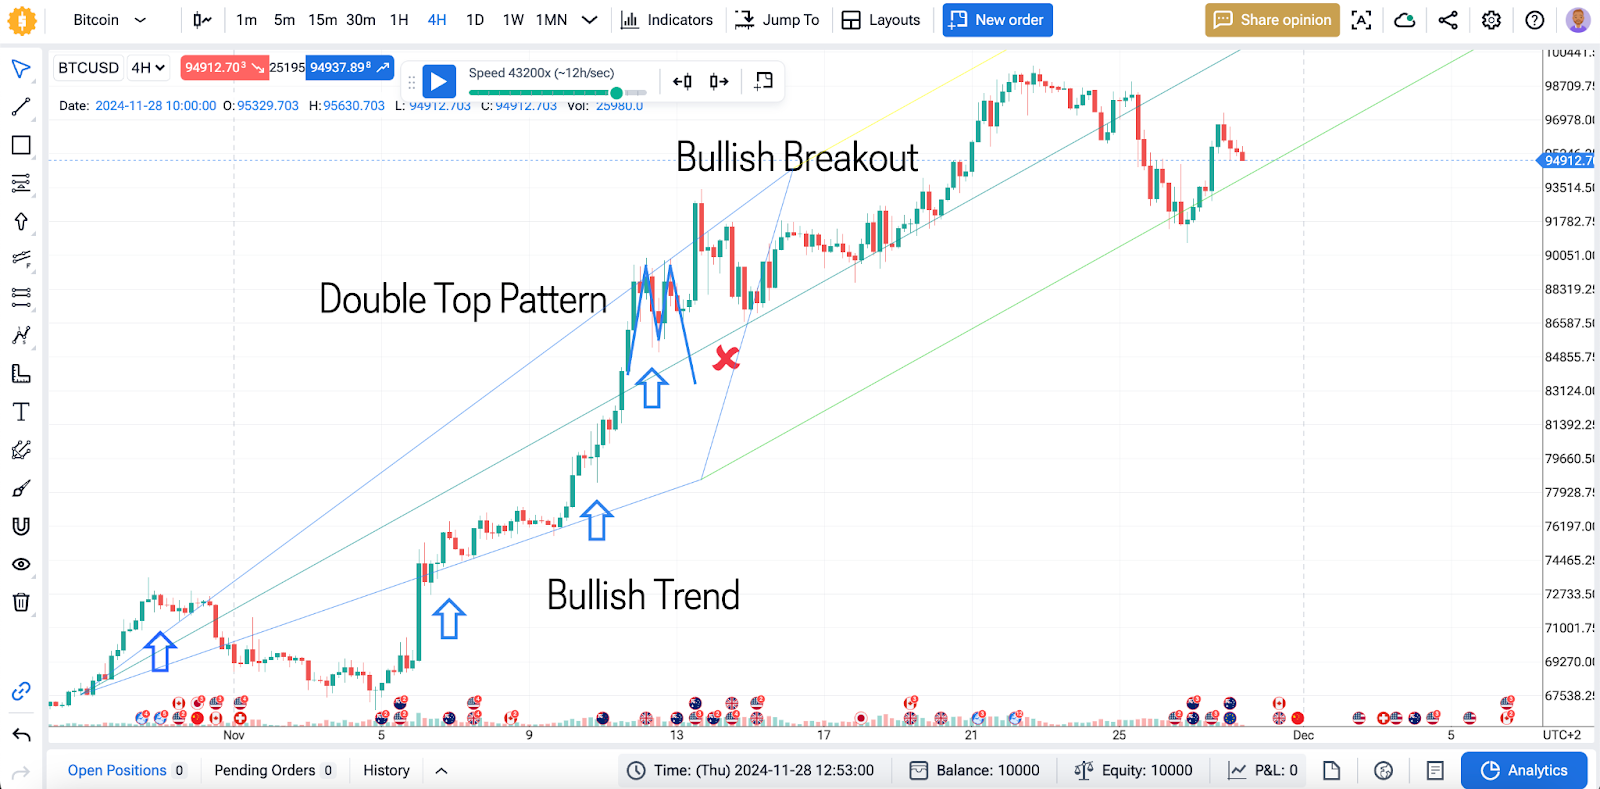
You’re analyzing Bitcoin during a strong bull market in late 2024. The stock has been flying high for weeks, breaking records. But now you notice something interesting — a Double Top pattern forming on the 4-hour chart. Textbook stuff. You think, “This is my chance to short. The downtrend is coming.”
You open a short position as soon as the price breaks below the pennant. At first, it looks great. The price dips a bit, and you feel like a genius. Then — boom. Buyers step in out of nowhere. The price rockets higher, blasting through your stop-loss and leaving your short trade in the dust.

What went wrong? You were trying to trade a bearish pattern in a bullish market. The overall trend didn’t match your setup. In the bigger context, Bitcoin was riding massive bullish momentum. That little pennant was just a minor pause, not the start of a new downtrend.
Patterns can’t work alone — they need the right context. A bearish signal in a bullish market (or vice versa) is often just noise. Traders who focus on small timeframes without considering the bigger picture can get wrecked.
How to avoid it?
- Start with the bigger trend. Check the daily or weekly chart first. Are you trading against the tide?
- Match your pattern to the context. Bearish patterns are more reliable in downtrends, bullish ones in uptrends.
- Don’t zoom in too much. Small time frames can mislead you. Always cross-check with longer timeframes.
Trading without context is like swimming against the current. You’ll lose every time. Always ask yourself: does my setup match the bigger picture? If not, it’s better to sit it out. Don’t trade against the trend.
Also read: 40 Trading Strategies Explained in Detail
Summary
Here’s a quick summary for all cases when trading patterns don’t work:
- False Breakouts. Price breaks a key level but reverses due to low volume or big players trapping traders.
- Market Noise. Random, unpredictable price movements caused by low volume or algo trades.
- Fundamental Events. News overrides technical setups.
- Improper Context. Trading a pattern without aligning it with the larger trend.
These mistakes happen to everyone. Recognize them, adapt, and avoid. Use Forex Tester Online to sharpen your trading skills risk-free on historical data.
Forex Tester Online
Keep your trading strategies working by backtesting them with our trading simulator
 ไทย
ไทย
 Tiếng Việt
 Polski
 Türkçe
 Nederlands
 Română
 한국어
한국어
 Svenska


