We offer classical option for sure trade.
The Alligator indicator uses the idea of the moving average and the theory of fractals in the original interpretation of Bill Williams.
The author’s description in books «Trading Chaos: Maximize Profits with Proven Technical Techniques» and «New Trading Dimensions…» in general coincides with the mechanism of the modern tool.
Logic and purpose
The financial markets spend 70-80% of trade time in the range without the obvious direction and only 20-30% − in a condition of a trend optimum for profit.
Purpose of the indicator the Alligator as the making element of the well-known strategy Profitunity – to filter the flat periods, to give a signal of the beginning/termination and to estimate trend force.
Technically the idea is implemented by means of the moving averages displaced forward («in the future») on the different number of bars.
It allows executing the short-term and medium-term forecast of the price, but the quality of signals strongly depends on stability of the market.
The problem of speculative throws of the price is solved by smoothing (by Smoothed method) and also the by application of PriceMedian instead of PriceClose.
On the small periods, it poorly helps, therefore, the Alligator indicator is most effective in medium-term strategy.
Calculation procedure
The Alligator uses a set of moving averages with different parameters of the shift.
The average price, necessary for calculation, is defined as: PriceMedian = (PriceHigh + PriceLow)/2.
The calculation begins with the value of simple moving average, and further, it is calculated by a formula:
(SMMAi) = (SUM(1) – (SMMAi-1) + PriceMedian(i)) / N
where
- SMMA(i) — smoothed value of the current bar (without the price of the first);
- SUM(1) — the sum of PriceMedian within N periods (since the previous bar);
- (SMMAi-1) — smoothed value of the previous bar;
- PriceMedian (i) — the average price of the current bar.
Three dynamic lines appear on the price schedule:
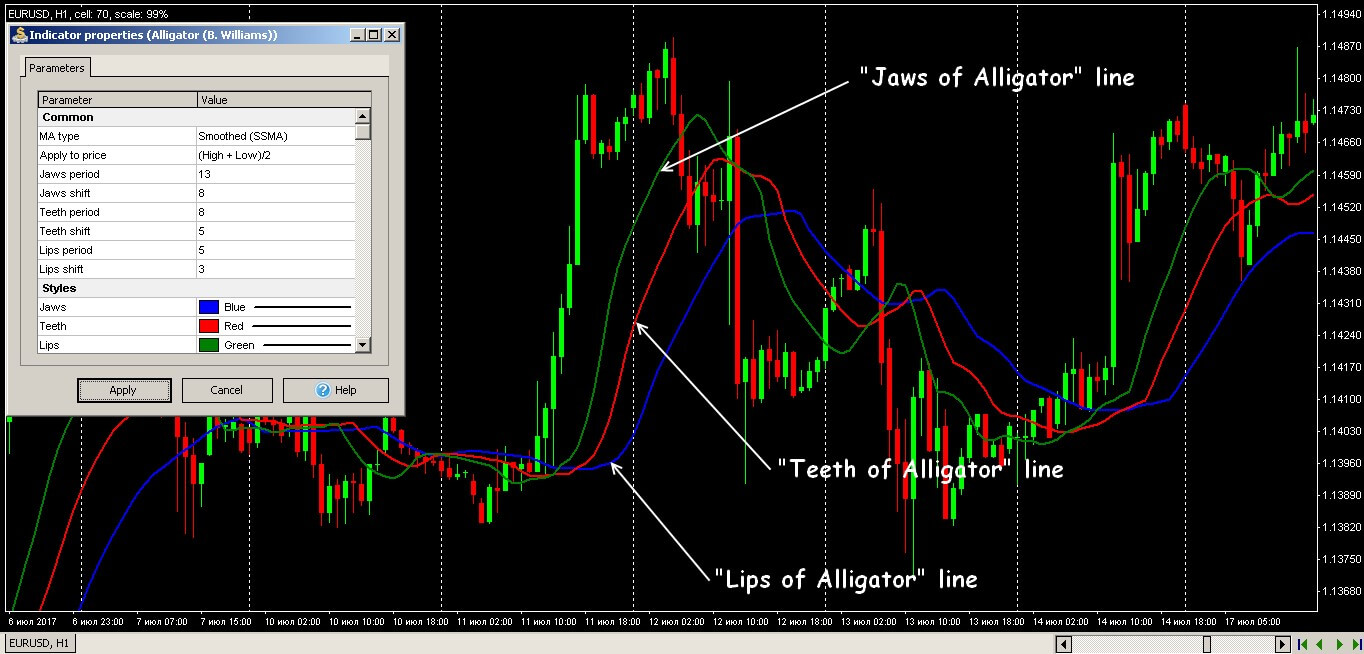
- SMMA (MedianPrice; 13; 8) – the smoothed 13-period moving average displaced on 8 bars forward; the author’s name − AlligatorsJaw, color by default – blue.
- SMMA (MedianPrice; 8; 5) – the similar moving average displaced on 5 bars forward; AlligatorsTeeth, color – red.
- SMMA (MedianPrice; 5; 3) – the moving average displaced on 3 bars forward; AlligatorsLips, color – green.
Each of them is considered the line of balance (the «fair» price) for the time period provided that the price isn’t influenced by other strong factors, as a rule – fundamental.
Parameters and control
The classical version of the Alligator is included in a set of all trading platforms, settings for creation of moving averages and colour scale which is recommended be not to changed are configured.
Standard version of the Alligator indicator
The periods, type of moving averages and parameters of shift correspond to Fibonacci’s number due to that steadily compensate the effect of mutual delay. For this reason, the Alligator doesn’t allow multiple treatments in any market, and parameters of lines change very seldom.
Parameters and settings
Let’s look at it in detail:
Alligator is a classical example of trade signals on a breakthrough or a turn from borders of range and power levels.
The following states are possible:
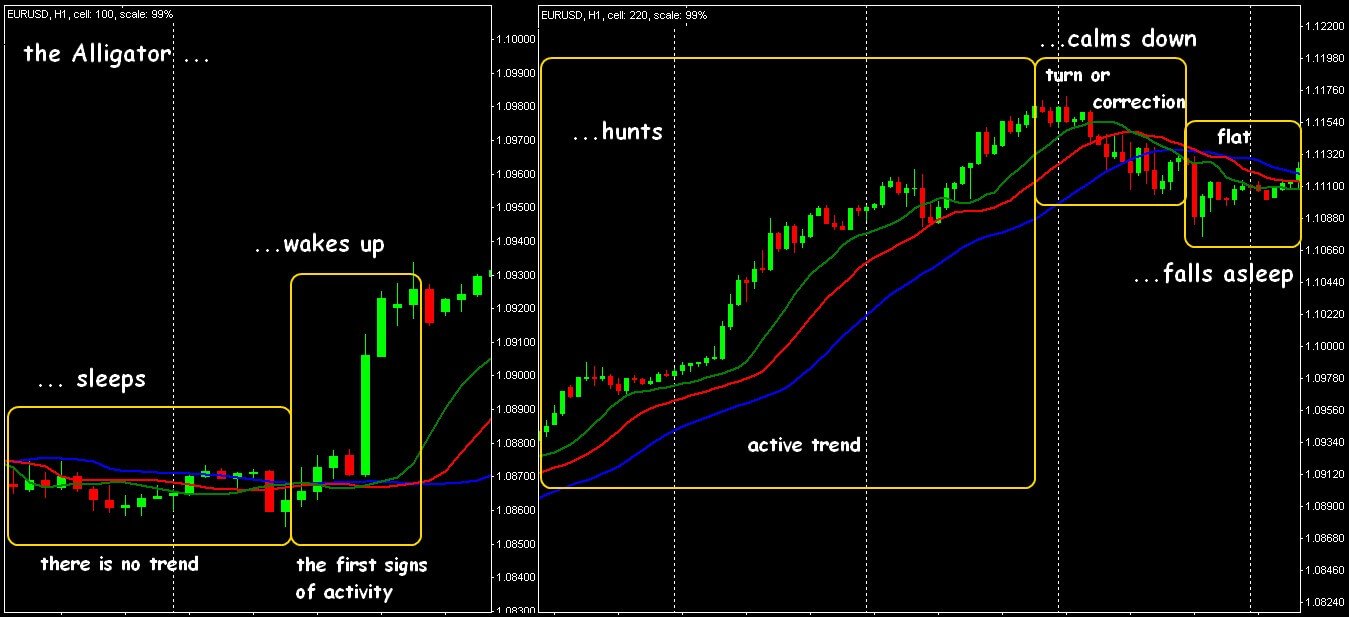
«The Alligator sleeps»
All lines move horizontally, are closely bound among themselves and the price fluctuates in the narrow range around red.
There are no trade signals.
The longer the flat period, the more «hungry» will wake up the Alligator: the price throw will be stronger and a new trend will be longer.
«The Alligator yawns»
The fastest AlligatorsLips (green) reacts ahead to activity of the market – in the direction of a price impulse.
Crossing it by the price is considered the advancing signal, but you shouldn’t open the transaction.
Gradually lines are developed in a necessary order, the distance between them increases (the period of «hunting» opens).
Type of the Alligator indicator during the different periods of the market
«The Alligator opens a mouth»
If the interest of the participants of the market doesn’t weaken, then red AlligatorsTeeth begins to react after green, and the slow blue AlligatorsJaw line always develops the last.
«The Alligator falls asleep»
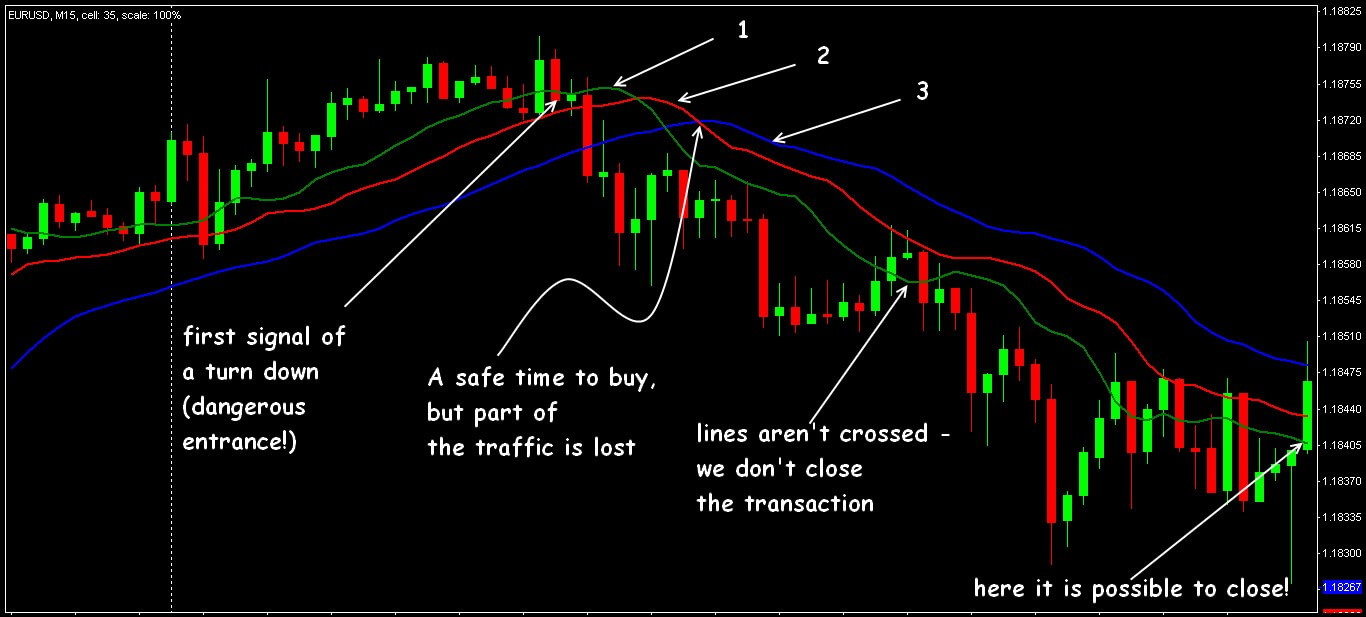
The return intersection of lines (The Alligator loses interest in «food») before a turn or consolidation is considered the moment of the closing of positions.
For a turn, the lines have to be crossed consistently in a strict order: green-red-blue, their relative positioning remains in the period of a trend.
On a turn or transition in flat there is the reverse crossing of lines, but it is obligatory – according to the same scheme.
The result?
The moment of crossing by the price of all three lines will be a strong signal for an entrance to the market; the transaction on kickback from AlligatorsTeeth looks riskier.
Scheme of formation of trade signals
For purchase:
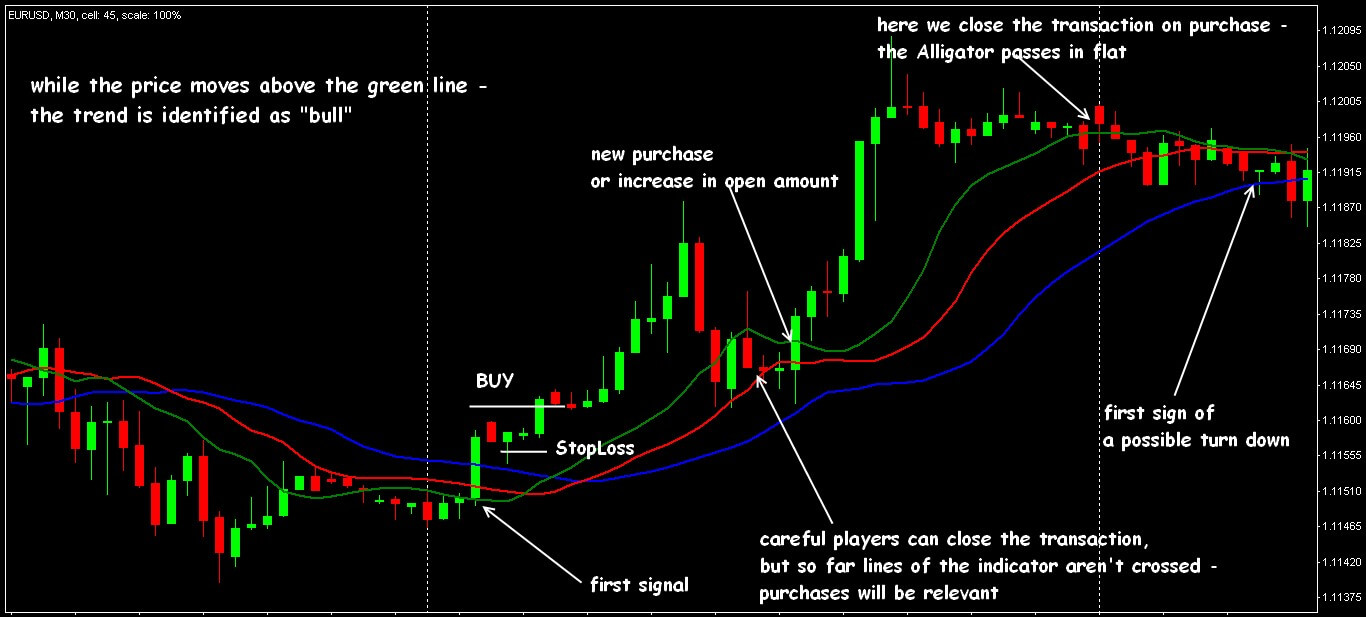
the price punches the key line from below up and is closed above a point of intersection.
Lines have to be directed to the north and be built accurately in order AlligatorsLips < AlligatorsTeeth < AlligatorsJaw (from below up).
While the price moves higher than green line the trend is bull.
The strong signal for purchase
For sale:
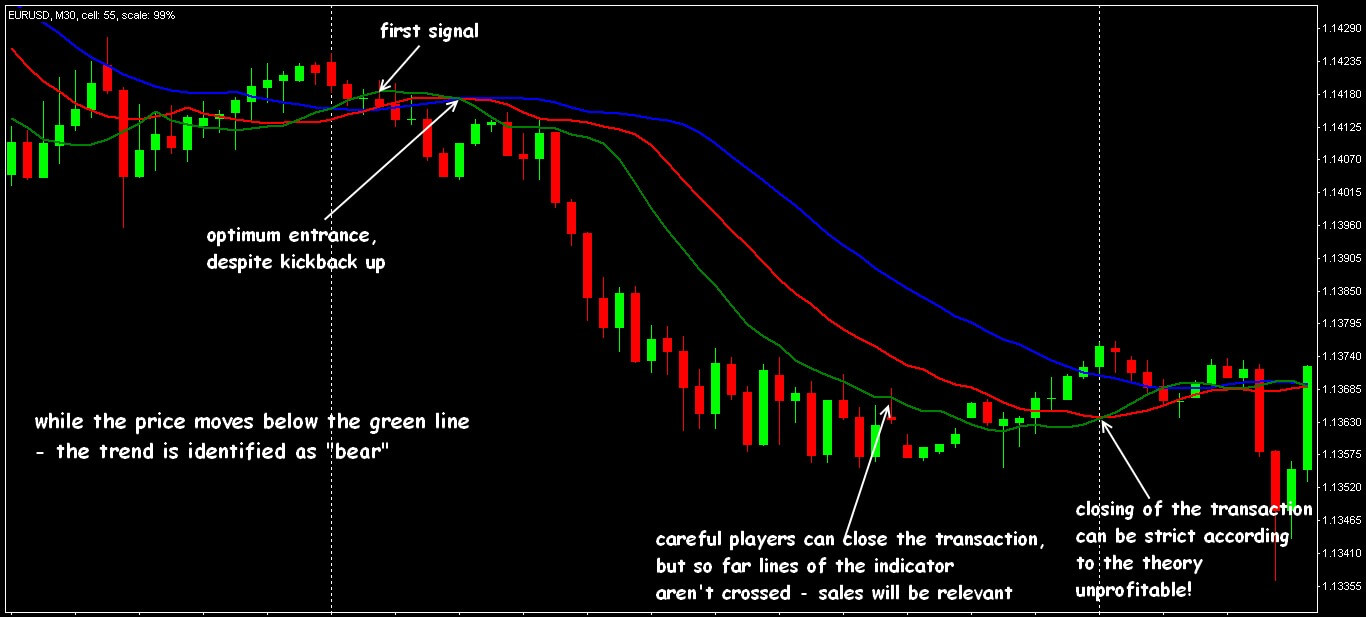
the price punches the key line from top to down and is closed below a point of intersection.
Lines have to look to the south and be built in order AlligatorsJaw < AlligatorsTeeth < AlligatorsLips (from top to down).
While the price moves under the green line the trend is descending.
The strong signal for sale
The range of volatility is defined by distance from green to the blue line, and the tilt angle allows to estimate force of a new trend.
Application in trade strategy
We will note at once: in case of trade on the Alligator we put Stop Loss obligatory!
What of lines of the indicator will be chosen as key for opening a position, and where Stop Loss will be placed, depends on risk level, comfortable for the trader.
What this means is:
- green: allows to take a profit maximum, but at very high risk (an aggressive scalping);
- red: will provide an average profit at average risk (moderate trade);
- blue: demands long transactions with big current sag, but will allow taking away all trend almost without loss.
Scheme of restriction of losses
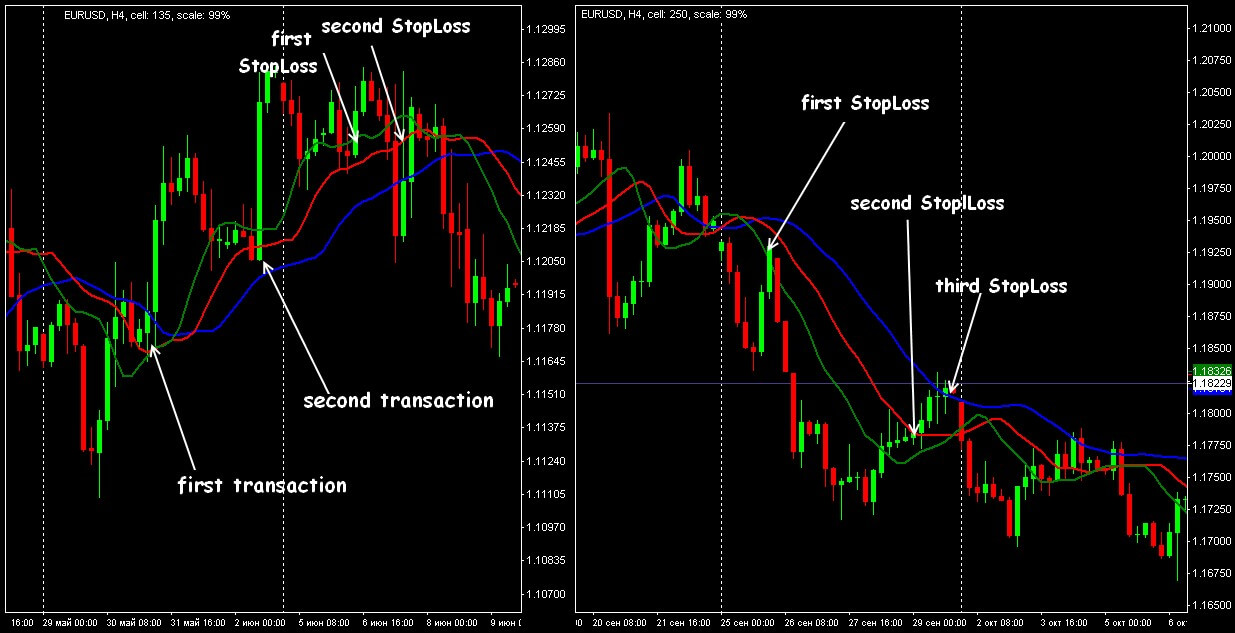
If to put Stop Loss behind the AlligatorsJaw line, then the position becomes steady against casual fluctuations, but the risk increases as at the time of crossing the transaction can already be in a critical loss.
The Stop Loss installation on the fastest AlligatorsLips will cause the closing of a position at small kickbacks against a trend that doesn’t give stable profit.
Will be logical to split position volume into 3 parts, that is, for the 1st part of the transaction we put Stop Loss behind the AlligatorsJaw line, for the 2nd – behind AlligatorsTeeth, we close the rest of volume in case of breakthrough of AlligatorsLips.
The dynamic trailing on lines allows to catch a short-term impulse, but to leave in time in case of its end.
Example of strategy on standard indicators
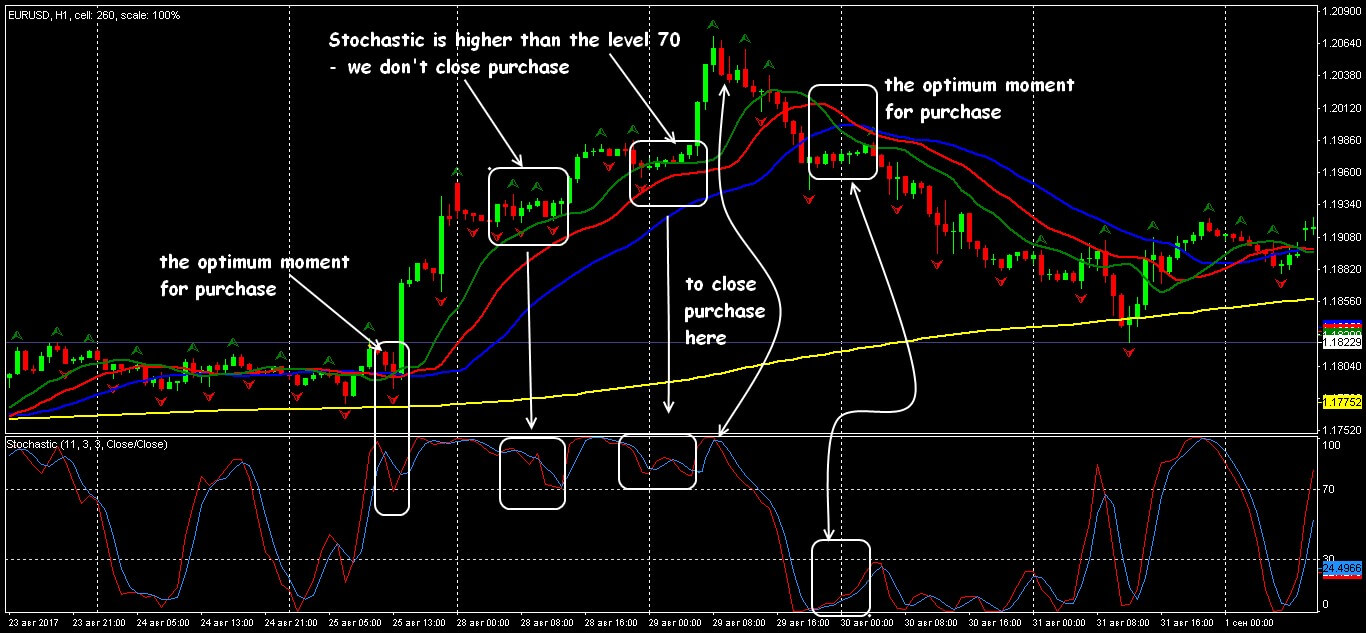
Alligator, Fractal, SMA(233) and Stochastic Oscillator (11,3,3) create a very steady set.
The Stochastic parameters can be changed for assets with high volatility.
We remain out of the market until the emergence of the first fractal higher (below) of all three lines of the Alligator − it means that the price has punched borders of range and has already executed technical kickback.
If the fractal appears in a zone of an intersection of lines of the Alligator – we ignore a signal.
The indicator Alligator in complex system
When the price crosses fractal level the second time after kickback – we put the postponed BuyStop/SellStop order on 2-3 points higher/lower.
Further, it is possible to use each following fractal on a trend for an additional entrance.
So far there are fractals up – only purchases, fractals down – only sales.
SMA(233) is used for the visual definition of a long-term trend: while the price is higher than the line – ascending, lower the line – bear, the line horizontal – there is no trend.
When performing the main condition on fractals we use Stochastic as the filter of false signals: if its lines confirm the movement down (a turn higher than level 70/80) − for sale, or up (the turn is higher than level 20/30) − for purchase.
Several practical remarks
Alligator is successfully used in any trade systems as the trend tool.
Techniques of an entrance and risk can be combined: to enter on the fastest line, and to lock in profits – on slower.
It is possible to close transactions manually on obvious signals from additional indicators (MACD, AO, Stochastic, Awesome).
The Alligator indicator can help with the identification of a marking of Elliott`s waves: if the price is behind borders of «AlligatorsJaw», then the market forms a pulse wave and if within the zone – correcting.
A shortcoming of the Alligator is the calculation mechanism on the system of moving averages: signals of the beginning of a trend, as a rule, are late.
In case of confirmation, for example, by the oscillator, the technique is effective on the time frames from M15 to D1 and allows taking up to 60% of the price movement of any trend.
 Backtest on Forex Tester Online
 ไทย
ไทย
 Tiếng Việt
 Polski
 Türkçe
 Nederlands
 Română
 한국어
한국어
 Svenska
