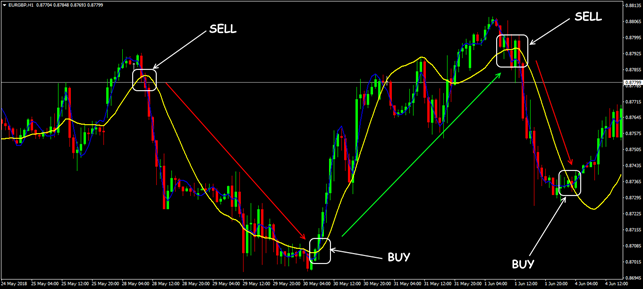
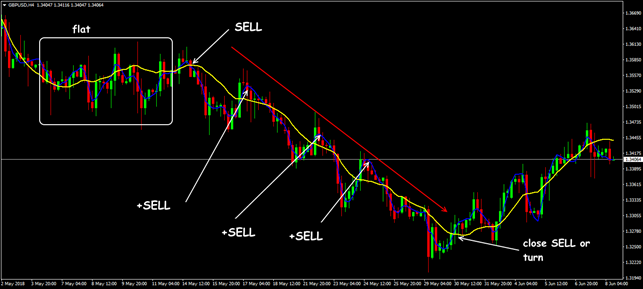
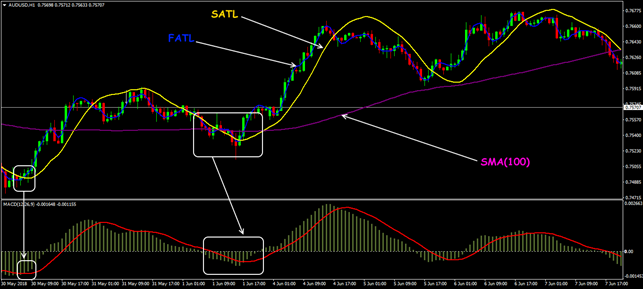
The method of spectral analysis of markets is a system for analysis and forecast of the market prices dynamics based on modern mathematical technologies, it is a structure of technical indicators created using digital filters.
In fact, the authors of the AT&CF system expected only to draw programmers’ and technical analysts’ attention to the huge array of data that are constantly given by financial market, and tried to apply adaptive methods to its analysis.
The result is now available to any trader. It only remains to check how much it is profitable in real trading. So let’s begin.
FATL indicator: Logic and purpose
All technical tools of price analysis use past values or «price history» for calculations. Delay is typical for any dynamic process, but in the financial market this problem brings too much real negativity. Developers of technical analysis tools have been at war with it for several decades, but the results are far from ideal.
The authors of the system did not set themselves any special tasks, but as a result, the market itself prompted the main goal of market’s spectral analysis − to ensure a minimum delay in calculation result, regardless of the digital data category, required level of accuracy and calculation period. It turned out a kind of independent market expert who issues «clean» information without specific recommendations.
Of course, the moment of price change, calculated with this method, never coincides with the real one, but the moment of the current trend end can be determined unequivocally.
There is no phase delay at all, but no fundamental factors are taken into account. Further, there will be a little bit of math, but still we recommend that you read it carefully.
To check this (or any other) strategy’s performance you can:
Check how to use FTO simulator in our step-by-step guide or watch this video:
FATL indicator: Calculation procedure
In the AT&CF system, it is proposed to consider the dynamics of exchange prices as a kind of non-analytic function, behavior of which is described by Fourier’s theory of time series.
It is assumed that exactly this function reflects the real price chart the most accurately − it can be smooth, broken, continuous, and with breaks.
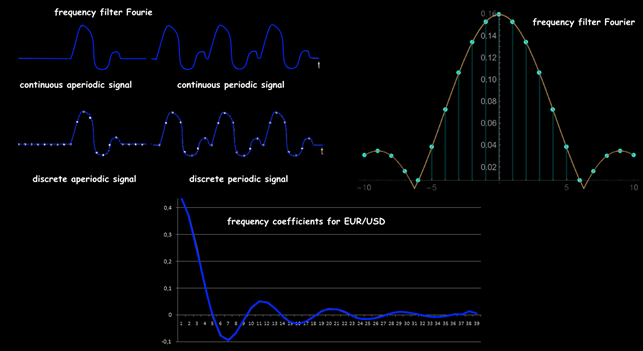
It is according to Fourier theory that any «illogical» («market trend») dynamics on a finite interval («market timeframe») can be represented by an infinite sum of sinusoidal functions, which are called frequency spectra.
FATL: approximation of price dynamics
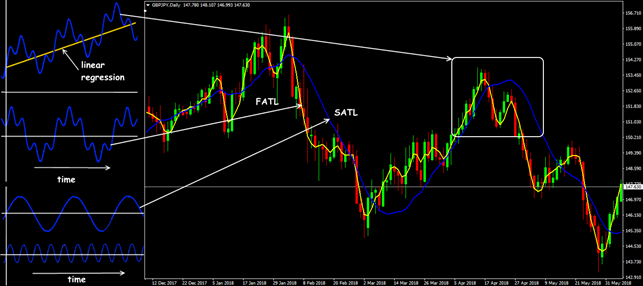
Adaptive indicators break the flow of price data into some areas and simulate price dynamics using sinusoids with different cycle parameters with a sufficient degree of approximation.
Fourier transformation: basic elements
In this case, the spectrum of market price (according to Fourier theory) is divided into several spectral ranges:
- long-term trends (more than 60 trading days), or, according to Fourier, low-frequency range of frequencies from 0 to 4;
- medium-term and short-term segments of the global trend (10-60 trading days), the frequency range from 5 to 40;
- market noise (less than 5 trading days), which fills most of the spectrum (timeframe) with its high-frequency oscillations, the frequency range is from 41 to 130.
What is the result?
According to the classical theory, the full Fourier spectrum is 130 periods, 24 trading weeks are taken into account for the currency market (at least!) or 120 periods.
Then the trading interest is concentrated in the mid-frequency band − period of 16 trading days, 16 cycles per year and peak of the sine curve with a cycle of 32 8-day period. Everything else is considered a market noise.
FATL indicator: Parameters and control
The original AT&CF is offered in the form of an integrated automatic trading system and is available in conventional trading platforms.
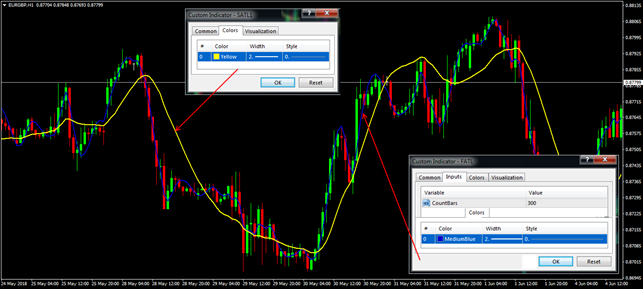
All of them are suitable for manual trading, only the number of bars for calculating (and sometimes even not!) and color schemes are usually available from the settings. For more fine-tuning, curious people can dig into the code.
Standard version of the indicator FATL
The FATL (Fast Adaptive Trend Line) indicator is an estimate of the short-term trend line. The parameters of the digital low-pass filter are selected based on the current spectrum of a specific market. Unlike the traditional moving average, FATL has no lag relative to the current closing price and is its mathematical expectation.
Please note: the FATL indicator as a trend element of the system is used only in the complete set with the indicator SATL.
SATL (Slow Adaptive Trend Line): analogous to the classic long moving average, for which a second-order digital low-pass filter is used. The SATL value is the mathematical expectation of a FATL value with the same period.
Let’s look at it in detail.
Trade signals of the FATL indicator
All author’s signal schemes involve the use of a full set of AT&CF indicators. Trend elements or oscillators are not considered separately.
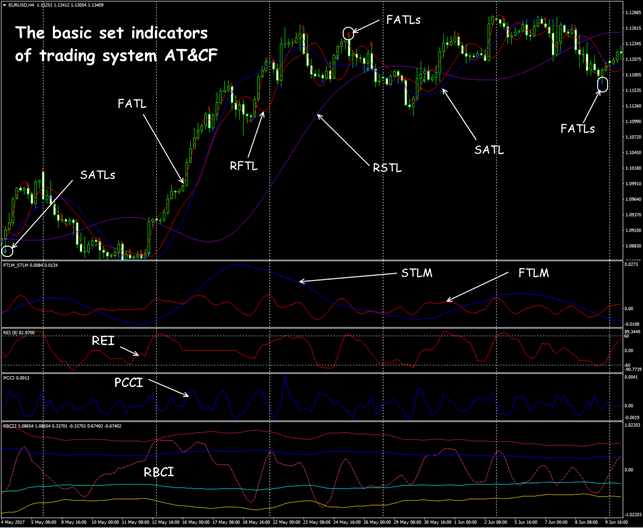
All AT&CF indicators
If you analyze only the trend elements of the system, then you can use the usual trading logic.
The direction of general trend is determined by the SATL line:
- growing SATL line indicates an uptrend, local min SATL is considered the reversal of bearish trend;
- falling SATL line means a downtrend, local max SATL is considered the reversal of bull trend;
- horizontal SATL line is a neutral trend.
Classical signals of FATL indicator
The main trading combinations of FATL+SATL (we draw attention to various options for interpretation):
- both lines are growing − the market has a strong uptrend;
- both lines are falling − a strong bearish trend;
- FATL line goes up, SATL line falls − either a strong downtrend correction or consolidation;
- FATL line goes down, SATL line is growing − either a strong bearish correction or consolidation;
- beginning or resumption of traffic in one direction of FATL and SATL lines indicates either a strong trend reversal or the completion of correction and return to the main SATL direction.
FATL: scheme of trading signals
We recommend that you forget about timeframes less than H1 on the indicator FATL indicator, otherwise we get a lot of «false» signals. For currency cross-pairs, it is recommended to start the analysis from the H4 period and higher. It is assumed that all the fundamental factors have already been taken into account in current calculation of the values of the FATL indicator.
We remind: the main hype on AT&CF has already passed. What this means is the results of full-fledged tests, which can be freely found on the network, date back to 2005-2007, but modern markets have become more speculative, the influence of foundation and news cannot be ignored.
If you want to use individual elements of system, we recommend that you test yourself.
Use in trade strategies
The FATL indicator is used in large players’ trading technologies, and at least a medium-term forecast is important for them.
Indeed, AT&CF system absolutely does not care what kind of asset to trade, it perceives everything as a digital array, adapts optimally to the current market, is never late, does not depend on the broker and trading conditions.
AT&CF does not give any recommendations on money management, it’s just a set of technical tools. Therefore, let us recall once again: we consider only conservative intermediate-term trade with a low level of risk.
Among author’s trading schemes, strong reversal signals (S7 and L7) are considered absolutely trendy.
Entry against the current bull trend (sale):
- strong downward breakdown of SATL line by FATL line.
- sell at the maximum of FATL indicator after the first downward trend adjustment upwards.
The deal is opened at the opening price or higher.
Entry against the current downtrend (purchase):
- strong breakdown of the SATL line by FATL from the bottom up;
- we buy at the minimum of the FATL indicator after the adjustment of the upward trend downward.
The deal is opened at the opening price or lower.
FATL: Moving Average as basic trend
From personal experience: no matter how others convince you not to use adaptive indicators together with classical ones − do not believe it. It is the symbiosis of such methods that gives fairly stable results.
FATL indicator: Several practical remarks
At first glance, both the AT&CF system and FATL as a separate indicator look very logical and «beautiful» in terms of mathematics.
Perhaps serious analysis and modeling of market processes (and the economy as a whole) for periods on 1-year scale are performed precisely by such methods, but they have no practical sense for a small investor and an ordinary trader. We are not thinking that globally, and such «signals» are useless or even misleading on the timeframes everyone is accustomed to.
The only information about this method is contained in its author’s articles and a small amount of discussion on the network, especially since there are no complete versions of the system in free access, and few will risk buying such a «wrap-up».
The tests of filter generator conducted by author showed that even with carefully selected, adequate parameters on popular currency assets, the difference with standard indicators is minimal.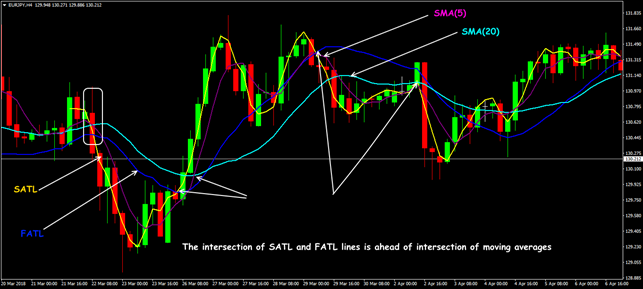
FATL or MA: turning points
Still, the market price is not similar to radio waves with a constant amplitude, the behavior of the market has the nature too dependent on the fundamental factors.
If you constantly select and test the filter parameters for different conditions and trading assets, then there is no time to trade.
The FATL indicator can now be of interest only to fans of exotic analysis methods. For ordinary traders, it is recommended to wait until the spectral analysis for Forex acquires a more convenient practical form. And for a reasonable price, as desired.
 Backtest FATL on Forex Tester Online
 ไทย
ไทย
 Tiếng Việt
 Polski
 Türkçe
 Nederlands
 Română
 한국어
한국어
 Svenska
