Summarize at:
The first who expressed the idea of harmonic patterns were the stock theorists Larry Pesavento, Harold M. Gartley, and Scott M. Kearney, moreover, the leader of these three was Larry.
Nevertheless, Gartly’s book “Profits In The Stock Market” (1935) with a detailed description of the general models revolutionized the technical analysis and the first limited edition copies were sold at a higher price than a car.
Both classical and modified Pesavento patterns are based on the Fibonacci correction levels, and therefore they forecast the key market points at any asset and timeframe with high precision and are perfectly scaled in the process.
Now anyone can use these trading methods absolutely for free, and the majority of technical indicators will automatically find and build the patterns on the price chart, so let’s begin.
Specifications of harmonious patterns
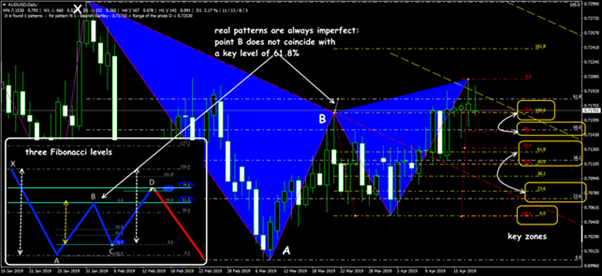
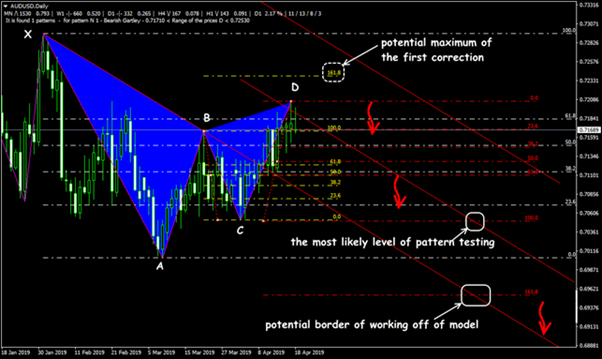
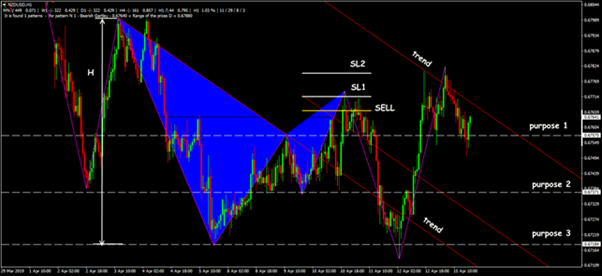
Harmonic models are built on the standard Fibo levels in the strict order. For visibility, let’s look at the Gartley butterfly pattern — a reversal of the upward trend is expected.
Main price movement — the [X-A] section (sometimes [0-A]), basic Fibo net is built on it. From point A the market must give the first adjustment wave upwards, which must end in the level 61,8% zone (point B).
Next:
- an attempt to turn downwards forms a section [B-C], but doesn’t update the local minimum (point A);
- point C must not stay below the 61,8%-78,6% level from the movement [A-B] (otherwise the adjustment is considered “deep” and the pattern may be canceled!);
- point D is in the zone of 78,6% and higher from the movement [X-A] (optimal — at the level of 161,8%-127,2%), the potential turning and market entry for sale point.
We remind:
If the adjustment for [A-B] movement is less than 61,8%, then there is a high probability of continuing the current trend and entry at the market in point D is canceled.
The formation time of separate pattern areas must be roughly equal; it is undesirable for any of them to be formed at speculations (1-2 bars).
The emergence of harmonic patterns is accompanied by divergence on one of the oscillators (MACD, Stochastic, RSI), then the probability for the reverse at point D increases.
The classic model requires the fulfillment of the key condition [C-D]=[A=B], other parameters allow variations.
The adjustment of [A-B] may reach the level 50%, and the movement of [C-D] — to get stuck at 61,8%, but the equality of these sections must be followed (with a deviation no higher than 5%) with any configuration of the butterfly.
The main problem of harmonic patterns is that ideal compliance of parameters at the real market is met very rarely. Usage of additional compliances between the Fibo levels allows using non-standard harmonic patterns.
Let’s look at it in detail.
Basic harmonic patterns
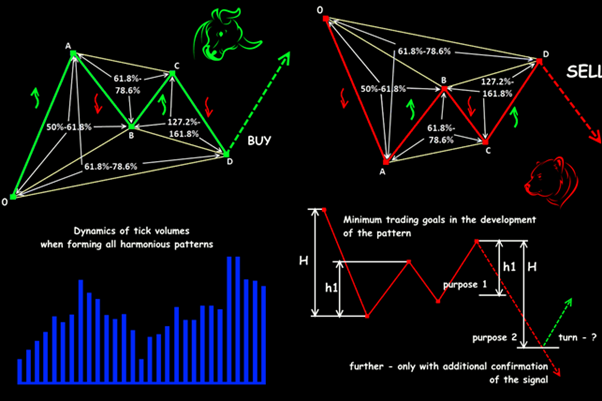
We remind that tick volumes act in the same way in all models (regardless of direction):
- the tick volume grows in the first impulse area, falls to the middle level at the first adjustment;
- second area: middle-tempo growth, at the second adjustment — active growth with weak volatility;
- after point D formation — sharply grows.
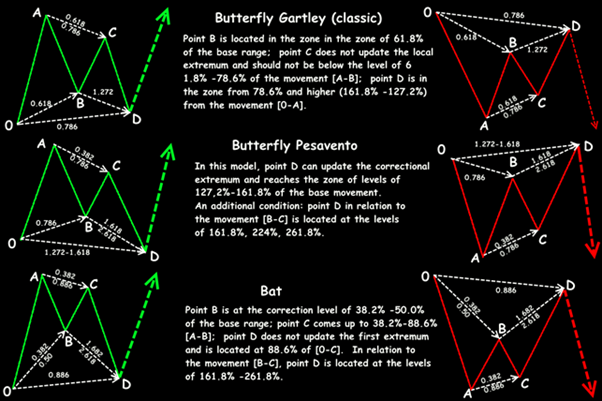
Today over 20 models are considered harmonic, though most of them are modifications of the most stable ones, which are shown below. The main differences lay only in correlations between the position of the key points.
Pesavento Pattern
With entering the market by the classic Gartley model (see above), Stop Loss can be placed behind the extremum of the main movement.
If the Pesavento option is used, then we set Stop Loss behind the next Fibo level or on the chosen money management system. It is recommended to enter the market with a pending order.
Pattern ‘Bat’
At the entry, Stop Loss is set above/below point 0 with some margin. One may enter both with pending order and by the market price — it doesn’t really affect the result.
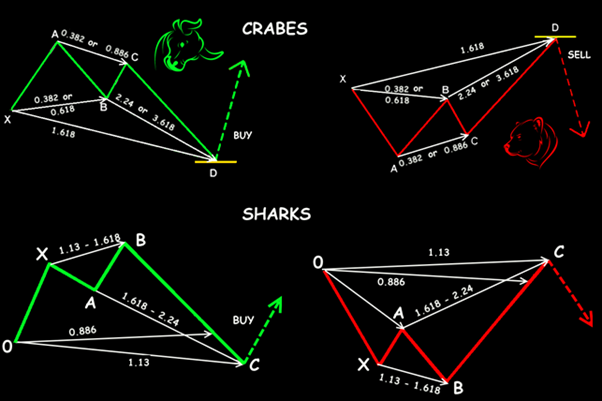
Pattern ‘Crab’
Main features:
- range [C-D] is 2-3 times bigger than [A-B];
- point B is no lower than 61,8% away from [0-A];
- point C, regarding section [A-B], is not higher than the adjustment of 88,6%;
- point D goes far above/below point 0 and is located at a level of 161,8% from the whole movement [0-C];
- point D is at the distance of 224%-361,8% relating to section [A-B].
When working with such a model, a fixed Stop Loss is used, which is defined by the money management system and depends on the timeframe.
Pattern ‘Shark’
Basically, Gartley has no relation to this model — it was tested and justified only in 2011.
This is an option of the ‘5-0’ pattern, but the entry is made in point 4 and gives a chance to take a profit already in the moment of forming section [4-5] and to turn over after its forming. The Take Profit level is suggested in about the middle of range [3-4].
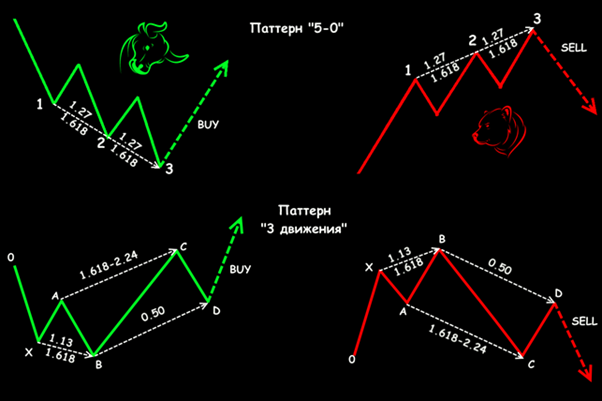
Pattern ‘5-0’
The model is hard for trading because of strict requirements for the mutual placement of separate elements. It is rarely diagnosed in the real market, but it is considered more reliable than standard patterns.
Main parameters:
- point 2 doesn’t update the first extremum (point 0);
- point 3 is located at levels 127,2%-161,8% from the movement of [1-2];
- point 4 updates the local extremum and is located in the area of levels 161,8%-224% from the range [2-3];
- point 5 (in the ideal model) must be located in about the middle between points 3 and 4.
The entry is at the market price or by a pending order; Stop Loss is on the next Fibo level; no strict rules for Take Profit.
Pattern ‘Tree movements’
The model is three sequential max/min (in the interpretation by Linda Raschke — the ‘Three Indians’ pattern). There is the trend reverse happening at the point or at least the beginning of a strong adjustment.
Main parameters:
- point 4 moves to the level of 61,8%-78,6% from the basic movement [0-1], with a small adjustment, for example, 38,2% the probability for the model processing decreases;
- points 2 and 3 are located at levels 127%-161,8% from the sections 1-4 and 2-5 respectively;
- it is desirable that points 1,3 and 5 are located on the same straight line — it enhances the trading signal.
Examples of implementing harmonic patterns
A human being is lazy by nature, that’s why calculations and graphic constructions of harmonic patterns have been automated long ago: various options for the ZUP indicator can be easily found on the web. It significantly facilitates the trader’s life.
What this means is ZUP will define and ‘draw’ a model, show the key points (entry, Take Profit/Stop Loss) and if the correlation between the pattern elements is failed, it gets removed from the current graph.
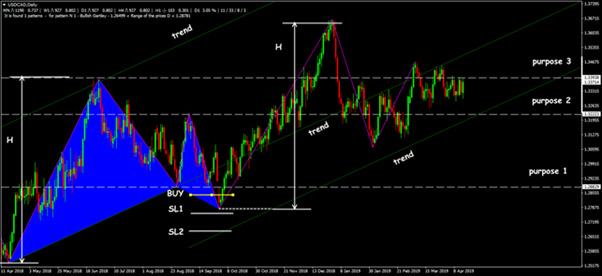
Harmonic patterns are formed on any timeframes, but constructions at D1 are considered the most stable.
The emergence of analogic patterns on multiple timeframes simultaneously significantly increases the probability of working the standard scenario.
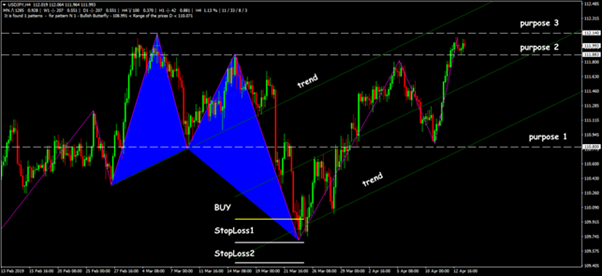
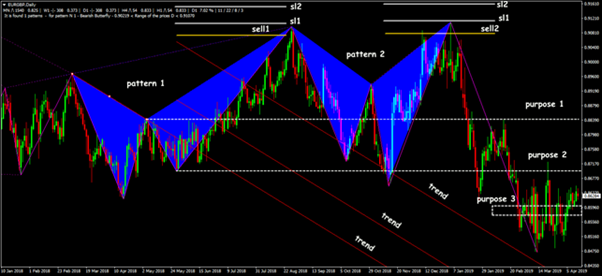
Pesavento Patterns (exp. 2)
Entering the market with a pending order is possible in the event that all the pattern form is close to ideal, otherwise one should wait till the final point is formed and enter at the market price.
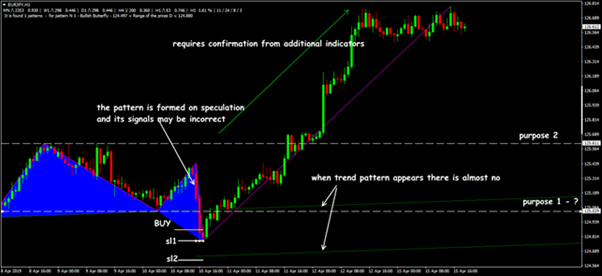
Even externally ‘correct’ Gartley’s Butterflies or Pesavento patterns are rather hard constructions, absolutely unbalanced in time, they don’t guarantee the real reverse.
That’s why Take Profit is better to be placed at 0,7-0,8 from the model height at the points or to pull up Stop Loss by tailing.
Patterns can be used as ready-made strategies, but it is still recommended to check their signals with additional indicators, candlestick combinations or additional graphic constructions.
Gartley’s Butterfly remains the most understandable and hence the most popular figure, but the effectiveness of all model options is very high: up to 85% of deals based on these signals are closed in a profit.
Trades who have mastered working with harmonic patterns, always have statistic advantages, if they can wisely control risks of course.
Try It Yourself
As you can see, backtesting is quite simple activity in case if you have the right backtesting tools.
To check this (or any other) graphical analysis you can get Forex Tester Online.
 Backtest on Forex Tester Online
 ไทย
ไทย
 Tiếng Việt
 Polski
 Türkçe
 Nederlands
 Română
 한국어
한국어
 Svenska
