Graphic tools: take your Forex learning to the next level easily [Video guide]
Forex Tester has a large variety of charting tools such as:
- Pointers (arrow pointer, crosshair pointer).
- Lines (Vertical line, Horizontal line, Trend line, Ray, Polyline).
- Shapes (Rectangle, Ellipse, Triangle).
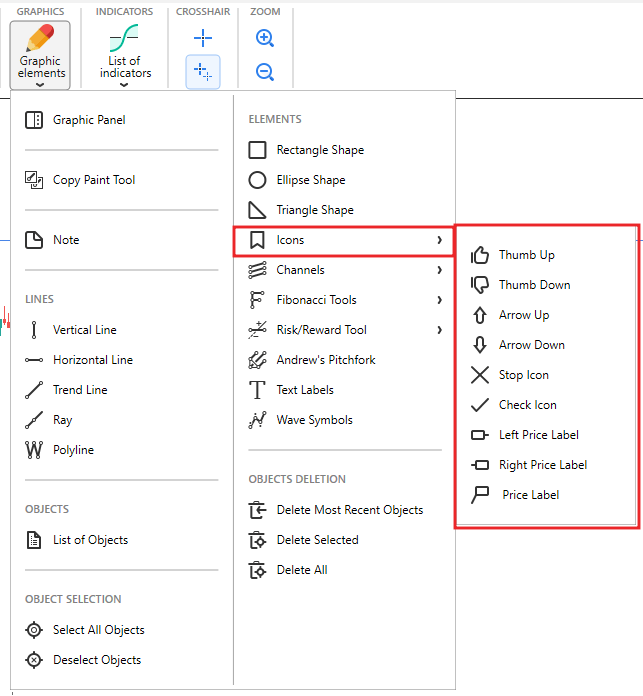
- Signs (Thumb up, Thumb down, Arrow up, Arrow down, Stop sign, Check sign, Right price label, Left price label, Price label).
- Fibonacci tools (Fibonacci retracement, Fibonacci time zones, Fibonacci fan, Fibonacci arc, Fibonacci extension).
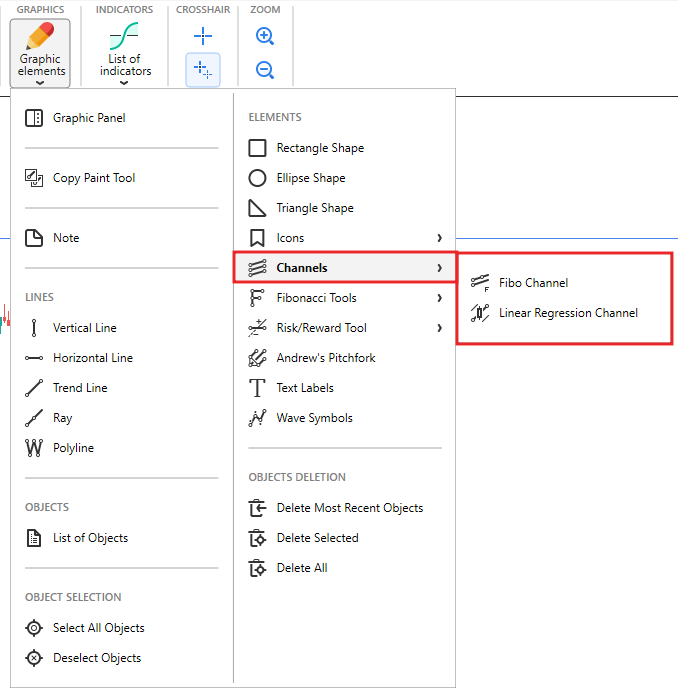
- Channels (Fibo channel, Linear regression channel).
- Andrews’ Pitchfork.
- Text label.
- Wave symbols.
- Risk/Reward tool.
You can find all of them by clicking the “Graphic elements” button.
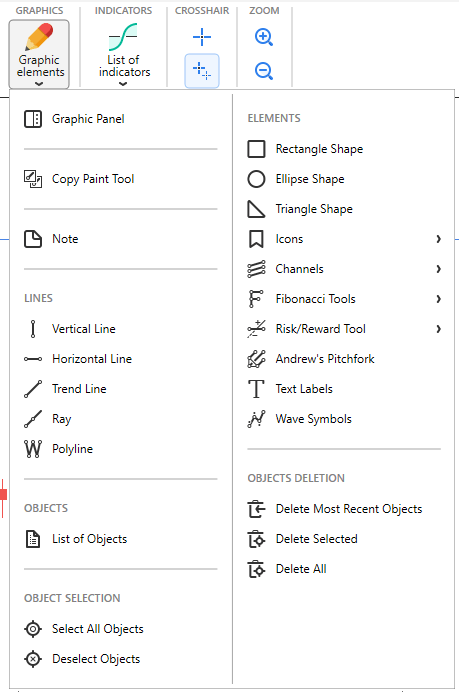
You can turn on the Graphic Panel to conveniently use all the graphical tools by clicking the  button.
 The Graphic Panel is floating and can be moved freely to any place on your screen. The panel can be displayed horizontally and vertically, as well as you can close it anytime by clicking the “X” button.
Let’s take a look at the buttons on the panel.
 — enables a “crosshair” mode.
The crosshair lines are movable lines that can be used to specify and measure positions on the chart.
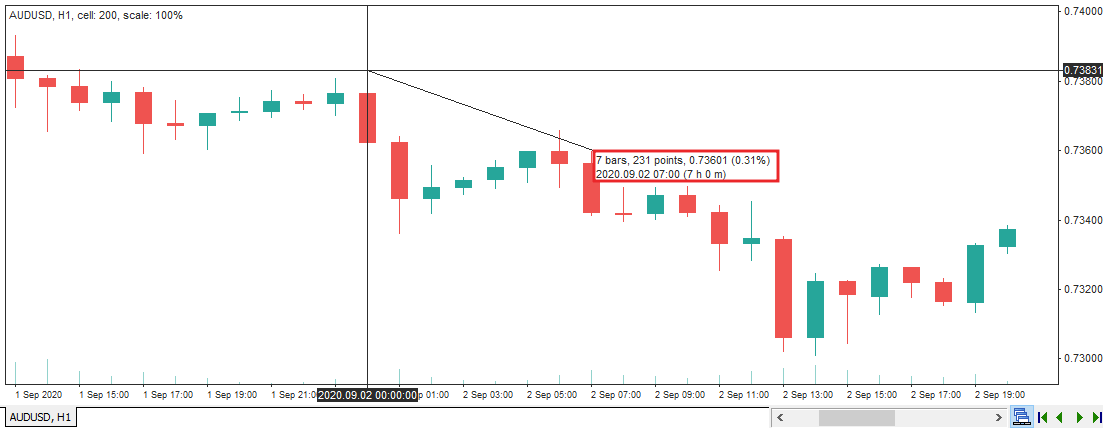
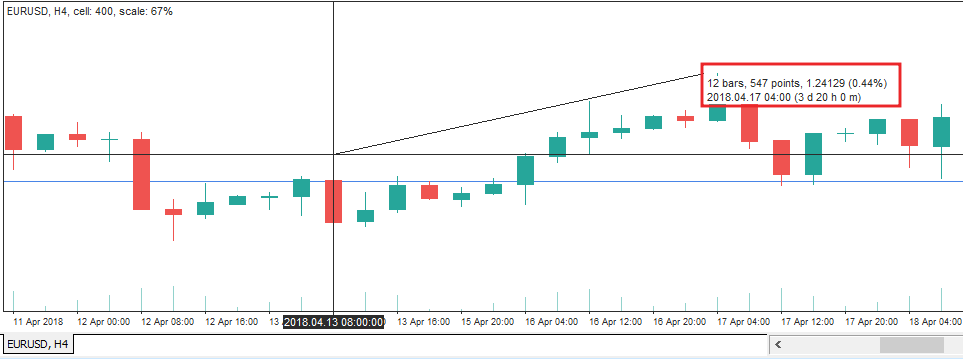
If you hold down the left mouse button in the crosshair cursor mode and drag it to any of the sides, you can get the following information:
- The number of bars between the start and end points of the crosshair.
- Price change in pips and percentage.
- The interval between the start and end points of the cross in days/hours /minutes.
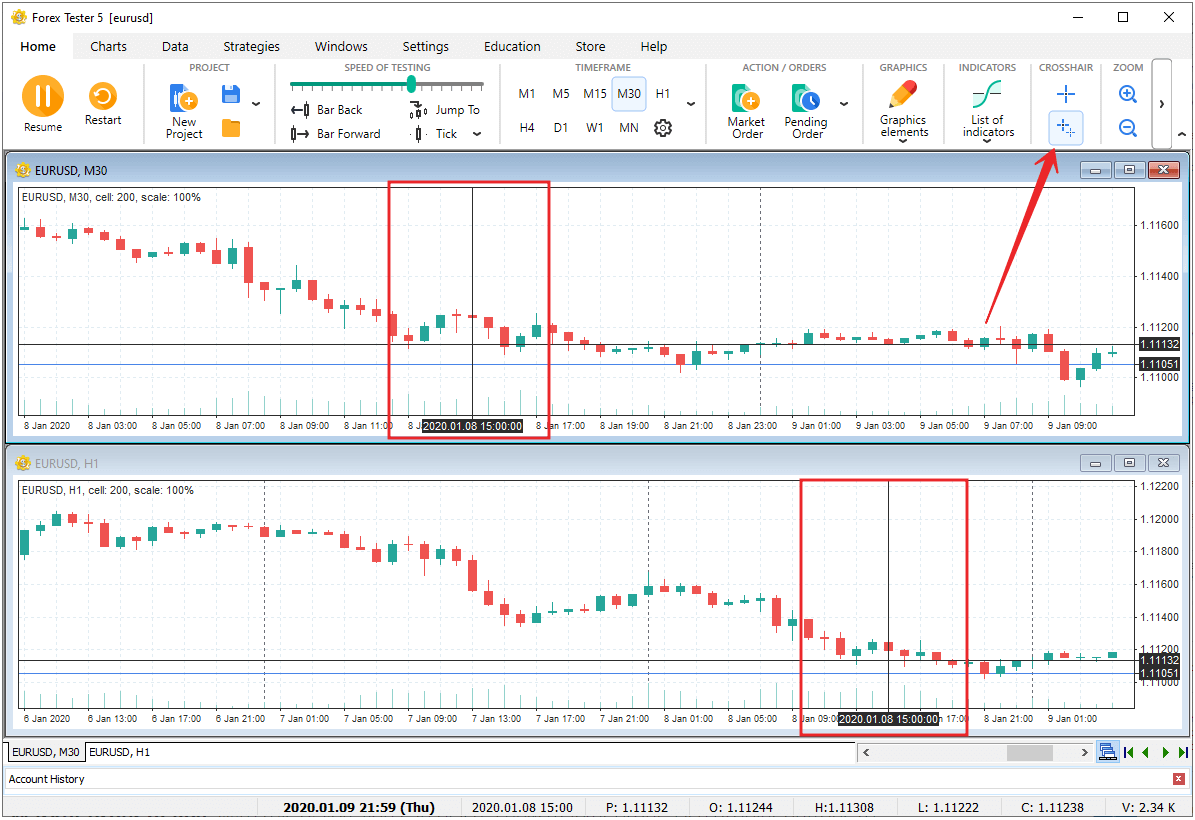
 — enables synchronizing crosshair on all charts
The crosshair mouse pointer is represented on all charts with all timeframe differences kept.
The line drawing is easy:
- Select the necessary tool and left-click once to set the first point (in the Vertical and Horizontal lines, it will be only 1 point).
- Drag your mouse and left-click to set the second point.
- If you decide to cancel the drawing, right-click to cancel the operation.
Some tools like Polyline or Andrews’ Pitchfork require more than 2 points to place.
In the Channels group, you will find the Fibonacci Channel tool and the Linear Regression Channel.
Select the necessary tool to add it to the chart and choose the start point. Then, move the mouse to the second point and left-click to finish drawing the tool.
You can add different signs to the chart by clicking the “Icons” button.
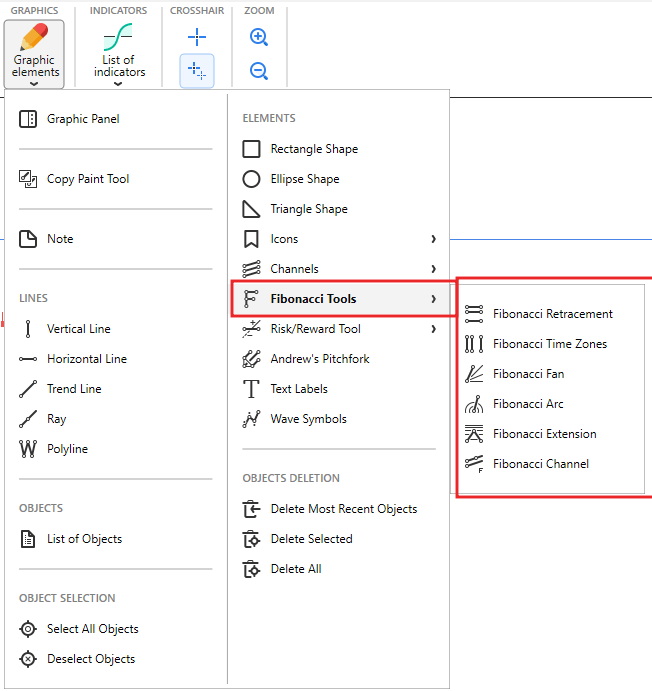
The Fibonacci tools group consists of 5 instruments for chart analysis:
- Fibonacci Retracement.
- Fibonacci Time Zones.
- Fibonacci Arc.
- Fibonacci Fan.
- Fibonacci Extension.
The construction of objects with these tools has common principles:
- Select the tool from the Graphic Elements → Fibonacci tools menu.
- Move the mouse to the first point and left-click.
- Move the mouse to the second point and left-click to finish drawing the tool.
Forex Tester has the Andrews’ Pitchfork tool among its instruments. You can add Andrews’ Pitchfork to a chart by clicking the  button in the Graphic elements menu.
Place three basic points of the tool by left-clicking (like drawing the triangle). If the Magnet mode is enabled, the triangle’s end points will snap to the bars’ control points.
Left-click on the chart to place a Text label. You will see the Text settings window:
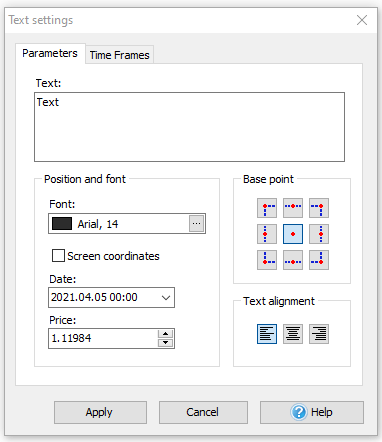
Here you can write any text, which will be shown on the chart (in the Text: field), and also change the format of text (font type and size, color of the text, base point, and text alignment). Click the “Apply” button to finish the text adding.
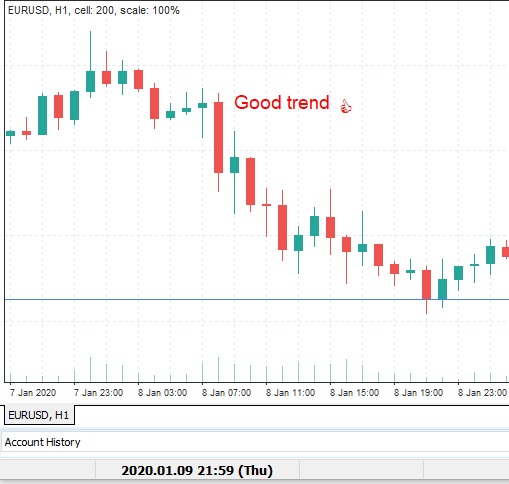
To change the Text Label properties, right-click on the text and select the Edit Text option.
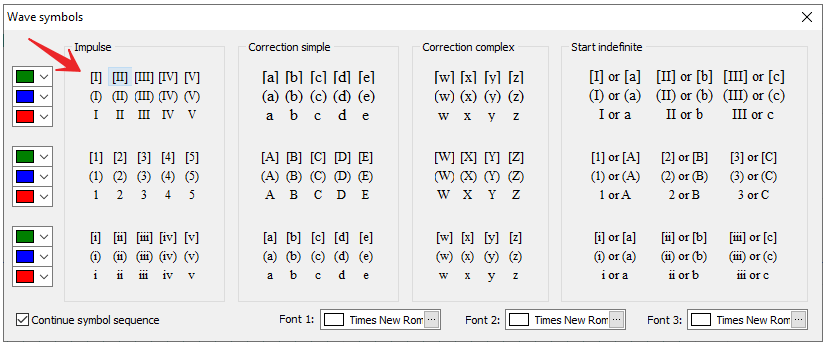
For example, if you select the first symbol in a table and then left-click on a chart, the [I] symbol will be placed. If you left-click one more time, the [II] symbol will be placed on the chart. And so on.
Each tool has its properties. To edit them, right-click the tool and select “Edit tool”. You can also duplicate this tool or delete it using this menu.
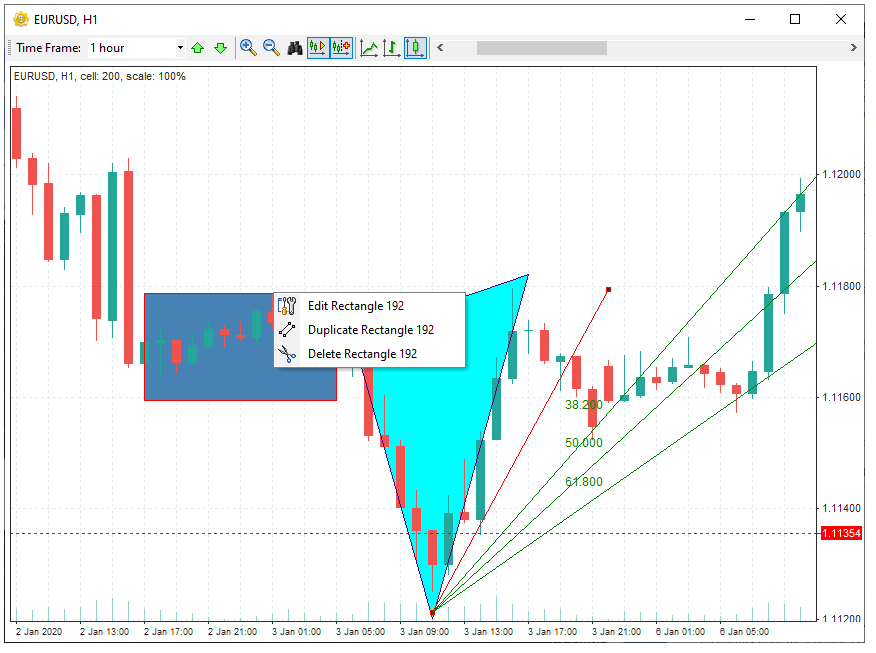
To select the tool, double-left-click it. You will see white points which you can move to change the shape and position of the tool. If you press the Delete key, all selected tools in this chart window will be deleted. To deselect the tool, double-left-click it one more time.
There are some hotkeys that will help you to manage graphic tools:
Ctrl + G - to select all the tools on the chart.
Ctrl + D - to deselect all the tools on the chart.
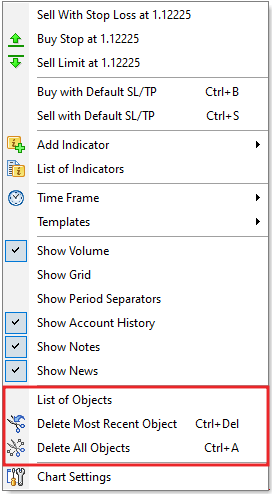
Ctrl + Del - to delete the last added tool.
Ctrl + A - to delete all the tools on the chart (selected or not).
Delete - to delete only selected tools on the chart.
Note that all the hotkeys can be changed via the “Hot Keys” button on the Settings tab.
You can see these shortcuts through the right-click popup menu or Graphic elements menu.
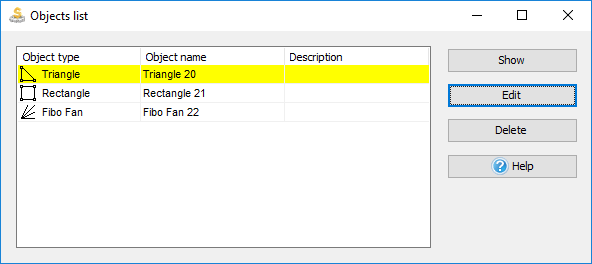
You can also view all tools currently added to a selected chart and change or delete any of them using the “List of objects” button.
The Objects list dialog window looks like this:
To synchronize graphical tools on all charts and timeframes of one currency pair, use the Paint toolbar’s button  .
.
When this mode is active, all new graphical objects created on one of the charts will appear on all other charts with the same currency pair.
For example, you can add a trend line to one chart, and then it will appear on all of your charts.
Similarly, graphical tools created on different charts (with the same currency pair) are connected. If you delete one, other tools related to it will also be removed from the rest of the charts.
The Risk/Reward tool
The Risk/Reward tool shows the difference between the potential loss and the potential profit of your Buy or Sell trade, depending on initial preferences.
You can find the tool in the Graphic Elements menu (as well as in the Graphic Panel).
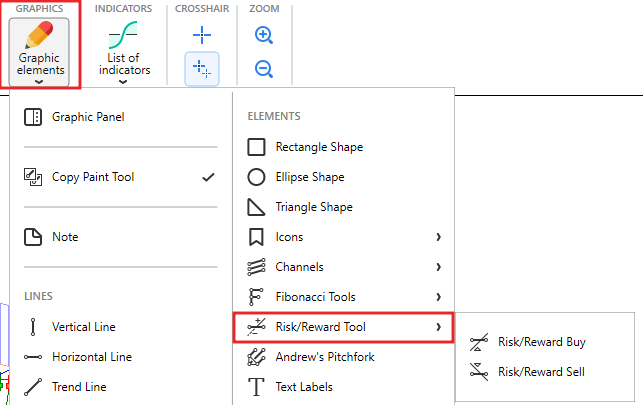
To begin drawing the tool, you need to select the trade type you want to see Risk/Reward for and choose between Risk/Reward Buy or Risk/Reward Sell.
After clicking the necessary Risk/Reward type, you will see the following window:
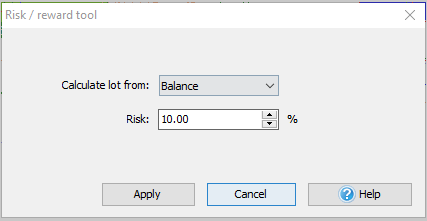
Lot (position size) can be calculated based on Balance (by default), Equity, or Custom value.
Define the risk amount and click “Apply”.
Select the place on the chart where the tool will be displayed.
The drawing tool will show you the following information about the further trade:
- Lot (position size).
- The Take profit level.
- The Stop Loss level.
- Risk/Reward ratio.
- Profit in USD and points.
- Loss in USD and points.
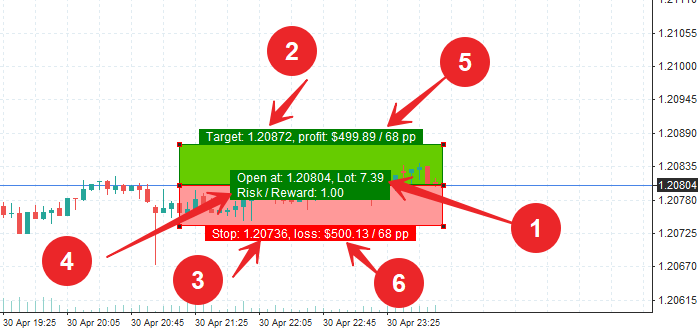
Please note that you can move, resize, change properties and SL/TP levels of the tool after applying to the chart anytime you need to. In this case, all the values will be recalculated automatically.
If you need to change the SL or TP level, drag up/down the corresponding rectangle’s outer corner.
To change some tool parameters, like name, style, the risk for lot calculation, right-click on the border or corner of the figure and select “Edit”.
You can also place the pending order using this tool: right-click on the figure’s border or corner and select “Place pending order” in the menu. The program automatically detects the type of pending order and places it at the level that corresponds to the price in the “Open at” field, as well as fills in the SL and TP values.
- About Us
- Risk disclosure
- Privacy Policy
- Contact us
- Forex Partnership Programs


