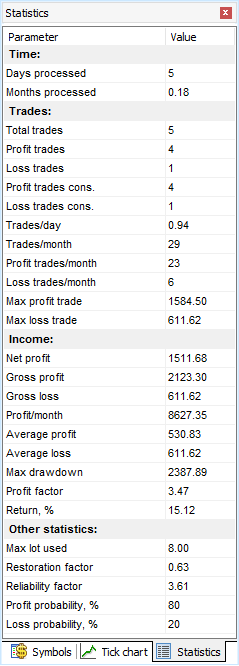
The statistics on the strategy’s performance are displayed during the test and after the testing is finished. The Statistics window shows the most important indicators such as:
- The number of total profit and loss trades.
- Maximum profit and loss trade.
- Net profit.
- Profit per month.
- Average profitable and losing trade.
- Maximum drawdown.
You can add the Profit chart for analysing your trade strategy by clicking the “Profit Chart” button on the Charts tab.
A profit chart is an individual chart that contains the specific candlestick chart and three additional lines:
- The Balance line (green) displays your deposit changes.
- The Margin line (gray).
- The Drawdown line (red).
- The Profit chart — a set of candlesticks that gives a visual comprehending of how the equity changes.
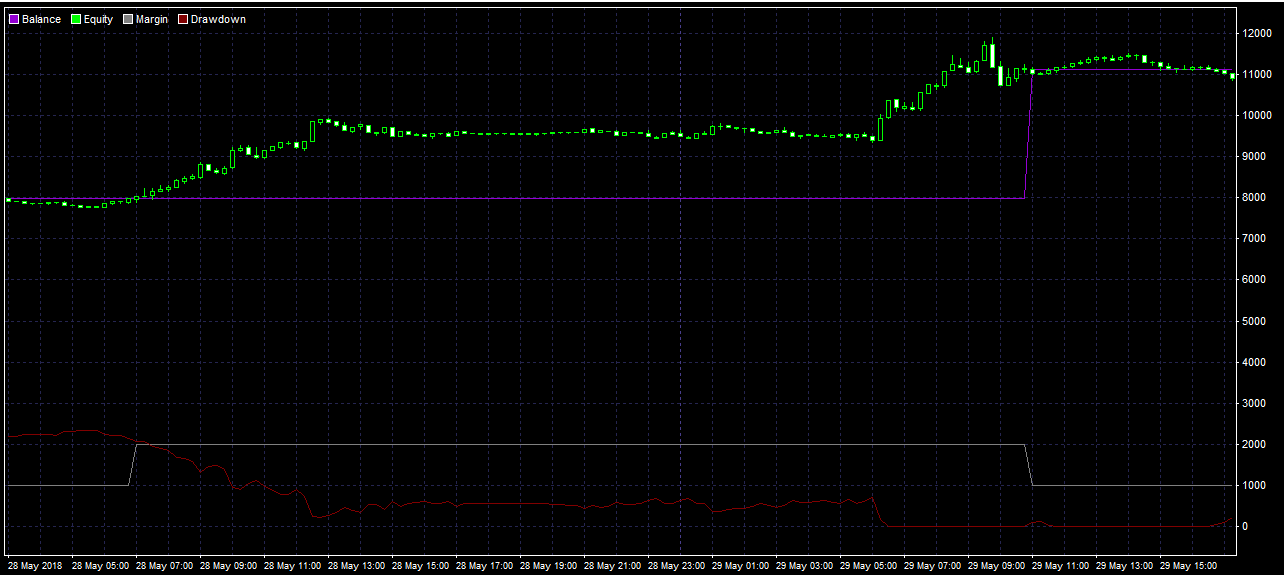
The balance and equity’s main difference is that the balance line can be built only when the trade is closed, whereas the equity line shows all the changes in the account for both open and closed trades.
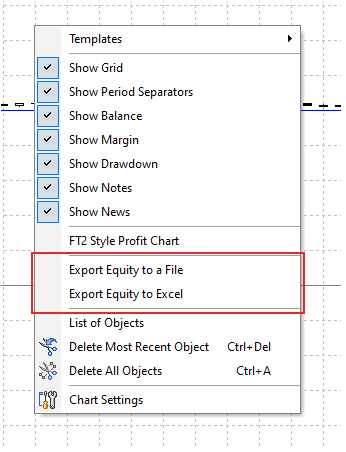
You can export the Profit chart to file or excel for further analysis. To do that, right-click anywhere on the chart and select Export Equity to a File / Excel.
If you right-click the Statistics window, you will be able to export these data to Excel or a *.txt file.
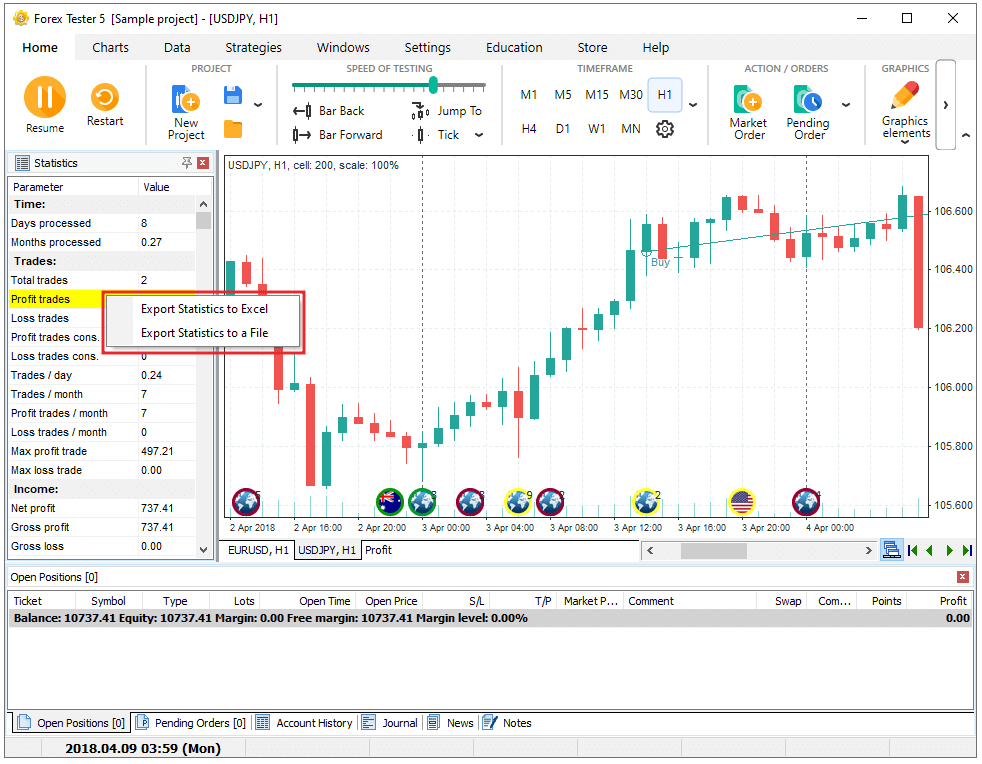
You can disable the statistics window by clicking the “Statistics” button on the Windows tab.
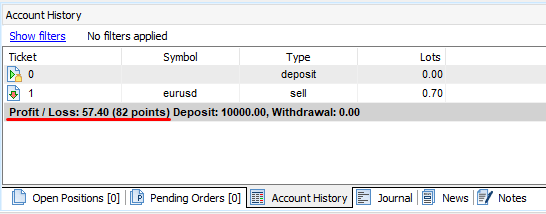
Account History
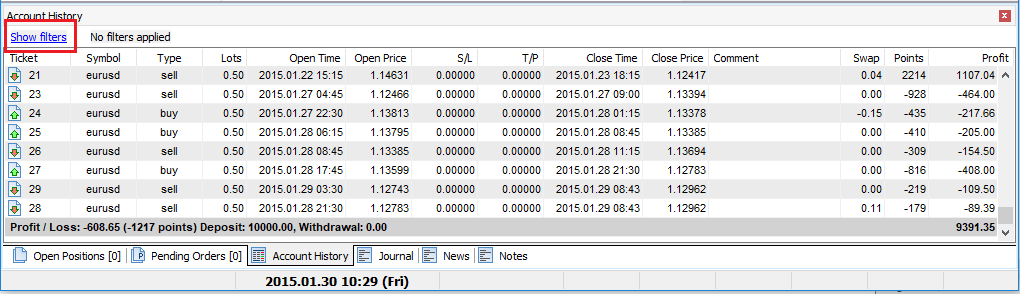
You can also view your Profit and Loss in points on the Account History tab in the “Profit/Loss” row.
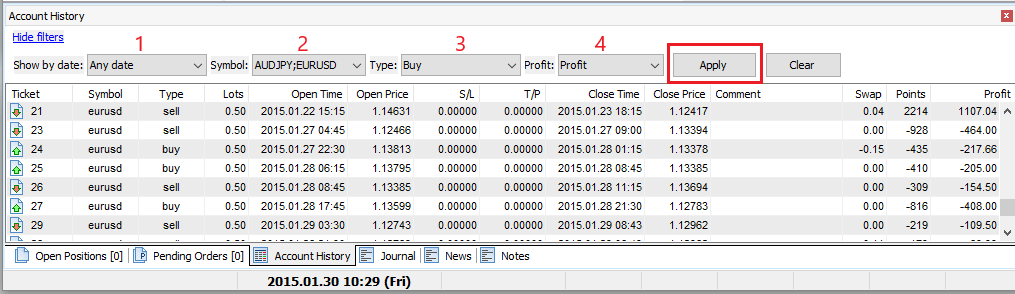
Use different filters to make your trading analysis more convenient by clicking the Show filters link.
You can apply any of the represented filters:
- Date filter — show orders by Open, Close, Open and Close, Open or Close dates.
- Symbol — show only selected symbols.
- Type — show only Buy or Sell or All orders.
- Profit — show all or only profitable/unprofitable orders.
Click Apply to filter the values, or Clear to reset the filters.
You can also export the account history to Excel or text file by right-clicking the Account history tab and selecting a necessary export option.