In 1975, the brilliant modern mathematician Benoit Mandelbrot proposed the term «Fractals» (lat. fractus – broken, fractured) to describe any structures possessing the properties of scaling, self-similarity and «memory» of the initial conditions.
Want to get into the fractals topic deeper? Check another article about this intriguing topic here.
The use of Fractals geometry in the financial systems was not just for analysis, but also for the forecasting. Today the Fractals indicator is used to find the trend reversal points, local price extremes and strong price levels (about A Trader’s Guide to Using Fractals). Let see exactly how this works.
Bill Williams in the well-known «Trade Chaos», first has been suggested to consider market as a chaotic, multiple-factor and self-regulating system, and have cancelled all linear models of the analysis.
However, price Fractals is a more primitive scheme than the one Mandelbrot studied. According to Williams, standard combination of the five bars meets in any scale and it is easy to find them in the chaos.
Fractals − a natural market phenomenon: in a certain period of time, market control is held by one of the parties − sellers or buyers. Indicator Fractals only allows you to determine what exactly is happening in the market − a correction or a real turn.
If the market moves in one direction, then necessarily it comes to a point when all those who want to open positions have already entered the market (the so-called «open interest»), so this time the price comes back. For example, in a bull market, this means that at the moment there are no more buyers.
After working out the Stop Loss of «nervous» sellers, the price will go up again to cover all the «open interest» for the purchases. After the equilibrium point, Fractals are formed and, depending on its direction, one can either open positions on the trend, or to trade in the direction of the turn.
Fractals linkages of the exchange prices have been repeatedly confirmed by the results of the computer modeling (see The Misbehavior of Markets: A Fractal View of Financial Turbulence)
Pattern that Williams called «price fractal» does not quite match the mathematical theory and, in fact, is a classic local extremum on a segment of 5 (or more) bars. Fractal shows the price level at which market tried, but failed to establish a new max/min (You can see here).
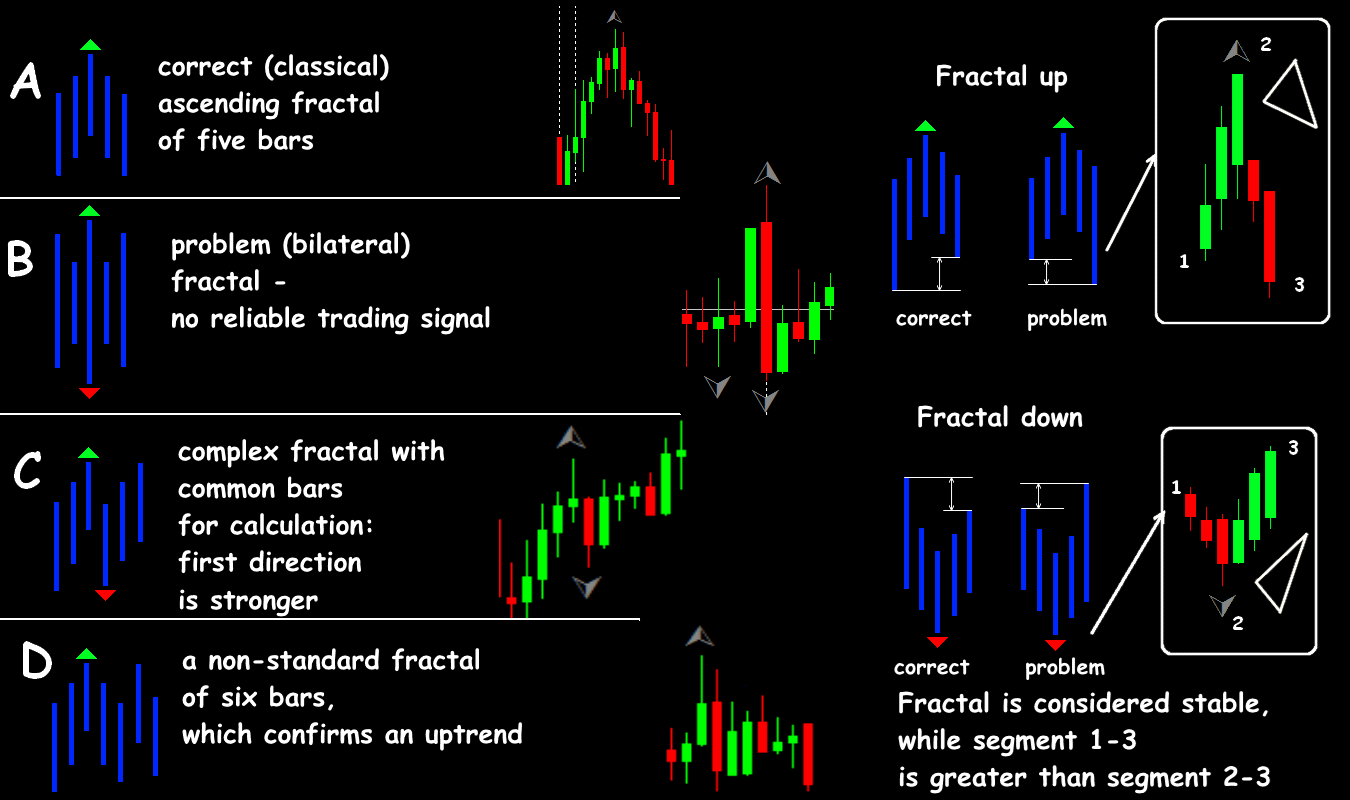
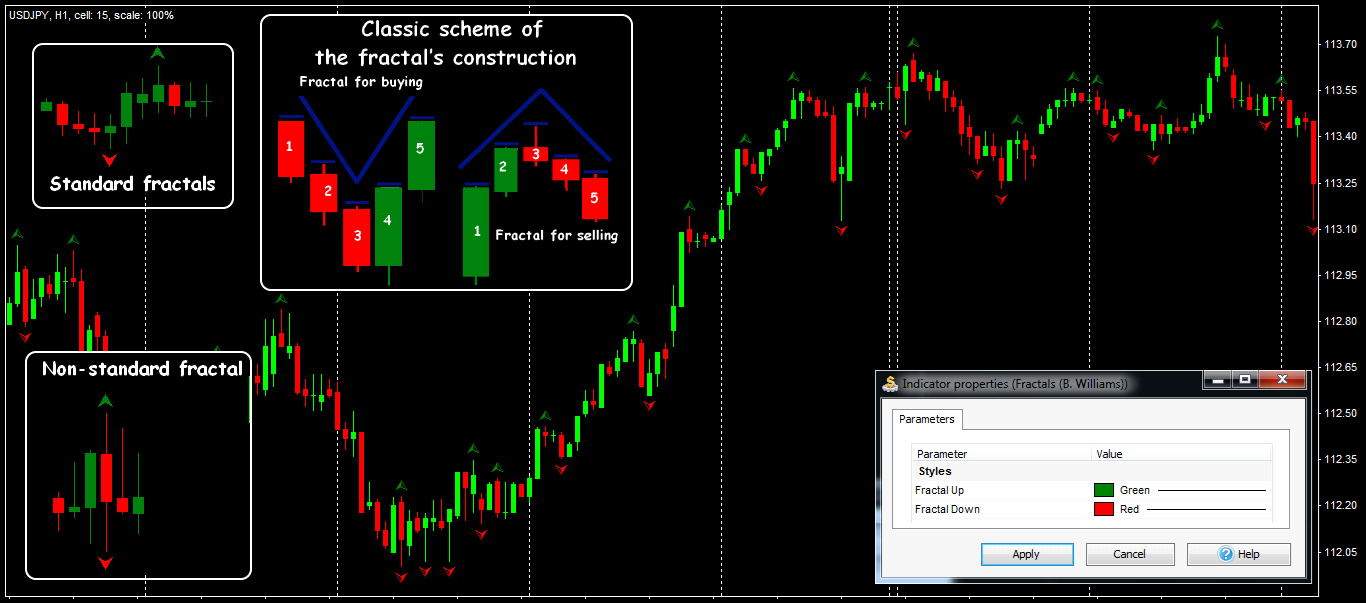
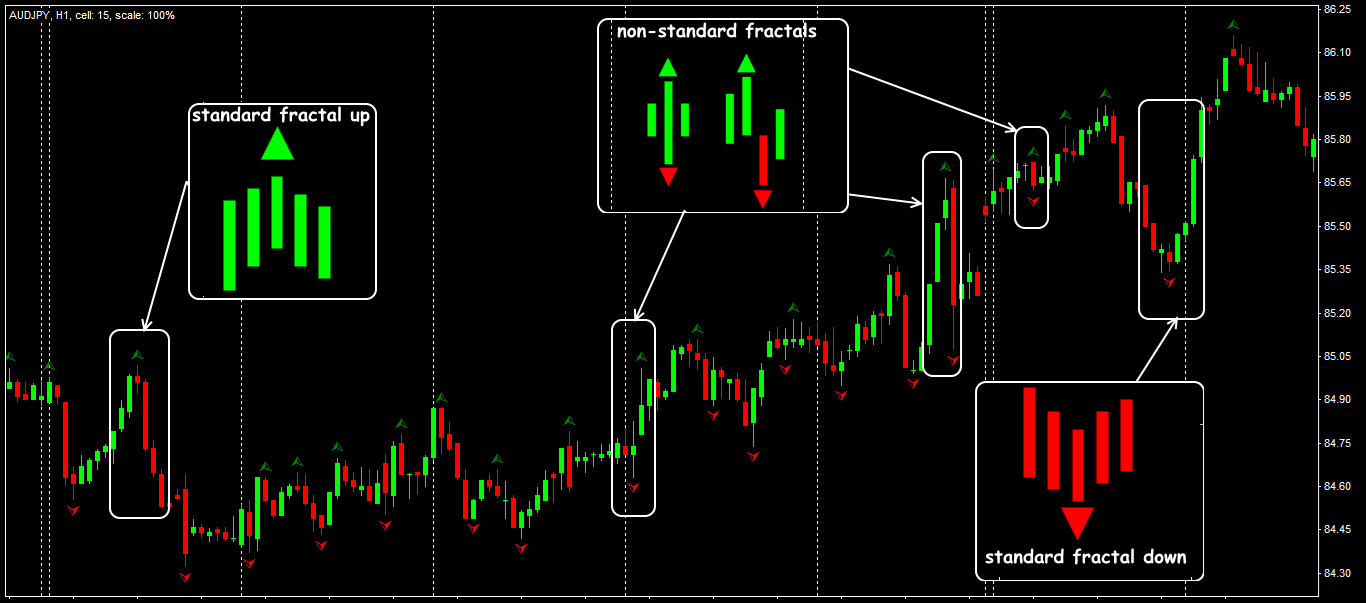
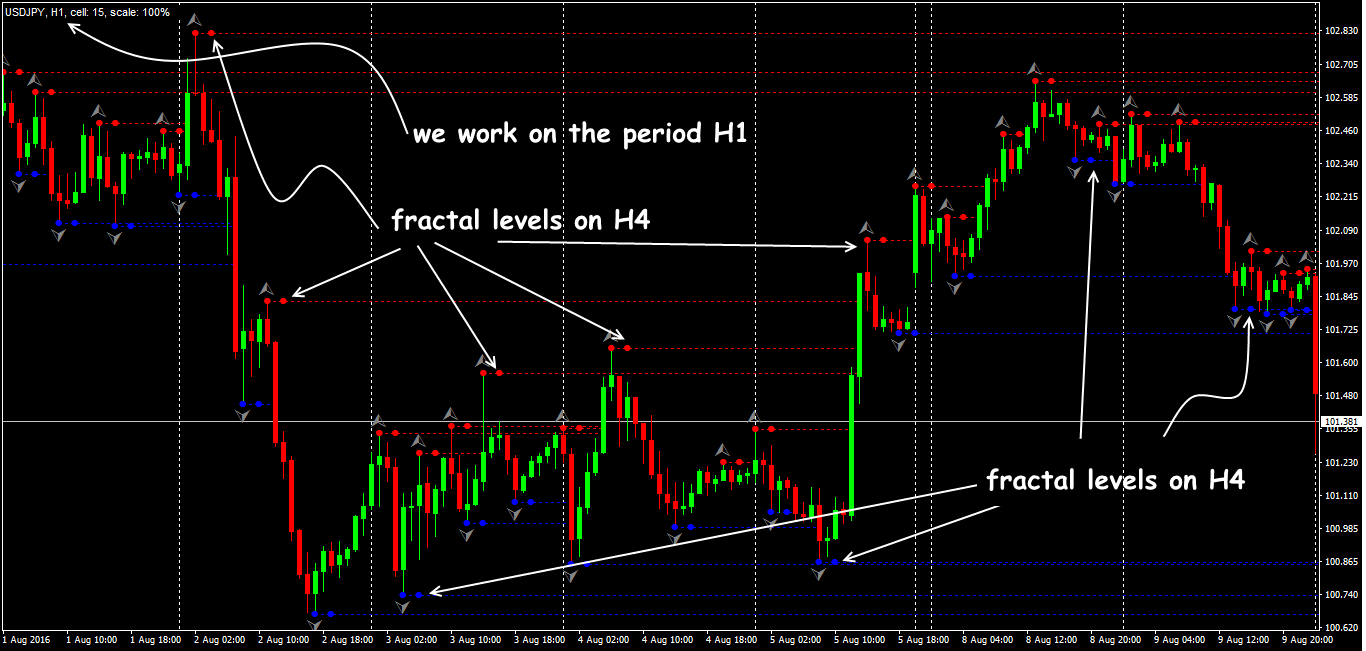
A standard fractal must contain two candles in one direction, two in the opposite direction and a central extremum. Most often, it is supposed to trade from correction – to open the deals in the opposite direction from fractal.
- «Fractal-up» is a combination of 5 (or more) consecutive bars, in which middle has the highest maximum.
- «Fractal down» is a scheme of 5 (or more) consecutive bars, in which average has the lowest minimum.
While identifying the Williams fractal, the inner bars can be neglected. According to the classical theory, the difference between the value of the price increase in left part of the fractal (momentum) and in its right side (rollback) is called the «lever»; the more it is, more opportunities for profit.
When price has returned to the moment of formation of a fractal, lever is supposed to be equal to zero, and fractal is considered closed (Supremum of all y-coordinates of the Mandelbrot set).
Further development of the fractal models can be calculated using the conventional methods for determining key levels, for example, Fibo or Pivot. To make a decision, only bars with extreme values are used.
On the «live» market, ideal Fractals appear rarely, but Williams’ logic allows that the extremes inside pattern can be inconsistent − key bar (with a fractal) need not be in center. If there are two such points (max or min) in pattern, only the «fresh» (last) extremum is taken into account for making a trading decision.
There are techniques for analyzing «incomplete» Fractals (3-4 candles), but because of the multitude of the «false» signals, they are only recommended for experienced traders.
A high probability of redrawing is a serious problem of the fractal analysis. It is assumed that the direction of the pattern is confirmed by the last closed bar.
Before entering market, the fifth candle in scheme must necessarily be closed, otherwise during the formation of the fifth bar a speculative price roll is possible. If the last candle is closed above the current max or lower min then the entire pattern is «cancelled» and even visually disappears from price chart.
Parameters and control
Indicator Fractals is included to the basic toolbox of all popular trading terminals and is displayed on the price chart in the form of up and down arrows on key bar.
The standard version does not provide any parameters, except for color scheme and graphics. We strongly recommend that you find online indicator options that allow you to specify the number of bars to calculate.
The appearance of a Fractals means a strong reversal pulse, the strongest signal is immediately after its appearance, and the same group of candles can be used for both upper and lower Fractals. The arrows of the «old» Fractals are not repainted.
Let’s look at it in detail.
Trading signals of the indicator
The basic trade signal of a turn − an entrance in a direction opposite to a Fractals, Stop Loss − is 1-5 points higher/is lower than border of the key bar. In the case of formation of an opposite Fractals the previous trade signal is cancelled.
The advantage of the Fractals is the opportunity to enter the market, when the direction is guaranteed not to change, so the chances of success are at maximum. To open a deal in the direction of the Fractals, it is recommended to wait at least 1-2 candles. For the short-term transactions, you can enter the market immediately, but in the opposite direction to the Fractals.
As you already know: upper Fractals boundary is maximum, the lower is minimum. The basic trading signal is the so-called «breakdown of the Fractals»:
- for a Fractals up − 1 point higher − breakdown of sellers − a buy order.
- for a Fractals down − 1 point lower − a breakdown of buyers − a sell order.
Stop Loss is located at most remote Fractals extremum of the opposite direction.
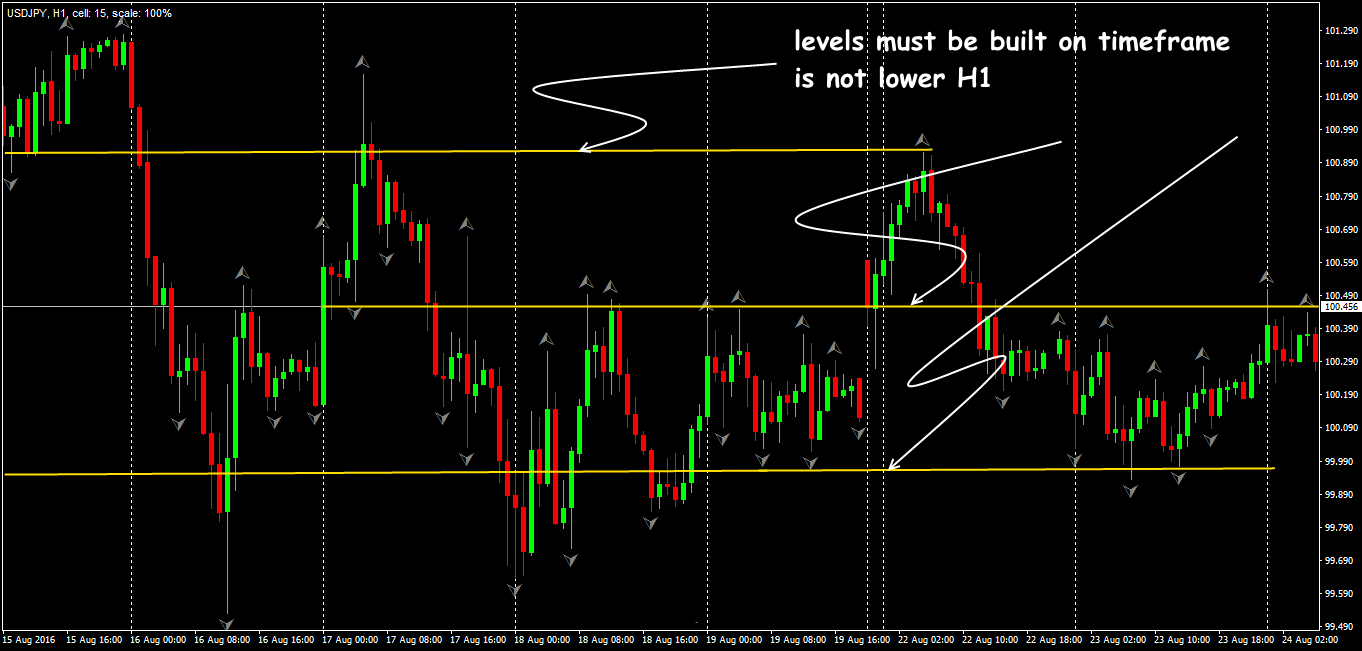
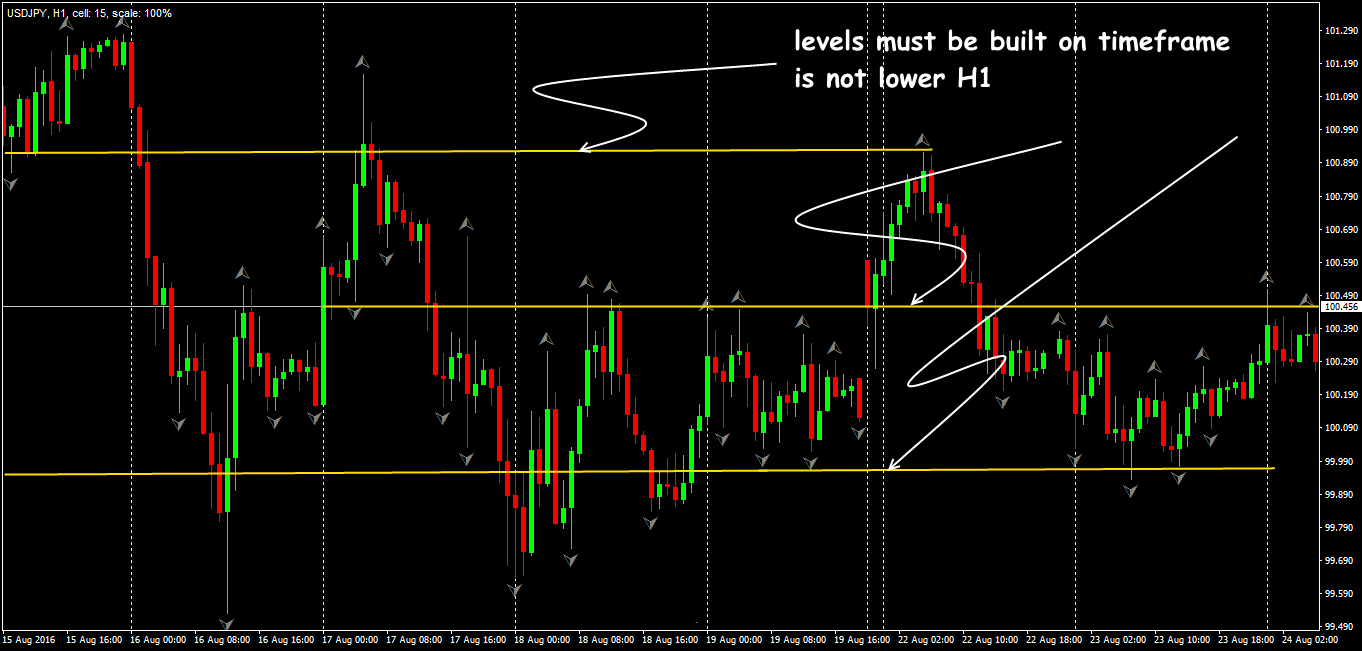
The higher the period of the formation of Fractals structure, the more reliable trading signal it provides. For example, breakdown of a Fractals on a timeframe D1 or W1 is a more reliable signal than at a period of H1 or less.
Now it’s time to discuss the next problem…
Checking either the breakdown is correct
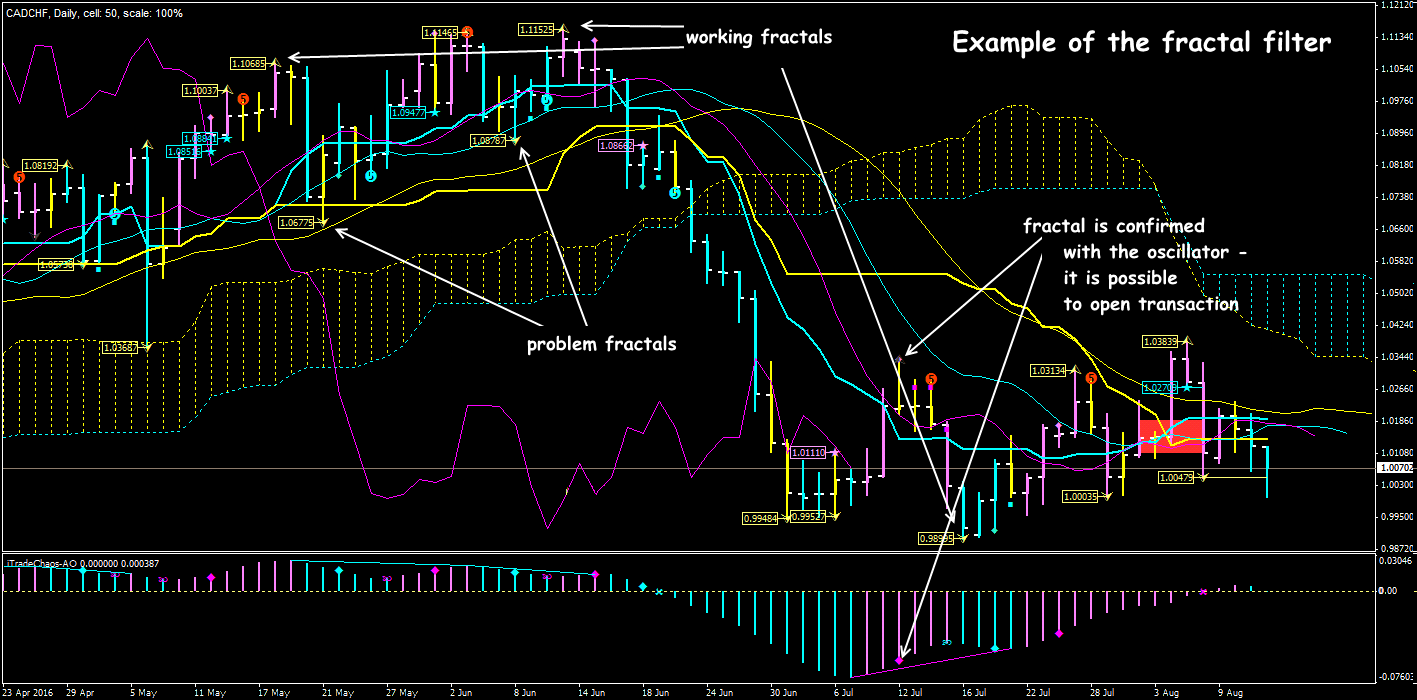
The quality problem (true or false breakdown) is reduced by the evaluating of the correctness of the fractal − any violations of the classical scheme are always interpreted with doubt. A non-standard structure causes less confidence.
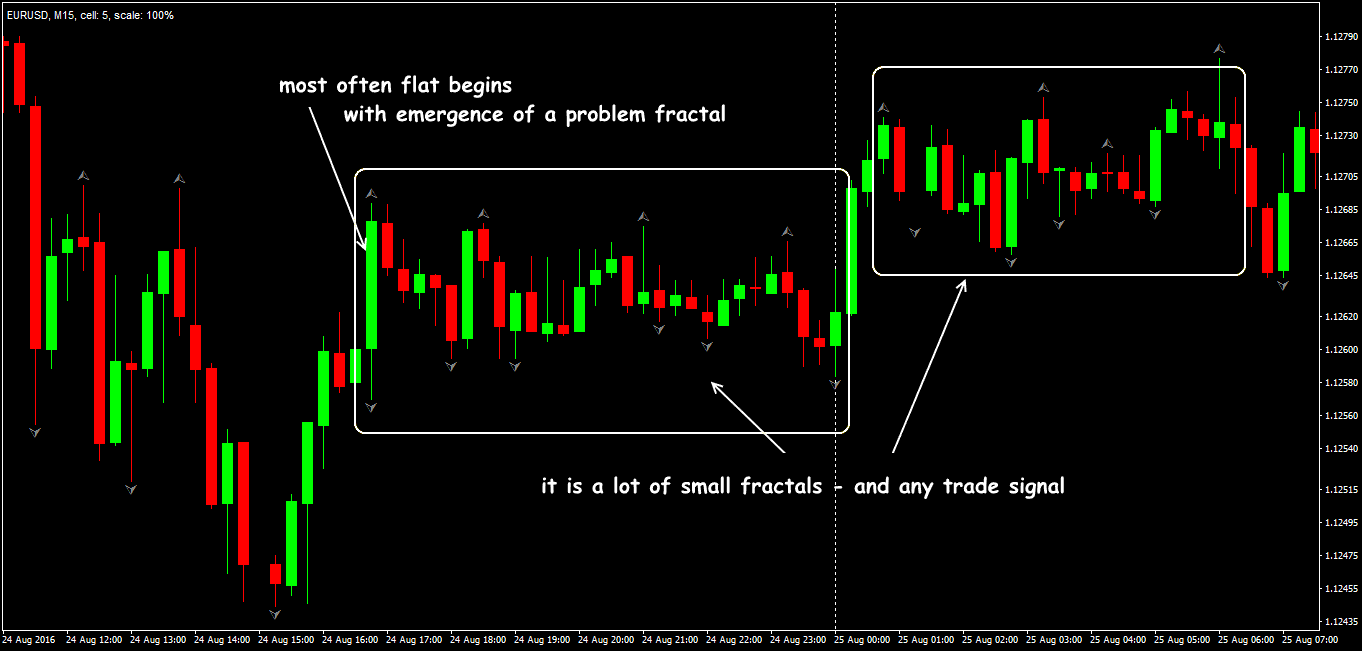
The volatility of the modern market (especially at small timeframes) leads to the appearance of a lot of «false» Fractals and patterns with implicit interpretation, so a filter for fractal signals is needed.
To assess the quality of breakdown, it is necessary to correctly analyze the candle structure, on which this fractal was formed:
- If in a large period the breakdown candle is closed behind the level of accumulation of bars, then on a smaller timeframe, you can open a deal in direction of breakdown.
- If the candle pattern is a classic reversal pattern, then you should expect the appearance of an inverse fractal and transition to the flat.
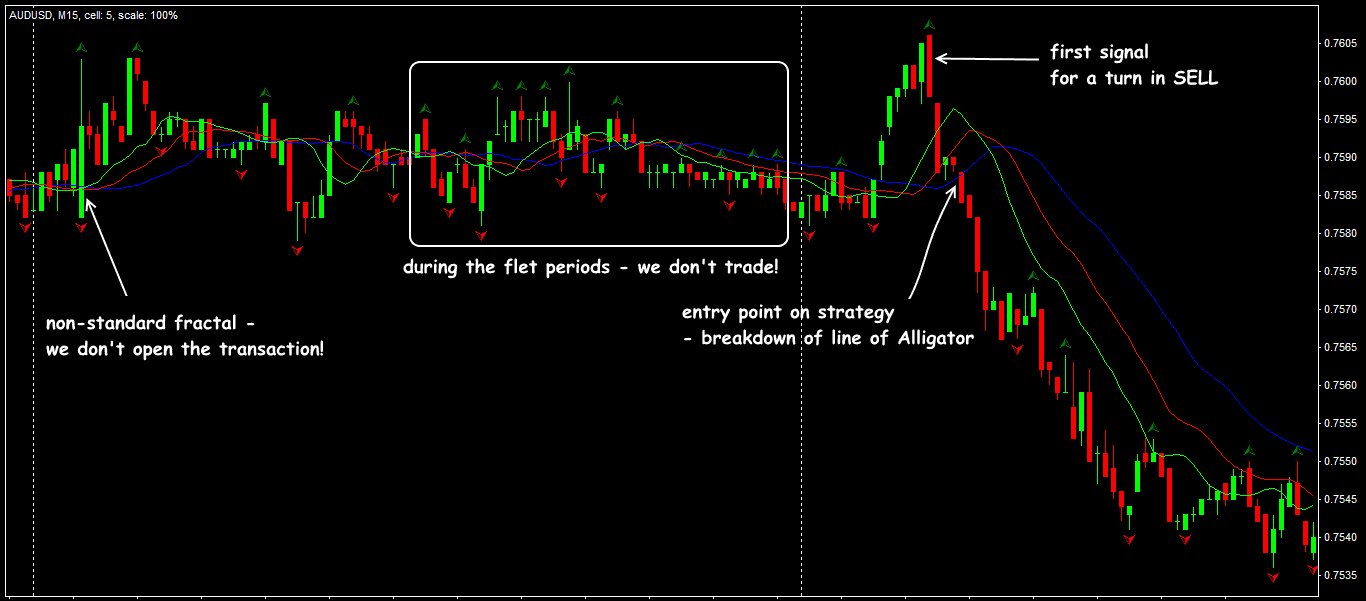
The simplest practical method is trend indicators, for example, breakdown of a fractal above/below any balance line of the Alligator almost always means a strong trend.
There is a rather reliable method of definition of a breakdown of a fractal: when the pattern «makes the way» a candle with a small body and a big shadow. The more such bar, the is stronger a signal; if breakdown candle small, then and a signal is considered weak. If after breakdown of a fractal, for example, the last bar is closed abroad, breakdown candles, then breakdown, most likely, false (see here).
The result?
When a fractal is finally formed, depending on where it is in the market, it can be considered a fractal start, a fractal signal, or a fractal stop.
From the point of view of trading strategy, fractal start is a scheme in which a signal is generated in the opposite direction. Fractal start/signal bunch is always formed on one timeframe. Fractal start is also considered the situation with the appearance of two differently directed Fractals (sometimes − even on one candle) − the market should make a decision in favor of one of the directions. Fractal stop − the remote fractal extremum of the last two Fractals, the part in the opposite direction, more often, this penultimate opposite-directed fractal.
If at some level there are several differently directed Fractals with the subsequent breakdown of the level, then it is worth waiting for a long trend in the direction of breakdown.
Application in trade strategy
Bill Williams recommended using fractal only for breakout strategies, although countertrend methods also have a right to life. It is necessary to have a certain balance line on the price chart, for example, the moving average, the border of the channel, the Fibo level.
In practice, Fractals are used for:
-
- determine the entry point:
… at the breakdown of levels that the price failed to penetrate and could not gain a foothold on them. More often − a pending order for several points above/below the bull/bear fractal.
-
- confirmation of the trend:
… if the trend is up, the Fractals are upgraded more often, during the bearish trend, Fractals are often updated at local minimum.
-
- confirmation of the flat:
… an unsuccessful attempt to breakdown the previous extremum or the appearance of an implicit (problem) fractal.
-
- Loss Stop orders installation:
… only at the level of the last fractal − at the max/min shadow; upper shadow − sale, lower − purchase.
-
- turn signal:
Traditionally, we recommend the author’s technique Williams Fractal + Alligator:
… as well as a multi-period version of the indicator:
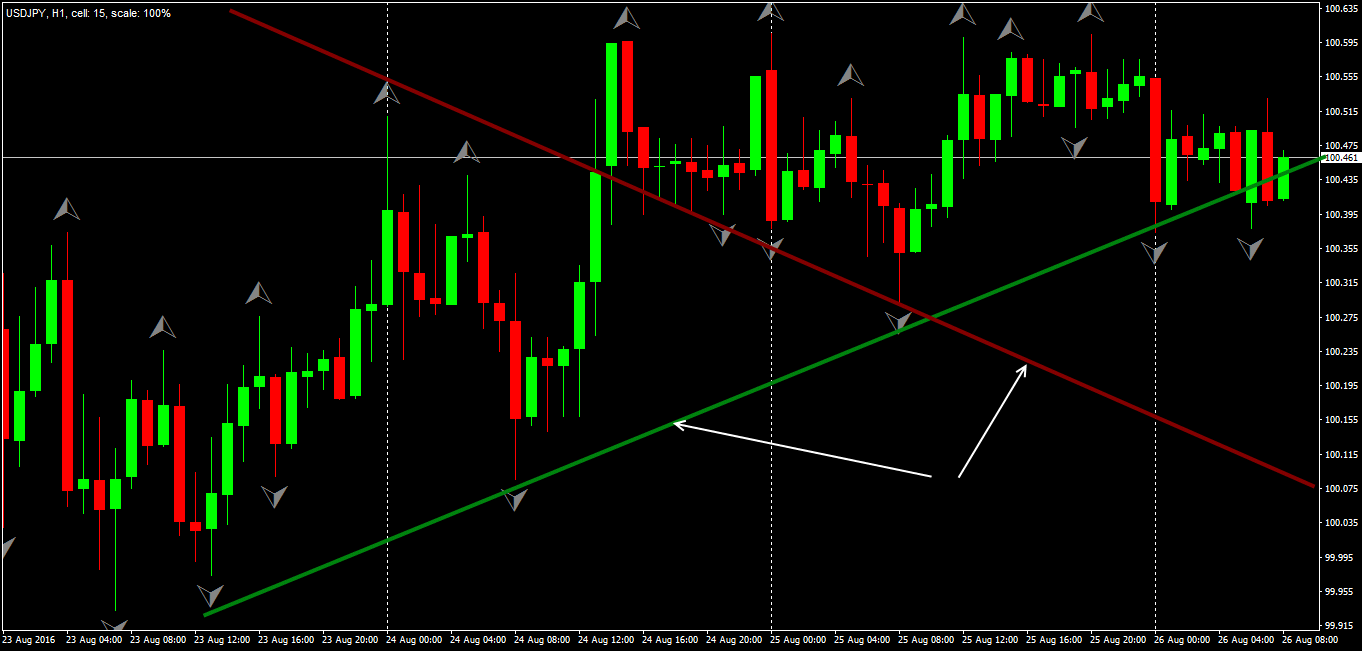
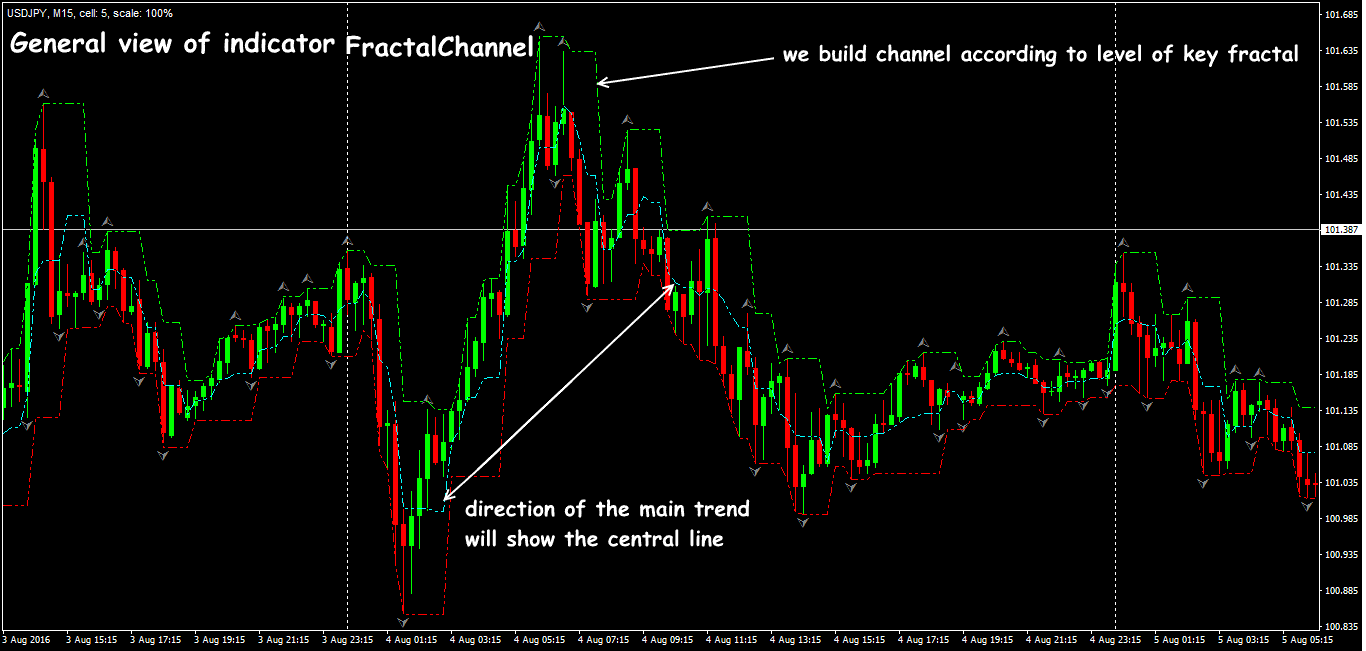
Stable results are obtained when trading in a channel: if Fractals are used as signals of breakdown of borders …
… for example, SenkouSpanA and SenkouSpanB lines, as well as lines of the Kumo Cloud of Ichimoku Kinko Hyo.
Several practical remarks
Symmetry of the long-term and short-term price fluctuations on the market is no longer in doubt, but when using Fractals, it is worthwhile to be cautious.
Popular technical indicators easily «draw» you on the price chart a lot of Fractals of any design, color and dimension. However, fractal analysis is not an easy method, its result is ambiguous, and therefore its use is not recommended for beginners.
In terms of the conventional logic, Fractals do not predict the price: if you follow Williams’ theory, fractal breakdown is the third, final and, naturally, lagging signal.
Indicator Fractals has practical meaning only as part of a comprehensive strategy, and only for periods of more than one hour and only as a support for the main trading solution. Fractals appear on all timeframes − from a minute to a year, the strongest will be patterns that are visible on several periods simultaneously. Transactions need to be concluded only on short-term Fractals in the direction of long-term ones (see here).
The fractal signal cannot be compared with other «calculated» indicators, such as Stochastic or MACD.
True breakdown of the fractal must necessarily be confirmed by volumes, otherwise externally a «strong» candle, but with a small volume will be an unstable signal. Fair enough in such cases works the method of Price Action.
What this means is:
the fractal analysis is effective during periods of stable trend, but even in a wide flat can be unprofitable.
Share your personal experience of effective use of the indicator Fractals. Was this article useful to you? It is important to us to know your opinion, share it in the comments below.
Try It Yourself
After all the sides of the indicator were revealed, it is right the time for you to try either it will become your tool #1 for trading.
In order to try the indicator performance alone or in the combination with other ones, you can use Forex Tester Online with the historical data that comes along with the program.
Simply get Forex Tester Online. In addition, you will receive 23 years of free historical data.
Share your personal experience of effective use of the Indicator Fractals. Was this article useful to you? It is important for us to know your opinion.
 Backtest Your Trading Strategy
 ไทย
ไทย
 Tiếng Việt
 Polski
 Türkçe
 Nederlands
 Română
 한국어
한국어
 Svenska
