Summarize at:
Adaptive indicators of the AT&CF trading system are synthesized using the modern technique of digital filters, and the flow of market prices is used as an array of data. The result is obtained in the standard form: the direction of the trend and the probability of its continuation.
To put it more simply, the spectral analysis of any financial market is a software application from the theory of signals, which is used in any digital systems.
There are no analogues to these tools, their super-efficiency for price analysis is not proven, but the methods of interpreting the results are similar to the standard Forex indicators, so let’s begin. Who knows, maybe the FTLM-STLM indicator is profitable.
Logic and purpose
The idea of using adaptive methods on a financial data set is due to the fact that any available technical analysis tools use «price history» for calculation, and therefore it is impossible to get rid of the delay problem.
All methods of multiple averaging, time correction, volume and other «improvements», dramatically reduce the accuracy of trade signals.
The authors of the AT&CF system suggest to analyze the price signal by means of the Fourier transform and approximate the price dynamics with sinusoids with different parameters of the frequency filters. More information about it can be found here.
The FTLM-STLM indicator is used as an analogue of the traditional Momentum, that is, it must assess the type of the market (bull, bear or flat) and show the end of the current trend.
Calculation procedure
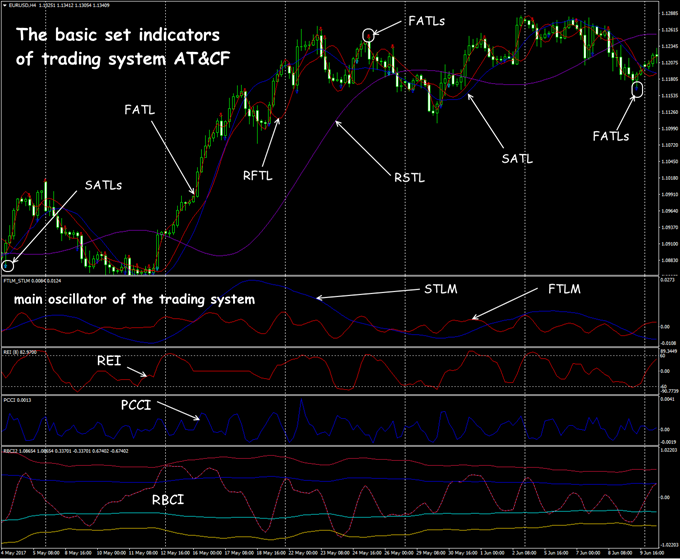
The FTLM-STLM oscillator does not work with real prices, but is calculated on the trend indicators data of the system, that is, it uses prices smoothed as a result of frequency filtering. So first − a little background information.
So, to calculate FTLM-STLM, we need:
- RFTL («fast») and RSTL («slow») reference trend lines;
- analogues of traditional FATL moving averages − «fast» (based on a low-frequency digital filter) and SATL − «slow» (based on a digital filter of the second order).
We remind: adaptive lines FATL and SATL do not have any phase lag about the current prices. Methods for interpreting the results are similar to the standard Forex indicators.
What result do we have?
The proposed indicator combines the FTLM (Fast Trend Line Momentum) line for FATL and STLM (Slow Trend Line Momentum) for SATL and shows the change rate in adaptive averages. Values are calculated as the difference of the corresponding digital filters for each bar:
FTLM(bar) = FATL(bar) − RFTL(bar)
STLM(bar) = SATL(bar) − RSTL(bar)
Parameters and control
The authors of AT&CF proposed it as an automatic trading system, but now each of its elements can be connected to the terminal in usual way and applied for manual trading.
Only the number of bars for calculation and color schemes are usually available from the parameters. For more fine-tuning, curious people can dig into the code.
The trading effect of this indicator outside the general context of AT&CF system raises doubts, but perhaps our readers will be able to extract something promising from it.
Let’s look at it in detail.
Trade signals of the indicator
The use of any adaptive indicators, including FTLM-STLM Forex, as well as any MTS based on them, must comply with the following rules:
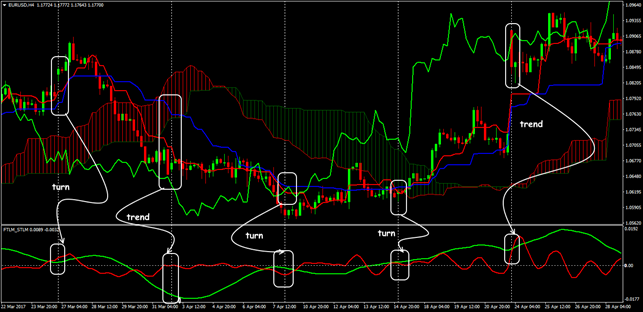
- trading is conducted only in the direction of the strongest trend, which is determined by the SATL line;
- market activity is assessed by the FTLM-STLM indicator;
- on a strong trend, oscillator signals are considered secondary;
- oscillator signals are considered basic if trend indicators do not show a clear trend.
The STLM line is the leading indicator (see VertexFX Client Side Indicator FTLM-S):
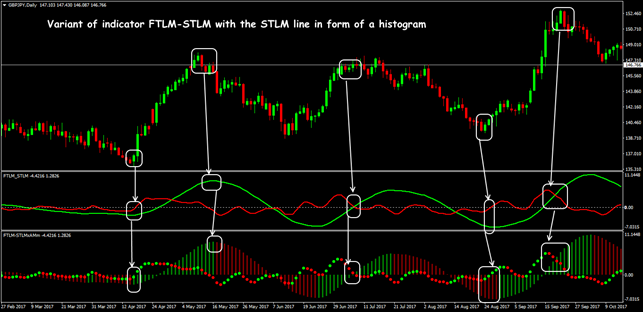
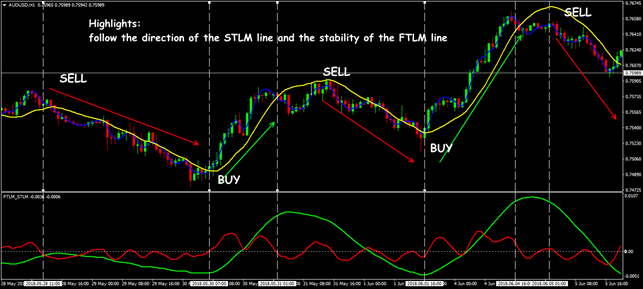
- the moment of the downward trend reversal – the point at which the STLM sign changes from negative to positive;
- the point of uptrend reversal – the moment at which the STLM changes its sign from positive to negative;
- positive STLM − bullish trend, negative – descending;
- the local extremum (max/min) on the STLM line always precedes a similar extremum on the SATL line;
- the appearance of an extremum on the STLM line is a necessary but insufficient condition for reaching the top or the bottom by the SATL line.
Interpretation of the STLM+SATL schemes:
- STLM and SATL lines grow at the same time − upward trend is increasing;
- horizontal and positive STLM line with growing SATL − stable bullish trend, the higher is the absolute STLM value, the greater is potential for growth;
- STLM and SATL lines simultaneously decrease − the bearish trend is increasing;
- horizontal and negative STLM line with a growing SATL line − stable downward trend, the higher is the absolute STLM value, the stronger is potential for fall;
- if both FTLM-STLM lines go simultaneously in one direction, we do not open a deal against them.
When you turn the fast FATL and FTLM indicators from the extreme values down (up), you can add volume to the open position.
Theoretically, the use of indicator FTLM-STLM does not depend on the trading asset and the analysis period. However, timeframes less than H1 are not recommended, and for currency pairs and cross-assets it is best to use H4-D1 and higher, otherwise we get a lot of «false» signals.
Speculative price shots and reactions to fundamental factors are «cut off» by digital filters even at the stage of calculating FATL-SATL and do not cause a special reaction on the FTLM-STLM lines.
The deal is opened at the closing price of the period preceding the appearance of the signal (or lower). The AT & CF system does not give special recommendations on capital management.
Adaptive indicators can be used in conjunction with classical tools, but it is quite sensible to use them as an automated analytical system that would help to identify among the mass of possible signals the most likely ones.
Several practical remarks
The use of spectral analysis is a fundamentally new approach to market research, such systems optimally adapt to any trading asset, do not lag, do not depend on the broker and trading conditions.
Serious analysis on periods at a scale of 1 year is performed precisely by such methods, but the value of such signals is highly doubtful for small capitals and ordinary traders.
It is hardly possible to consider the AT&CF system as professional software that is really used by large players. What this means is that the considered indicator has practical meaning only as a basic oscillator of the AT&CF system, all its signals depend on the other elements.
In addition, at least a medium-term forecast is important for market makers, so FTLM-STLM signals most often look illogical even for intraday trading.
All information about this system is contained only in the author’s articles and a small amount of discussion in the network, full-scale tests were conducted about 8-10 years ago and in most cases author’s recommendations are no longer relevant on the current market. Attempts to develop AT&CF as a commercial product were also unsuccessful.
Even with carefully selected and tested parameters on current quotes, the difference between FTLM-STLM signals and traditional versions of Momentum is minimal on popular currency assets. Nevertheless, the basic ideas of the indicator, like digital filter systems, can be fully used for experiments on creating automated trading strategies.
Try It Yourself
After all the sides of the indicator were revealed, it is right the time for you to try either it will become your tool #1 for trading.
In order to try the indicator performance alone or in the combination with other ones, you can use Forex Tester with the historical data that comes along with the program.
Simply try Forex Tester Online. In addition, you will receive 23 years of free historical data.
 Try Forex Tester Online
 ไทย
ไทย
 Tiếng Việt
 Polski
 Türkçe
 Nederlands
 Română
 한국어
한국어
 Svenska


